Downloaded 68 times
![•
17
being on the unsafe side.
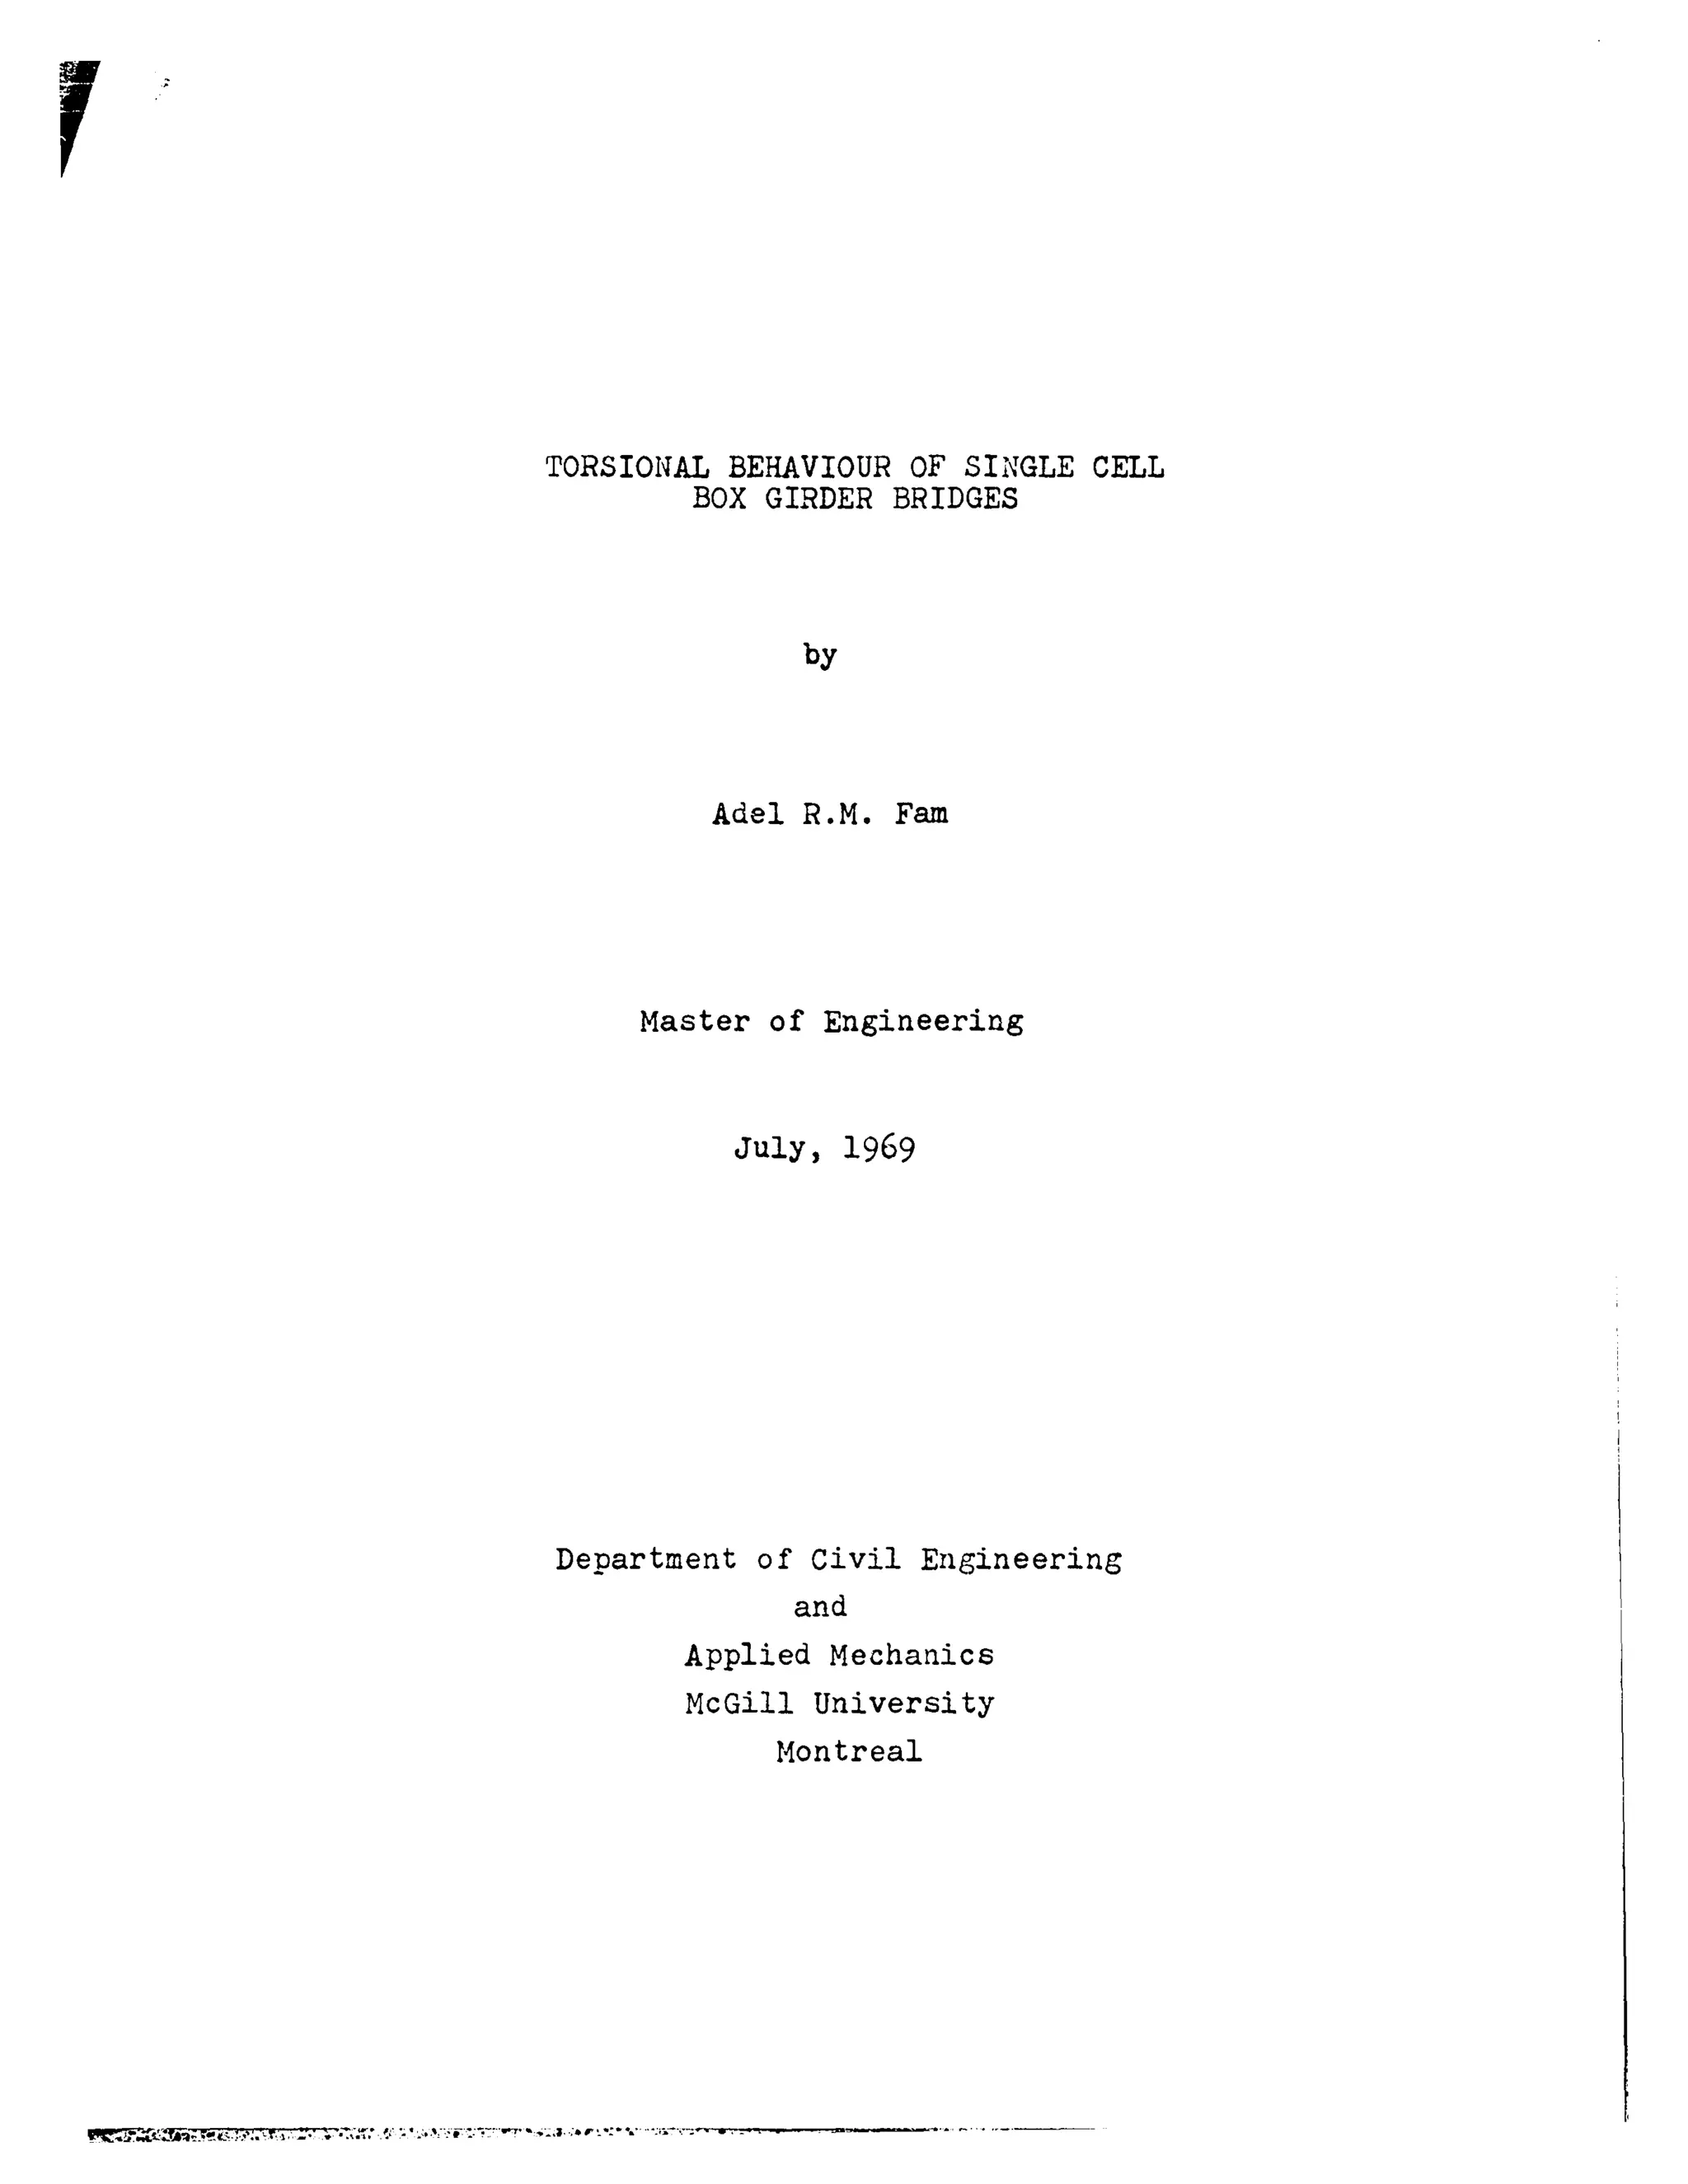
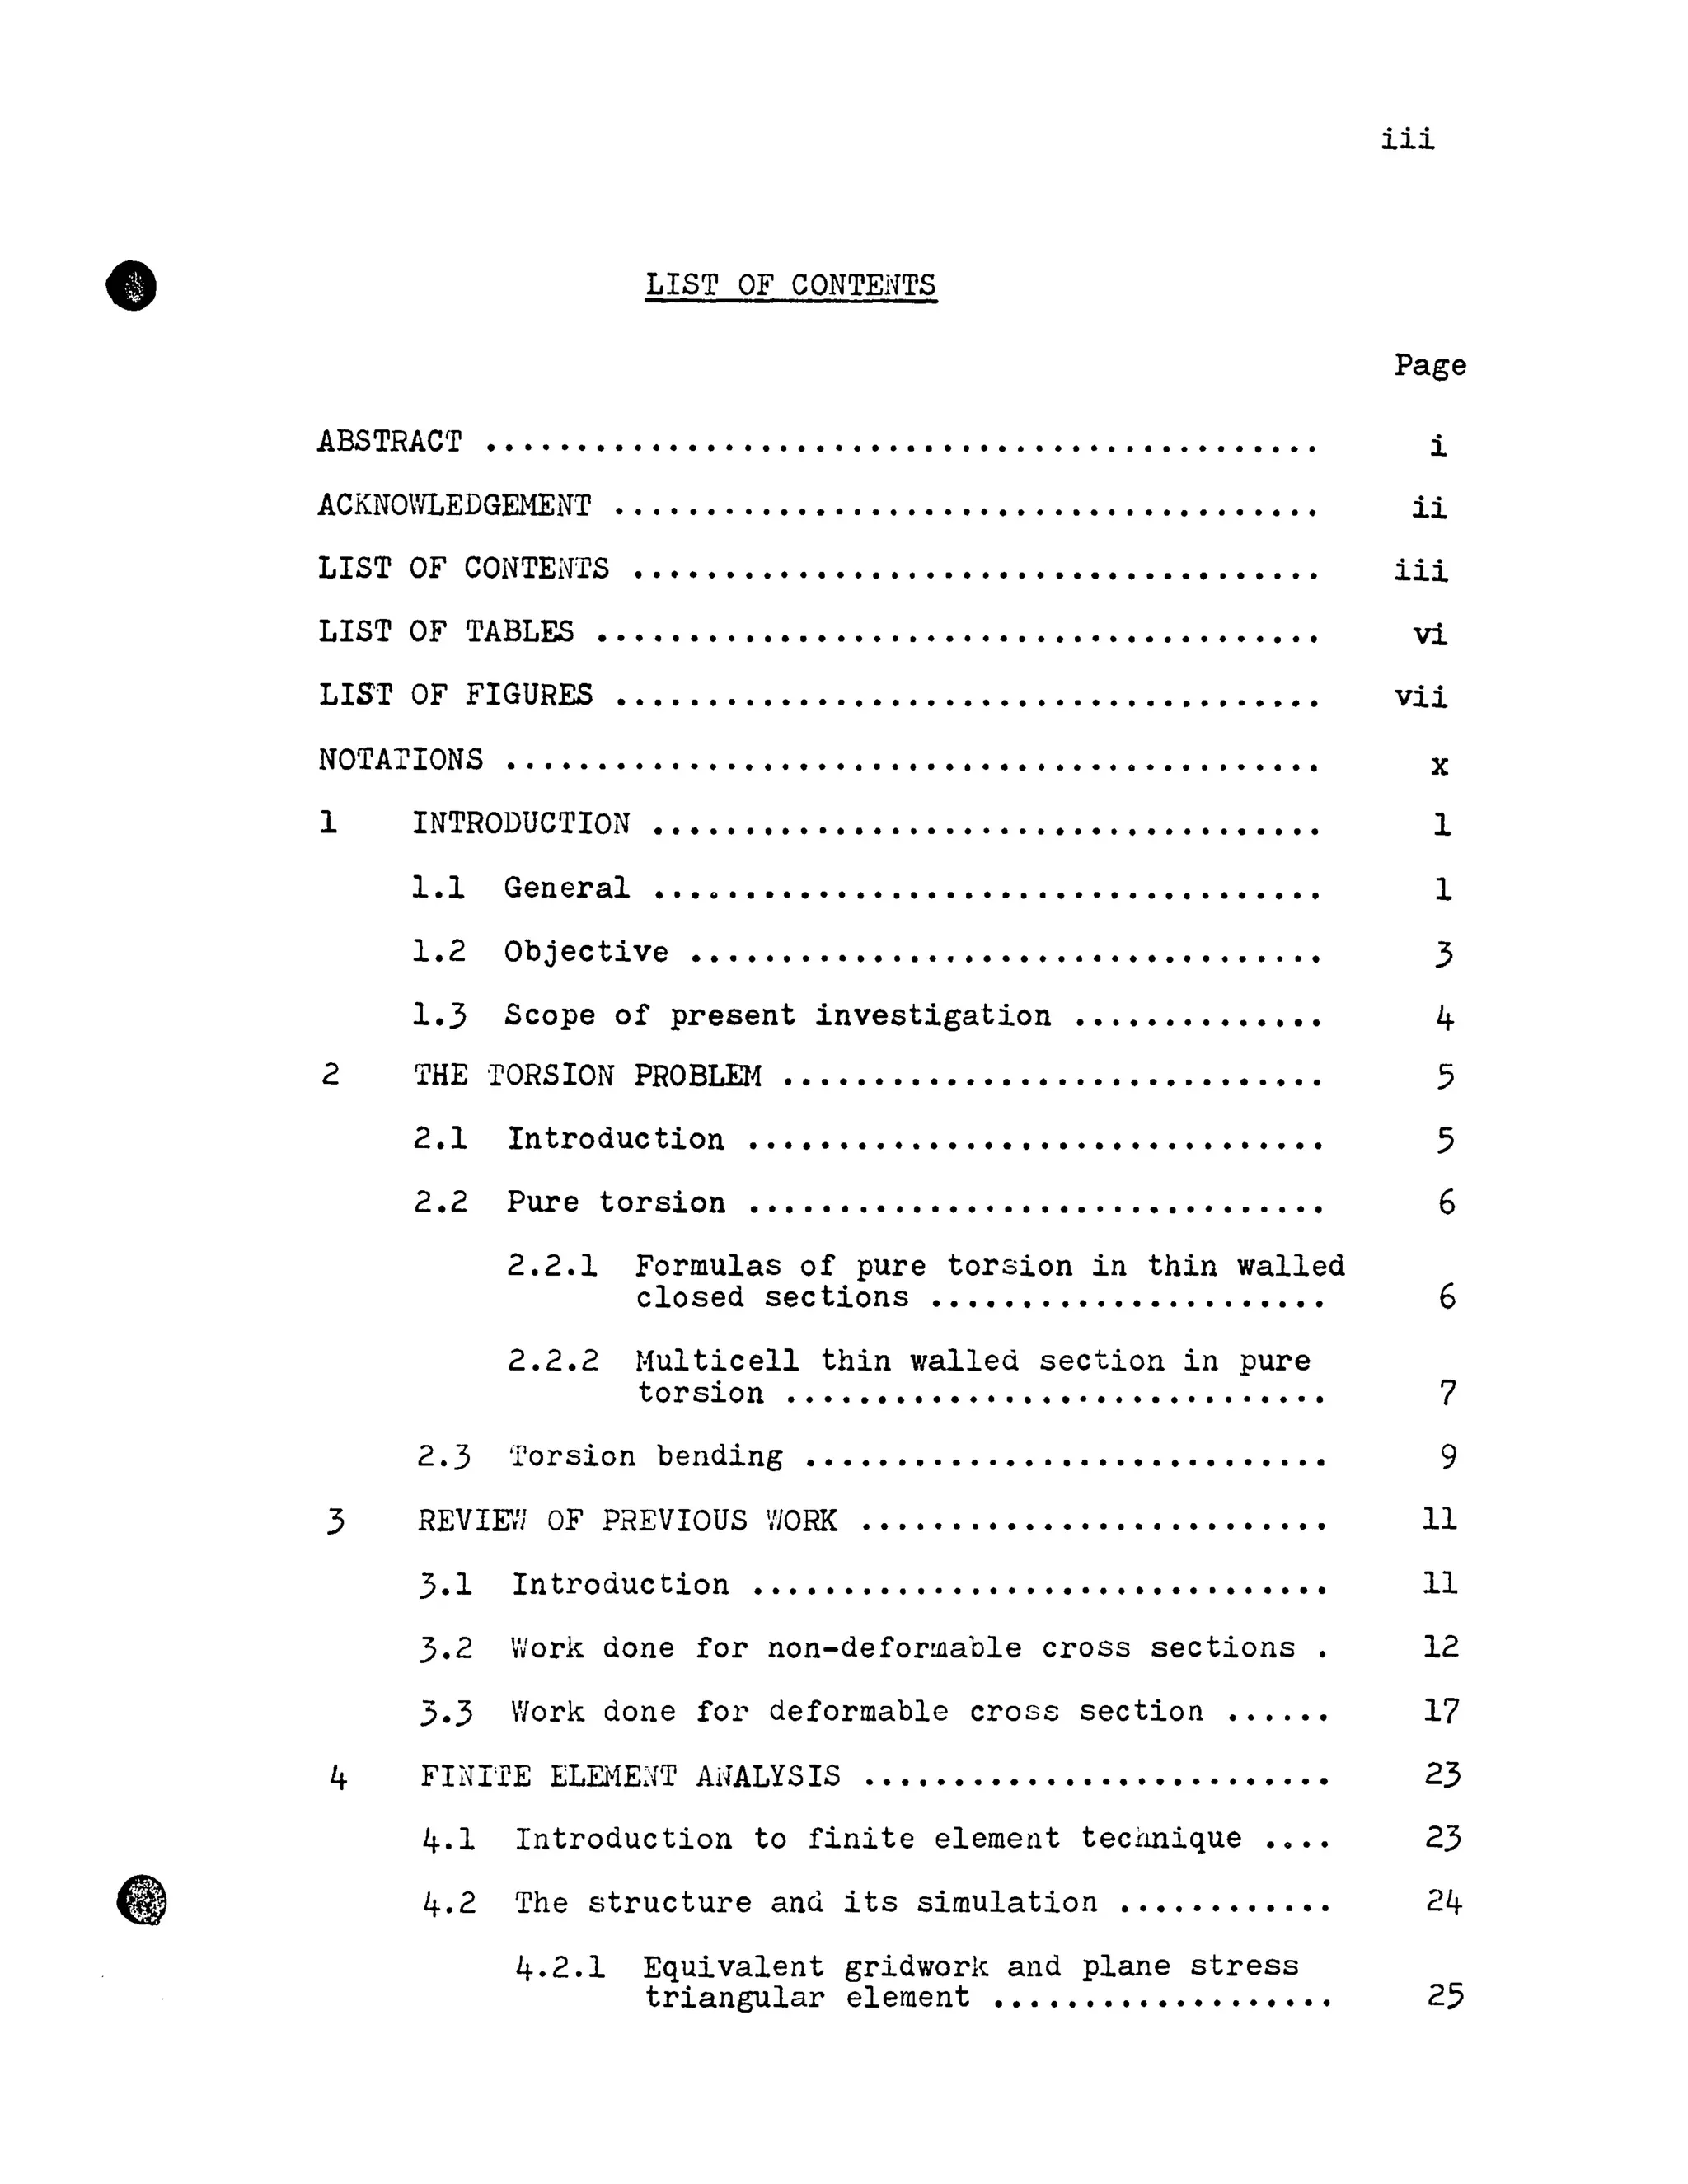
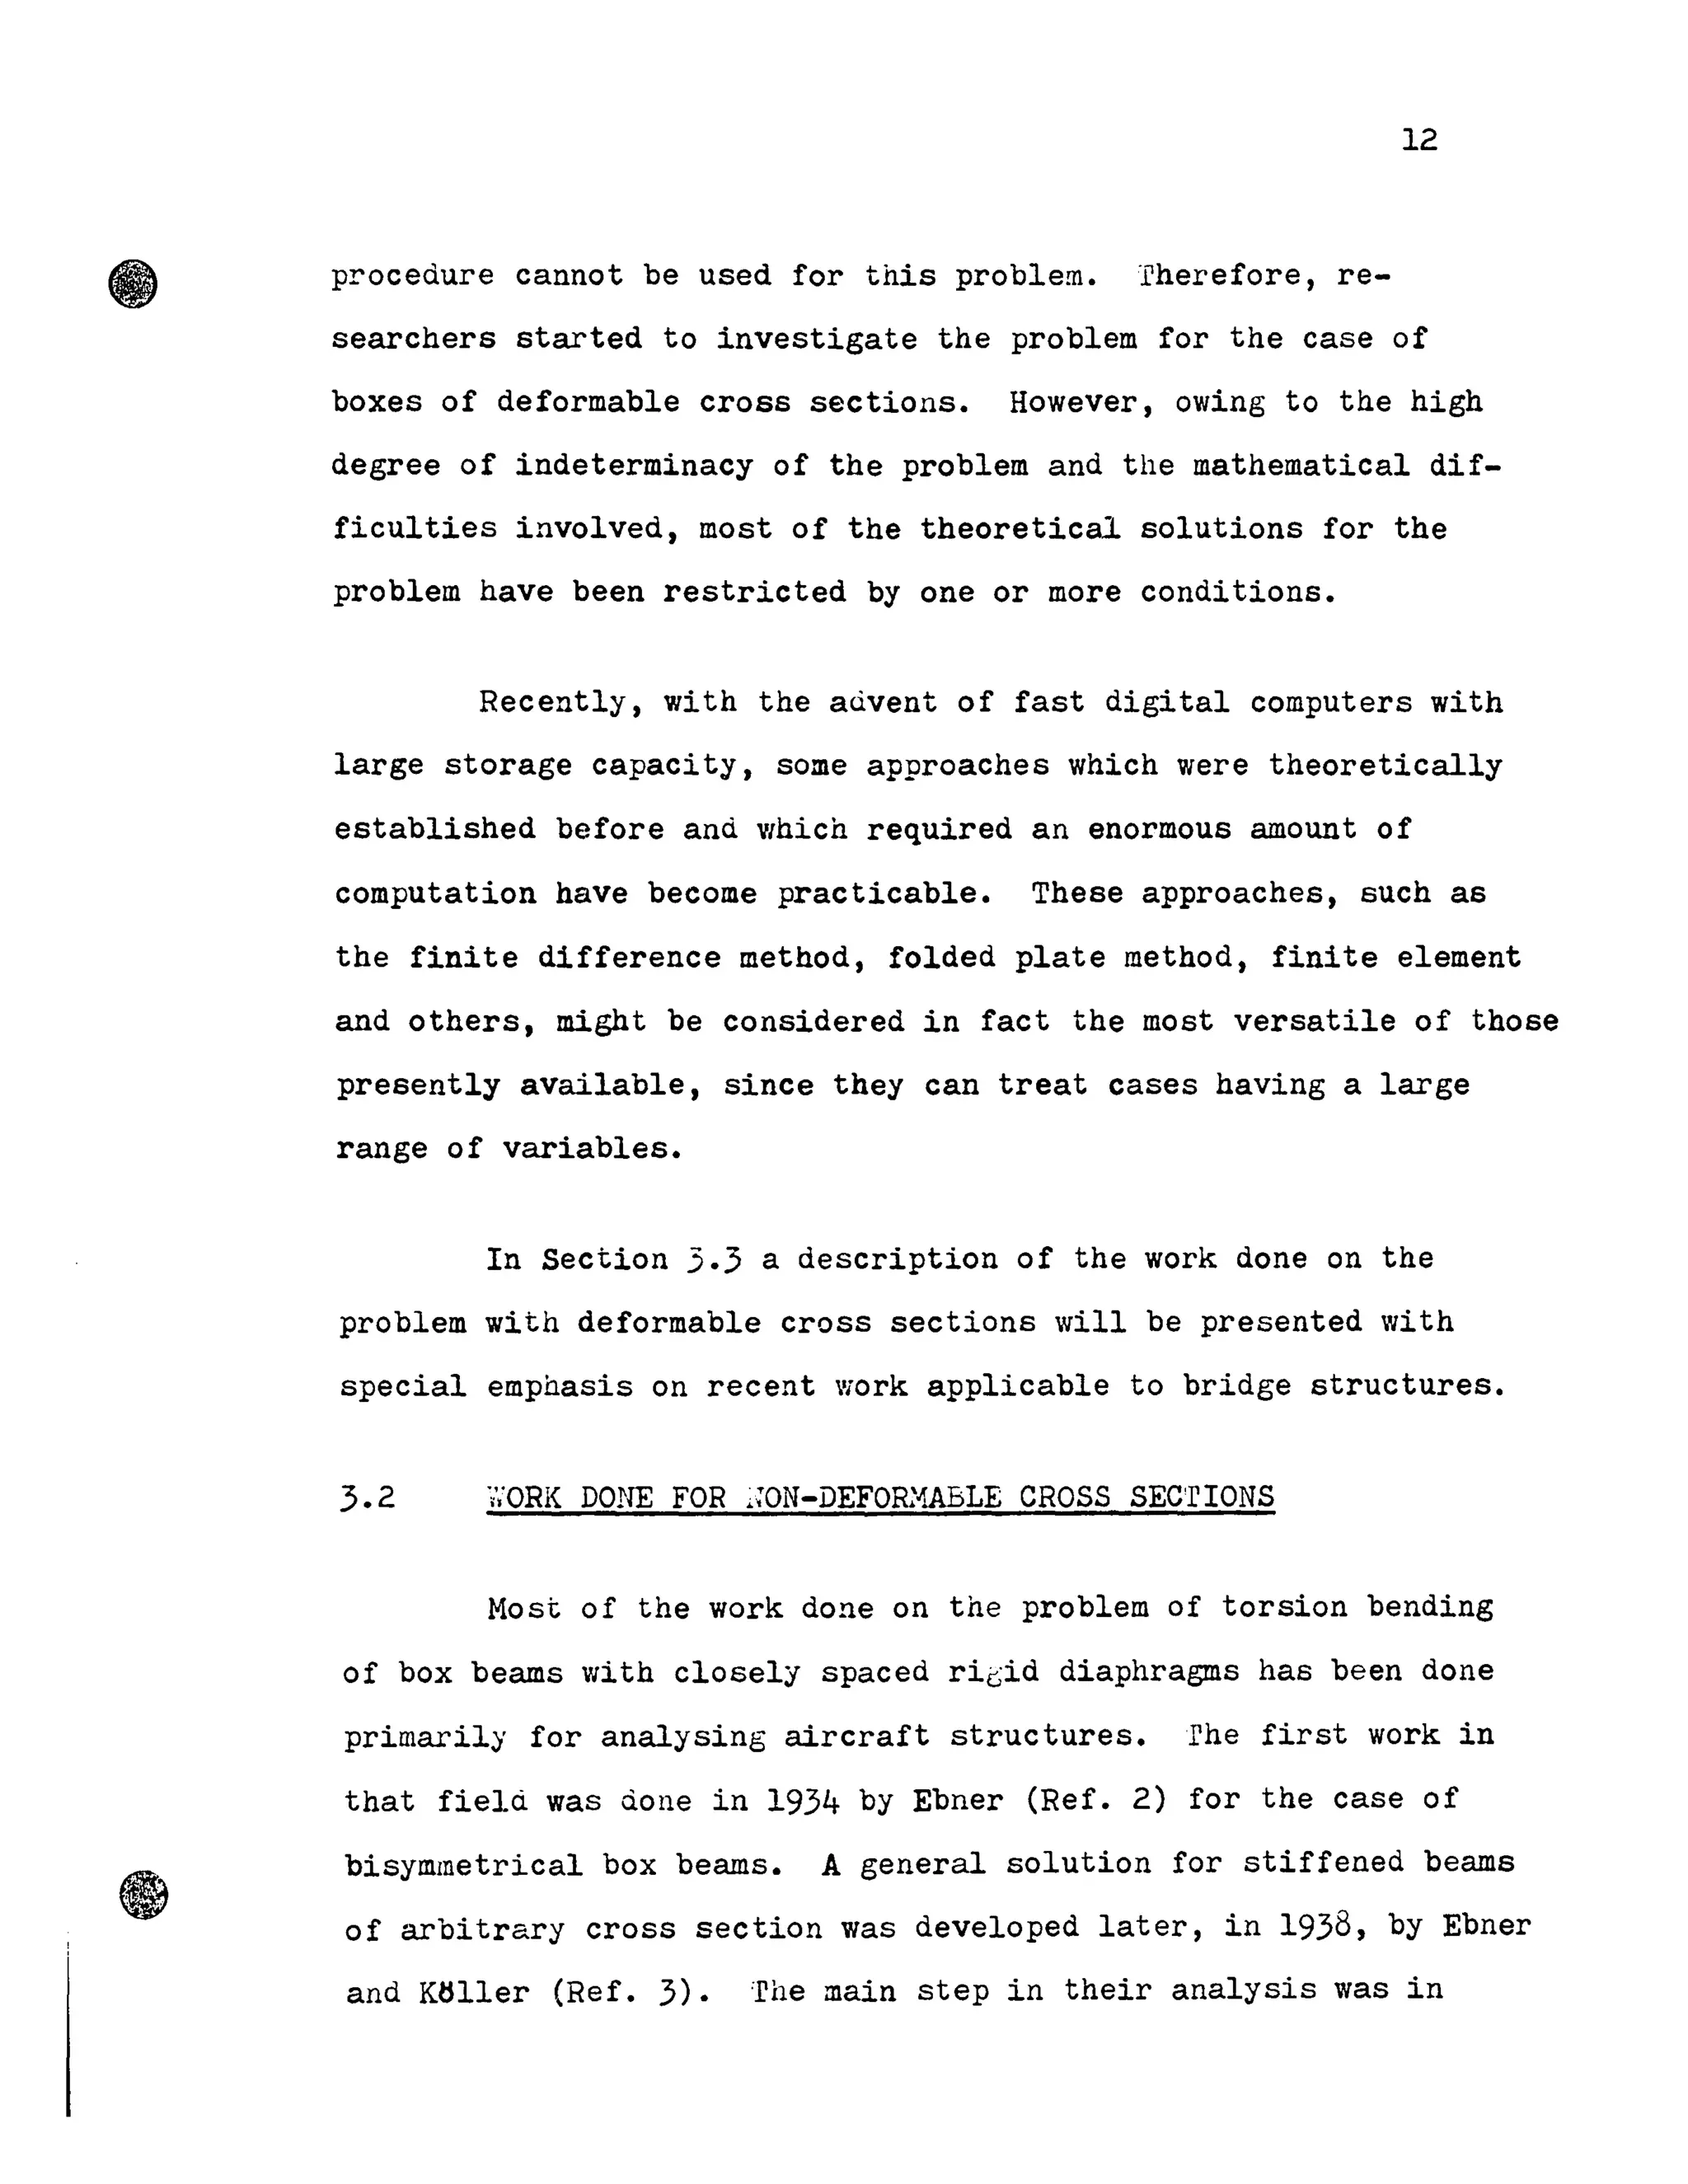
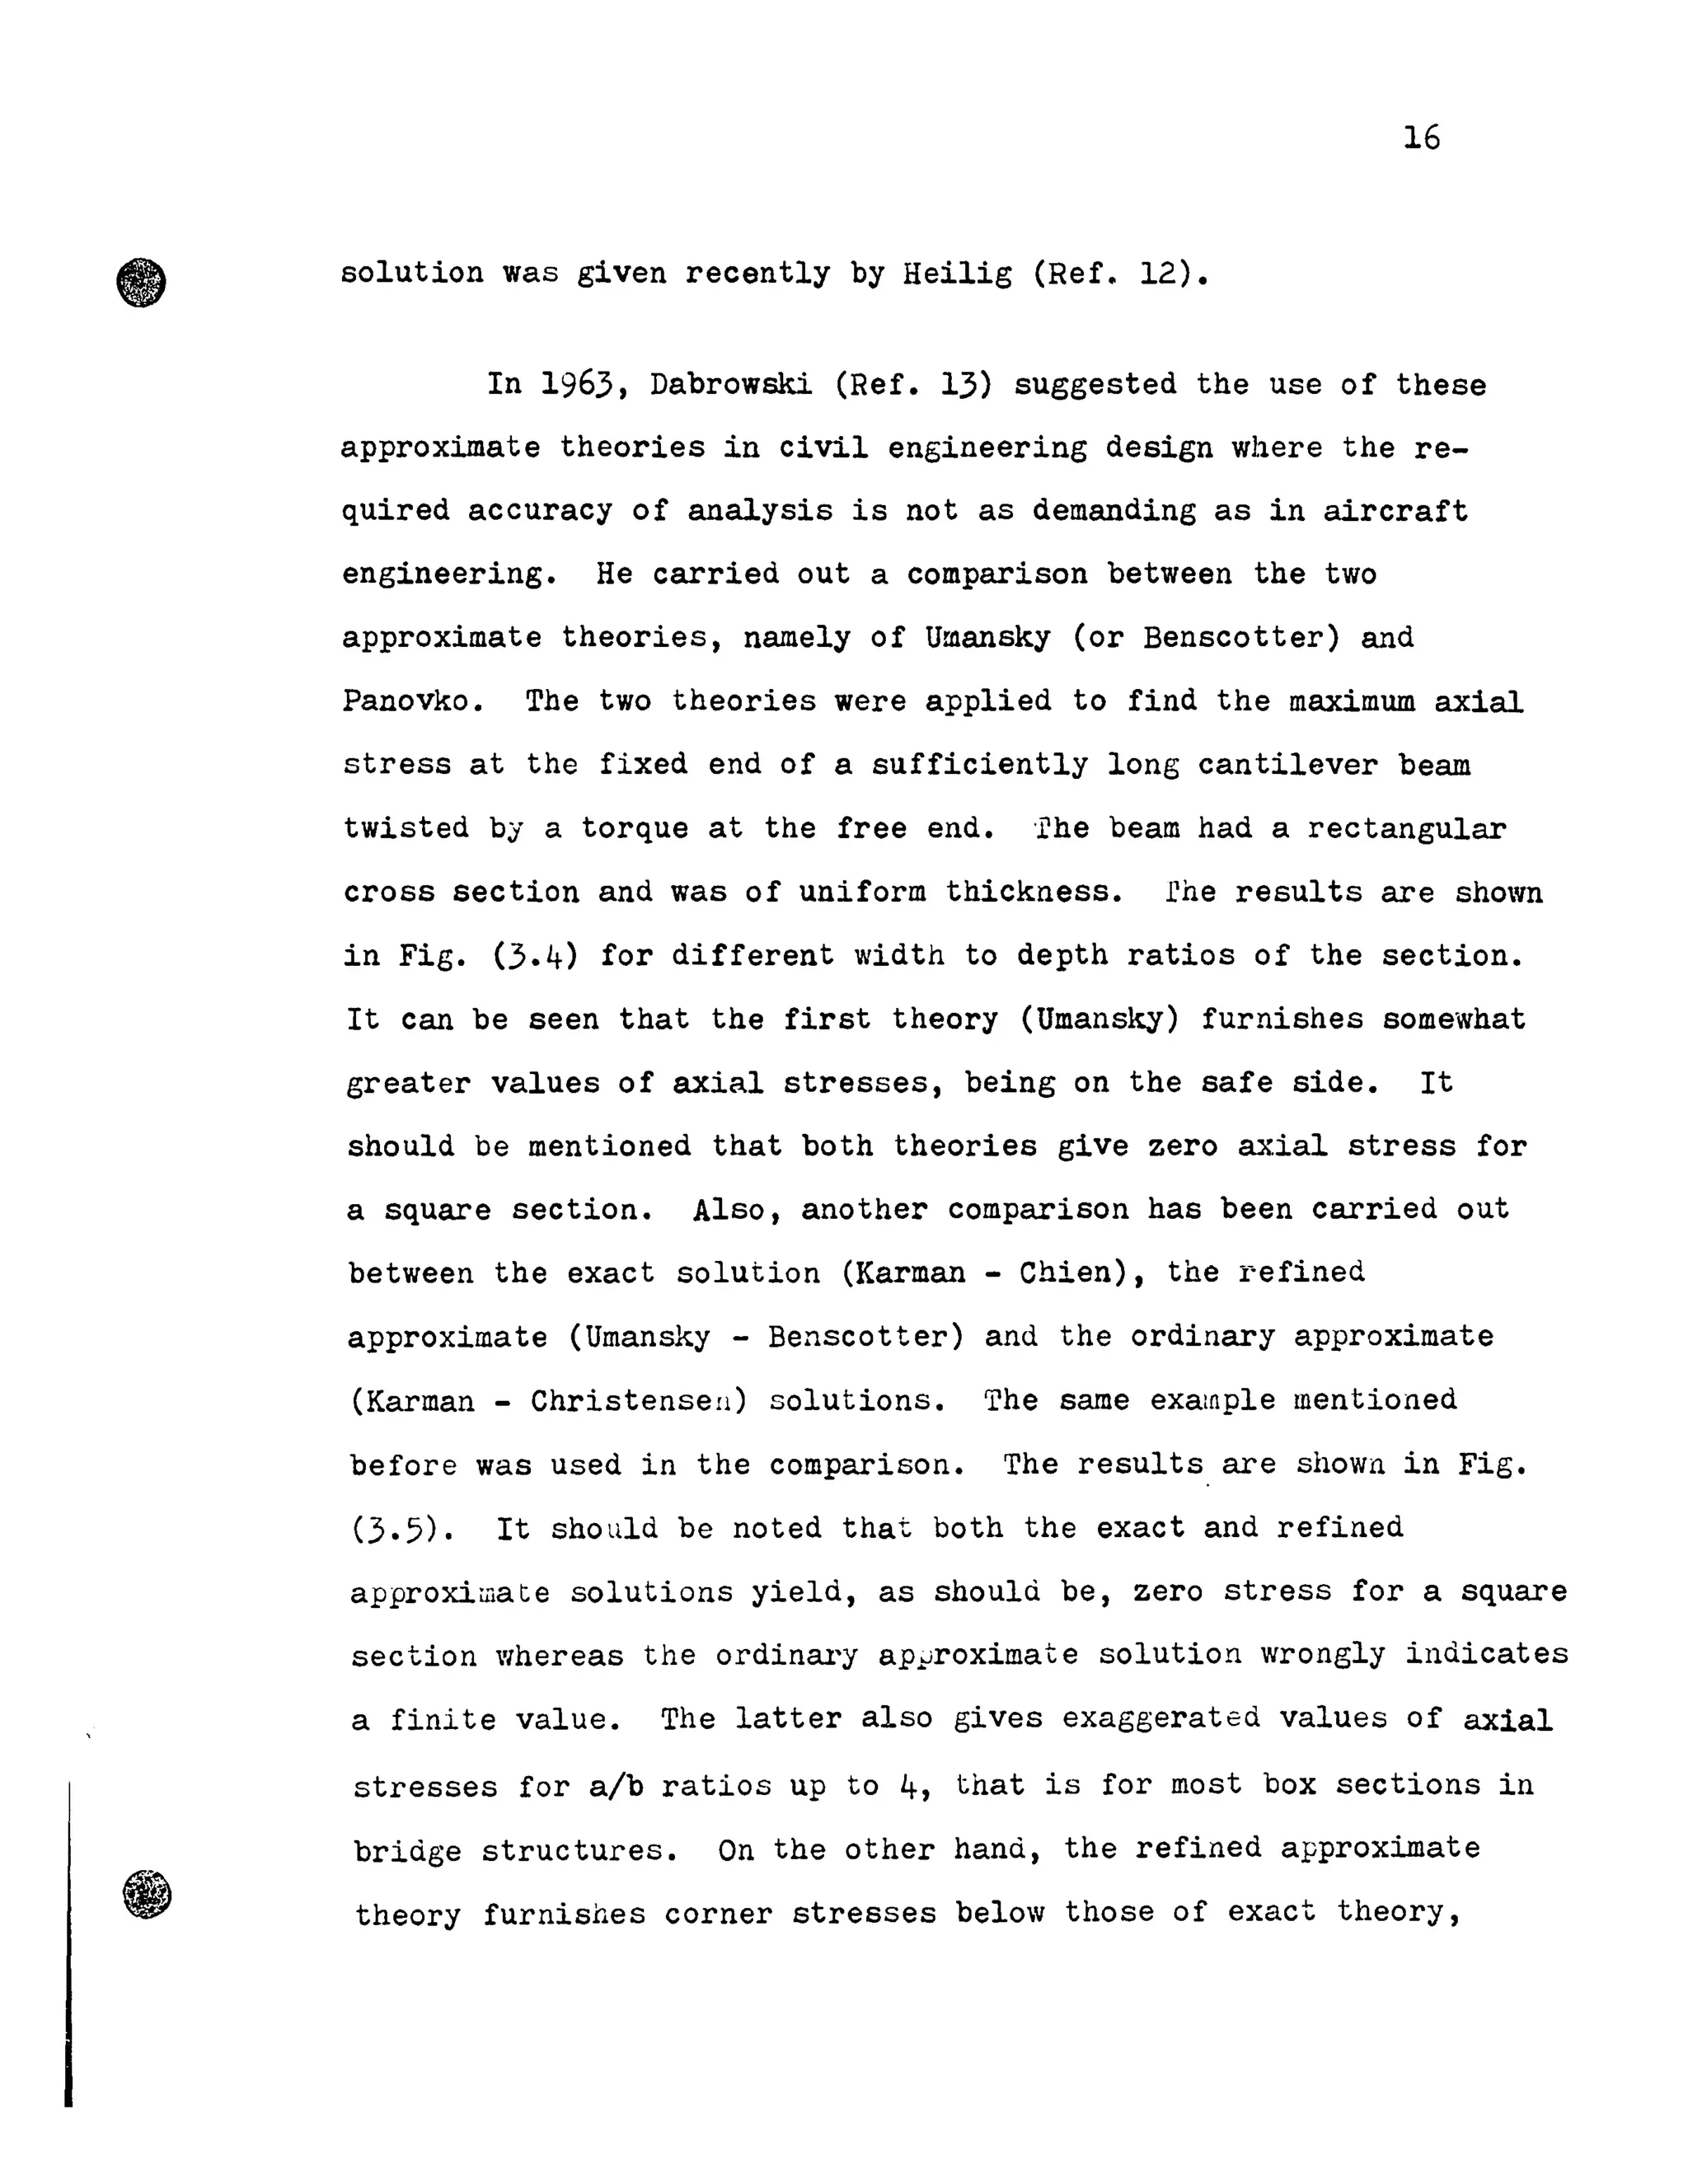
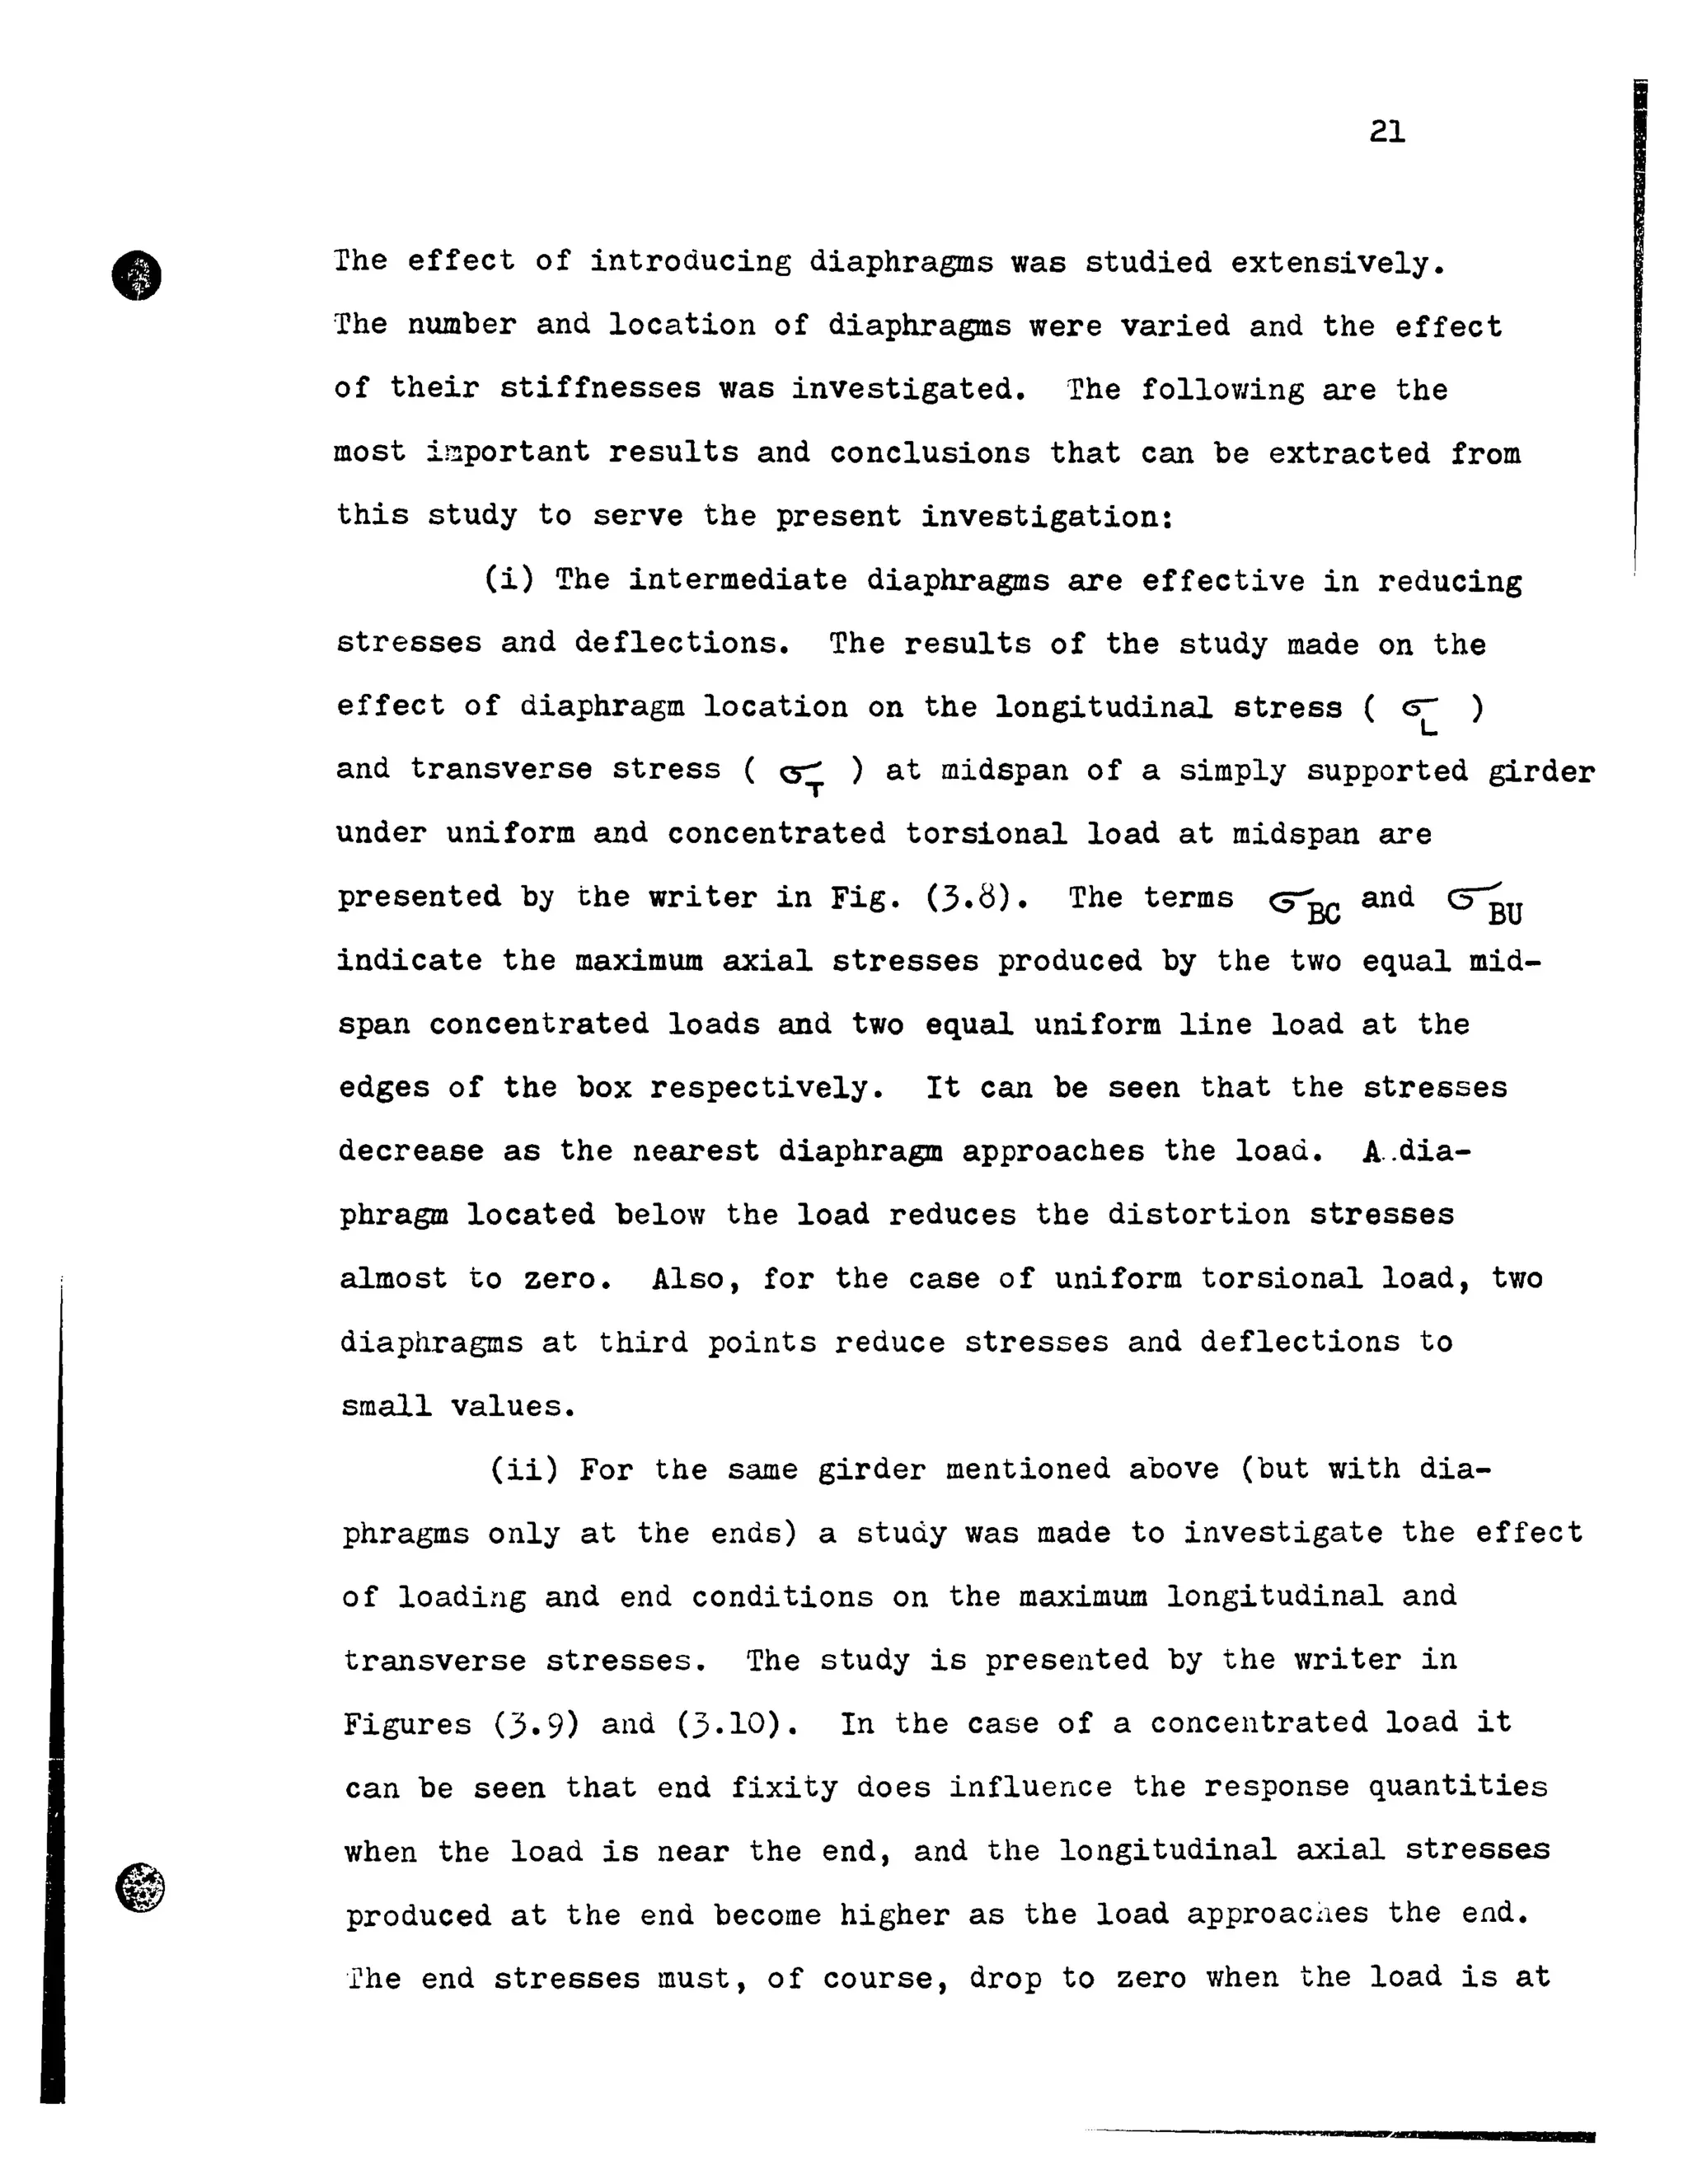
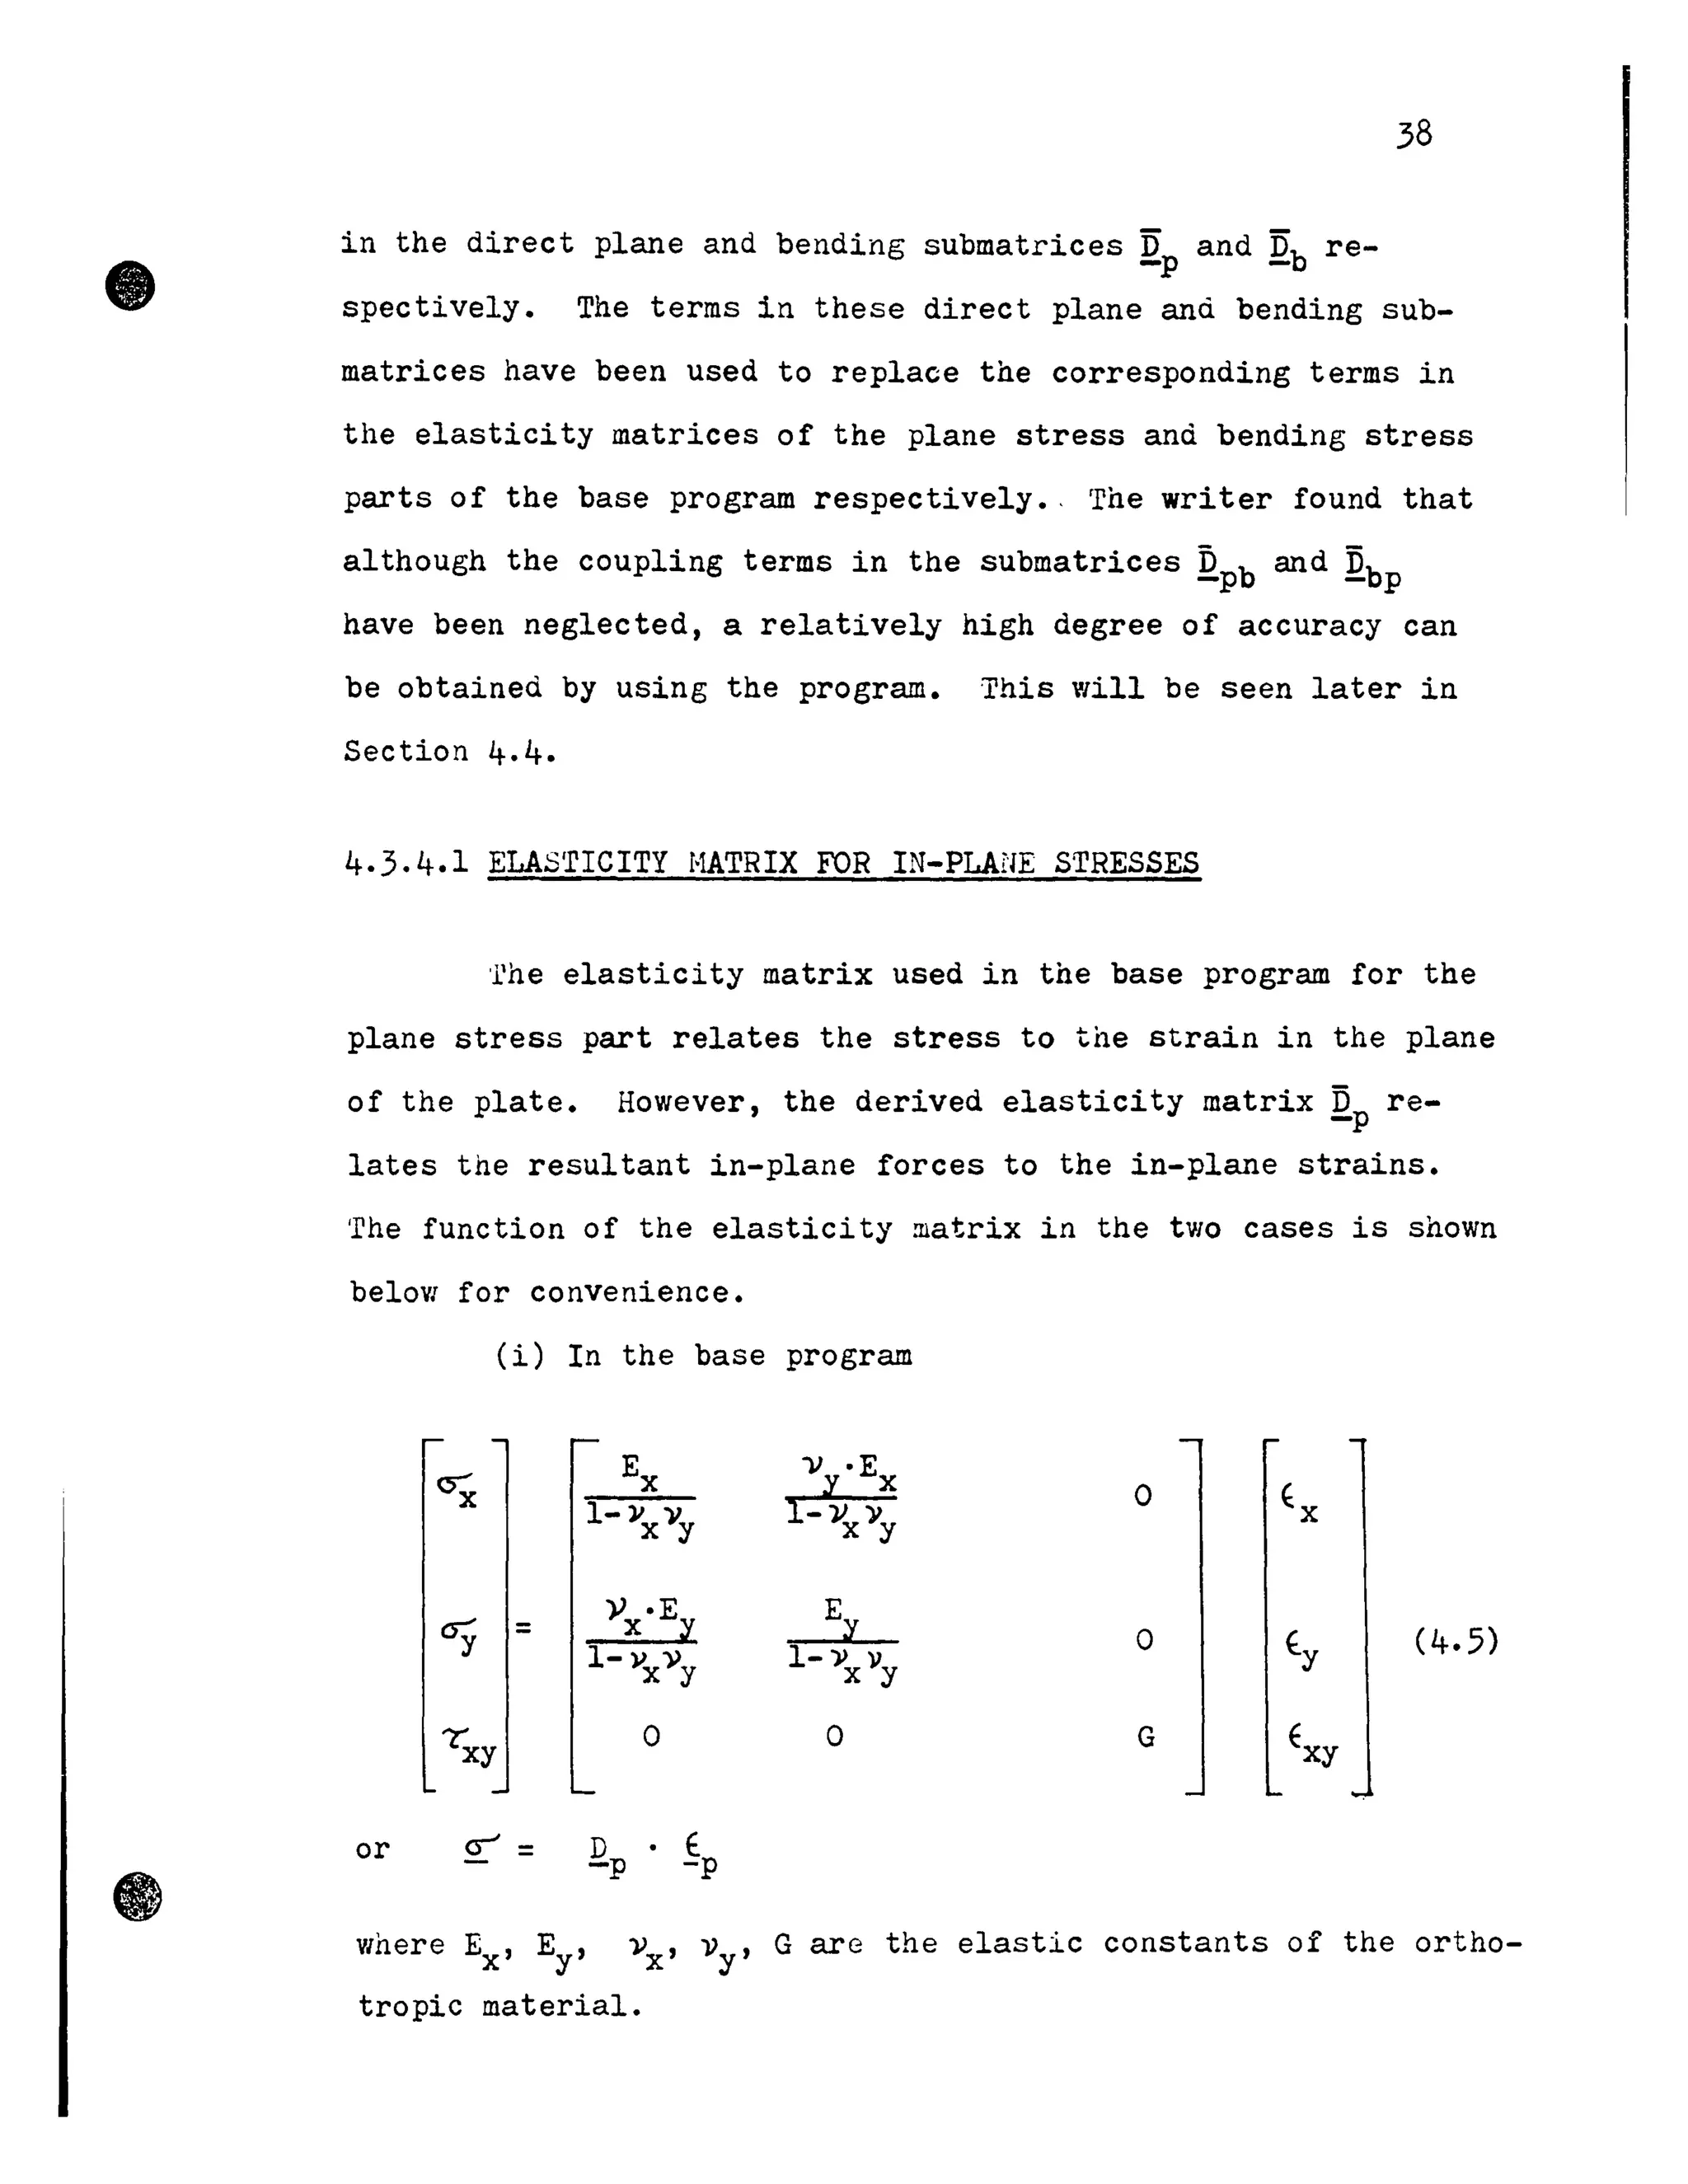
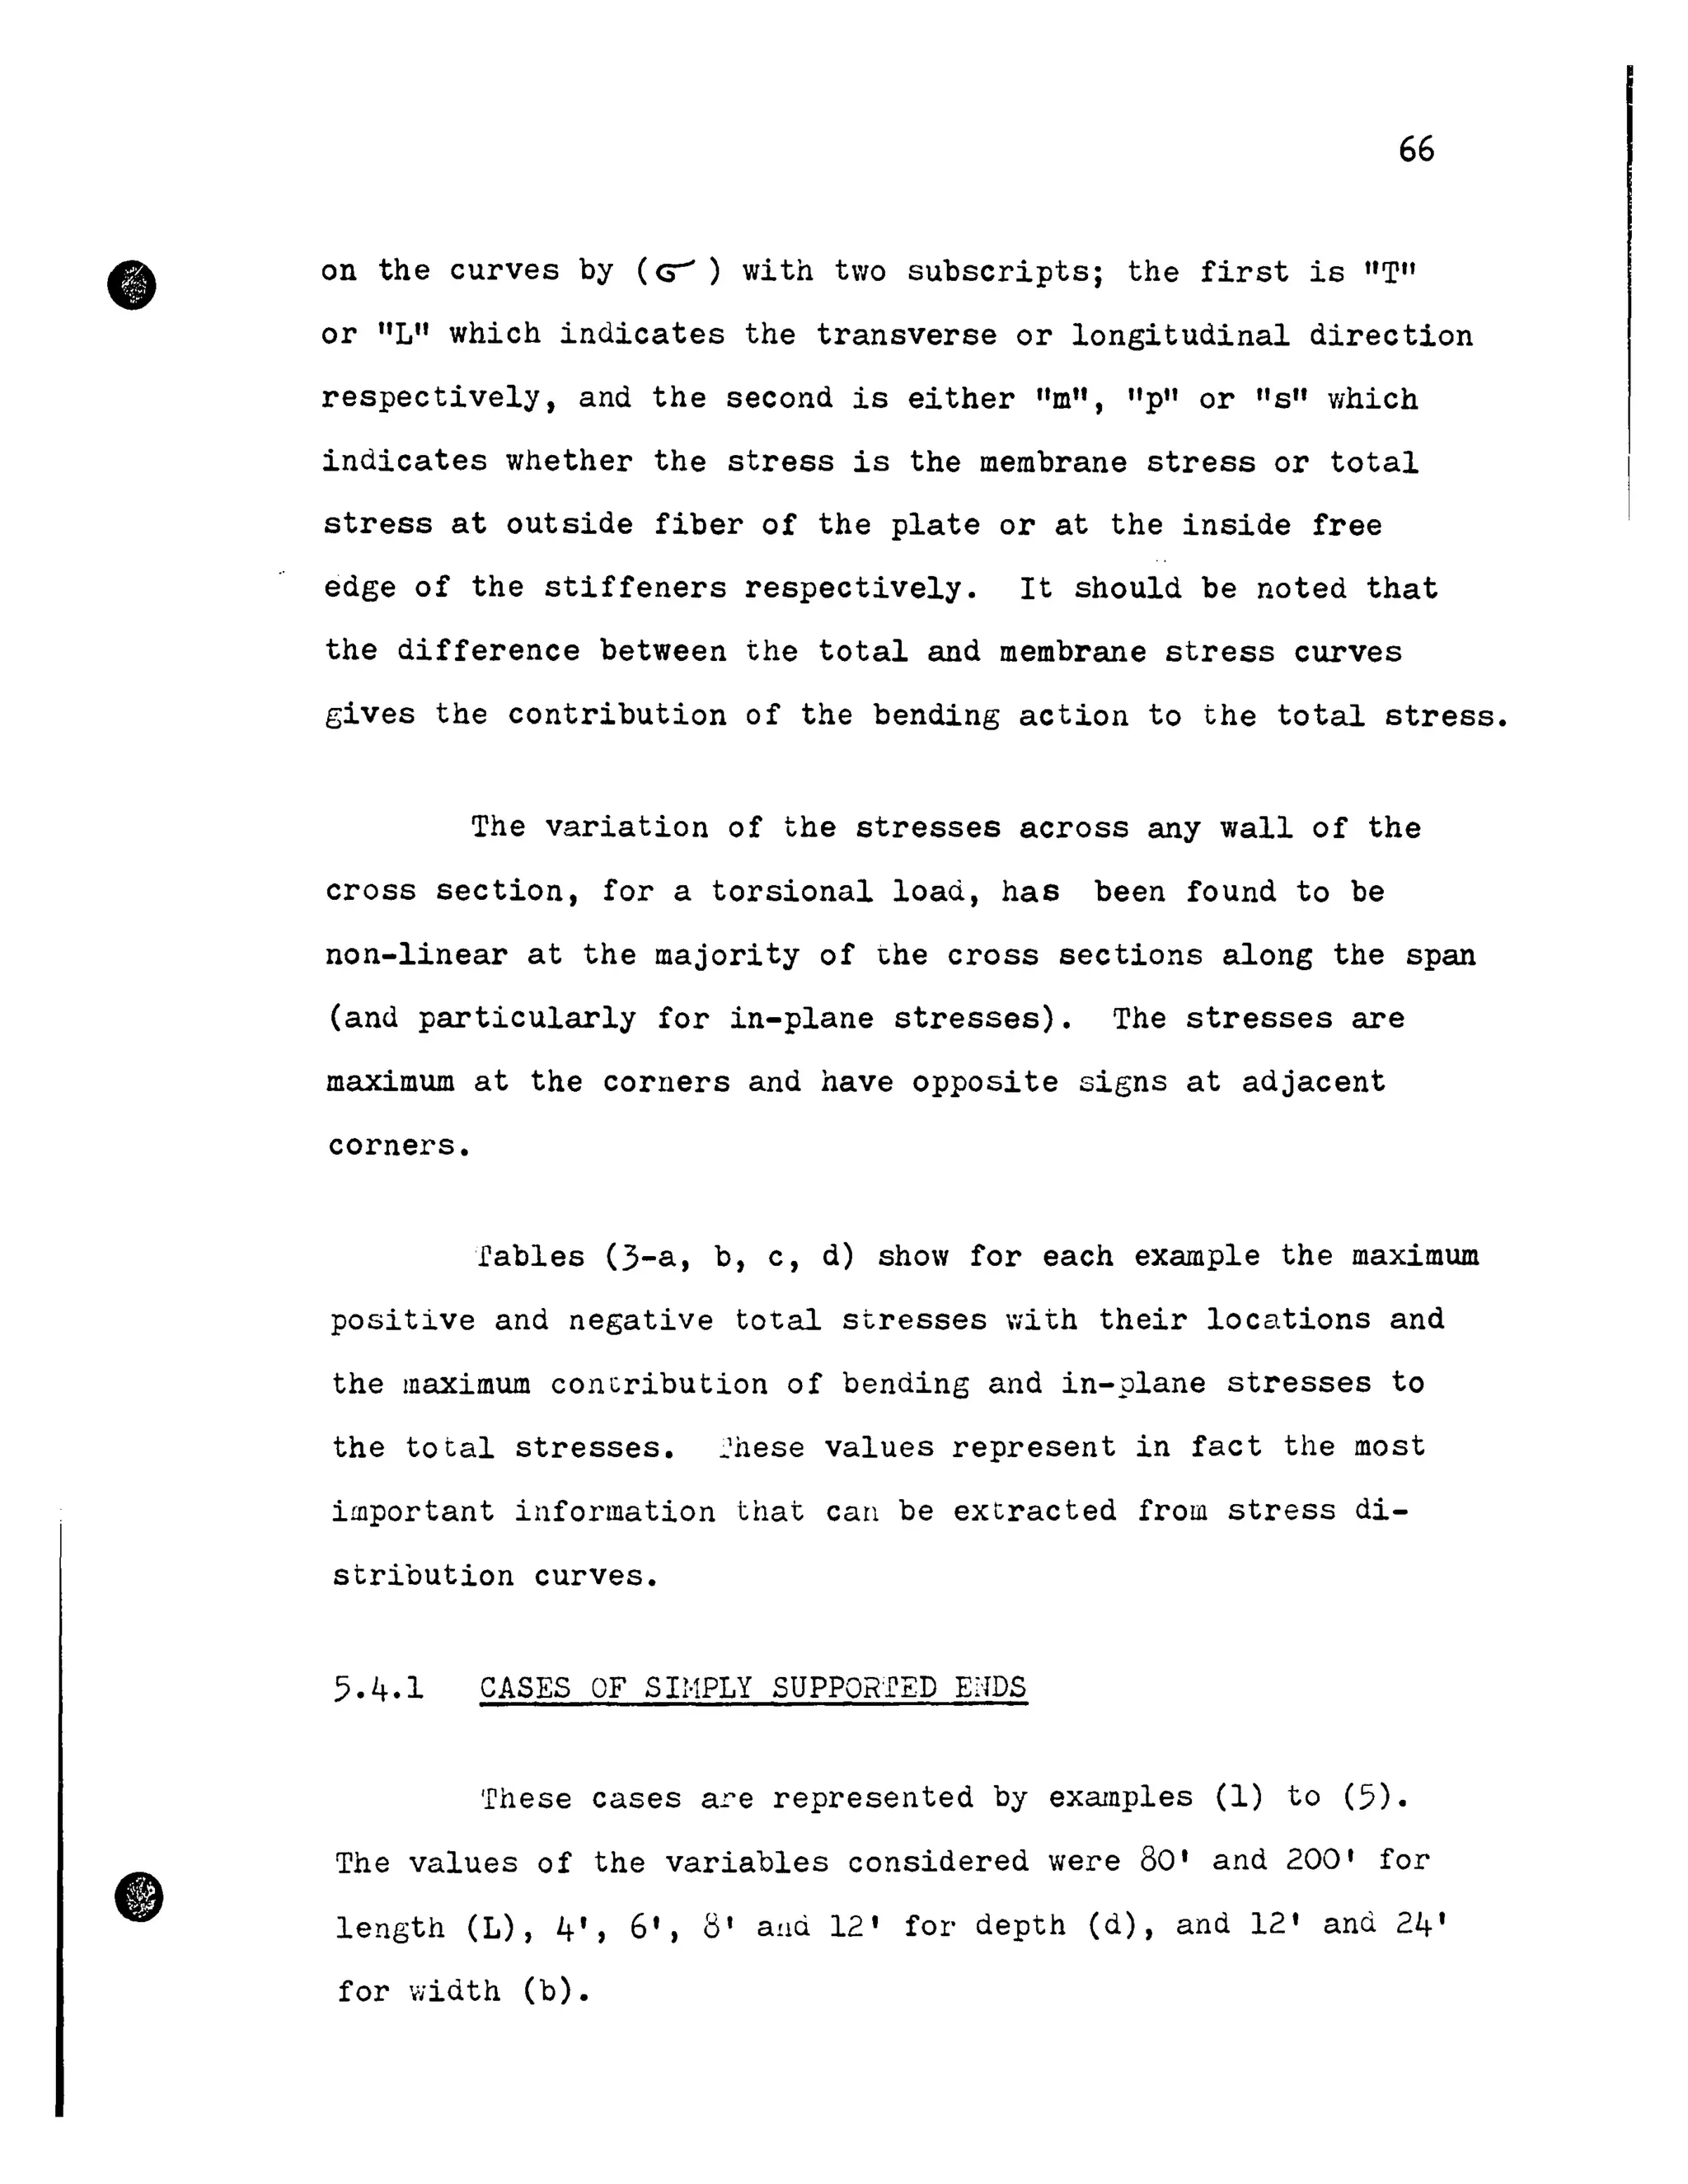
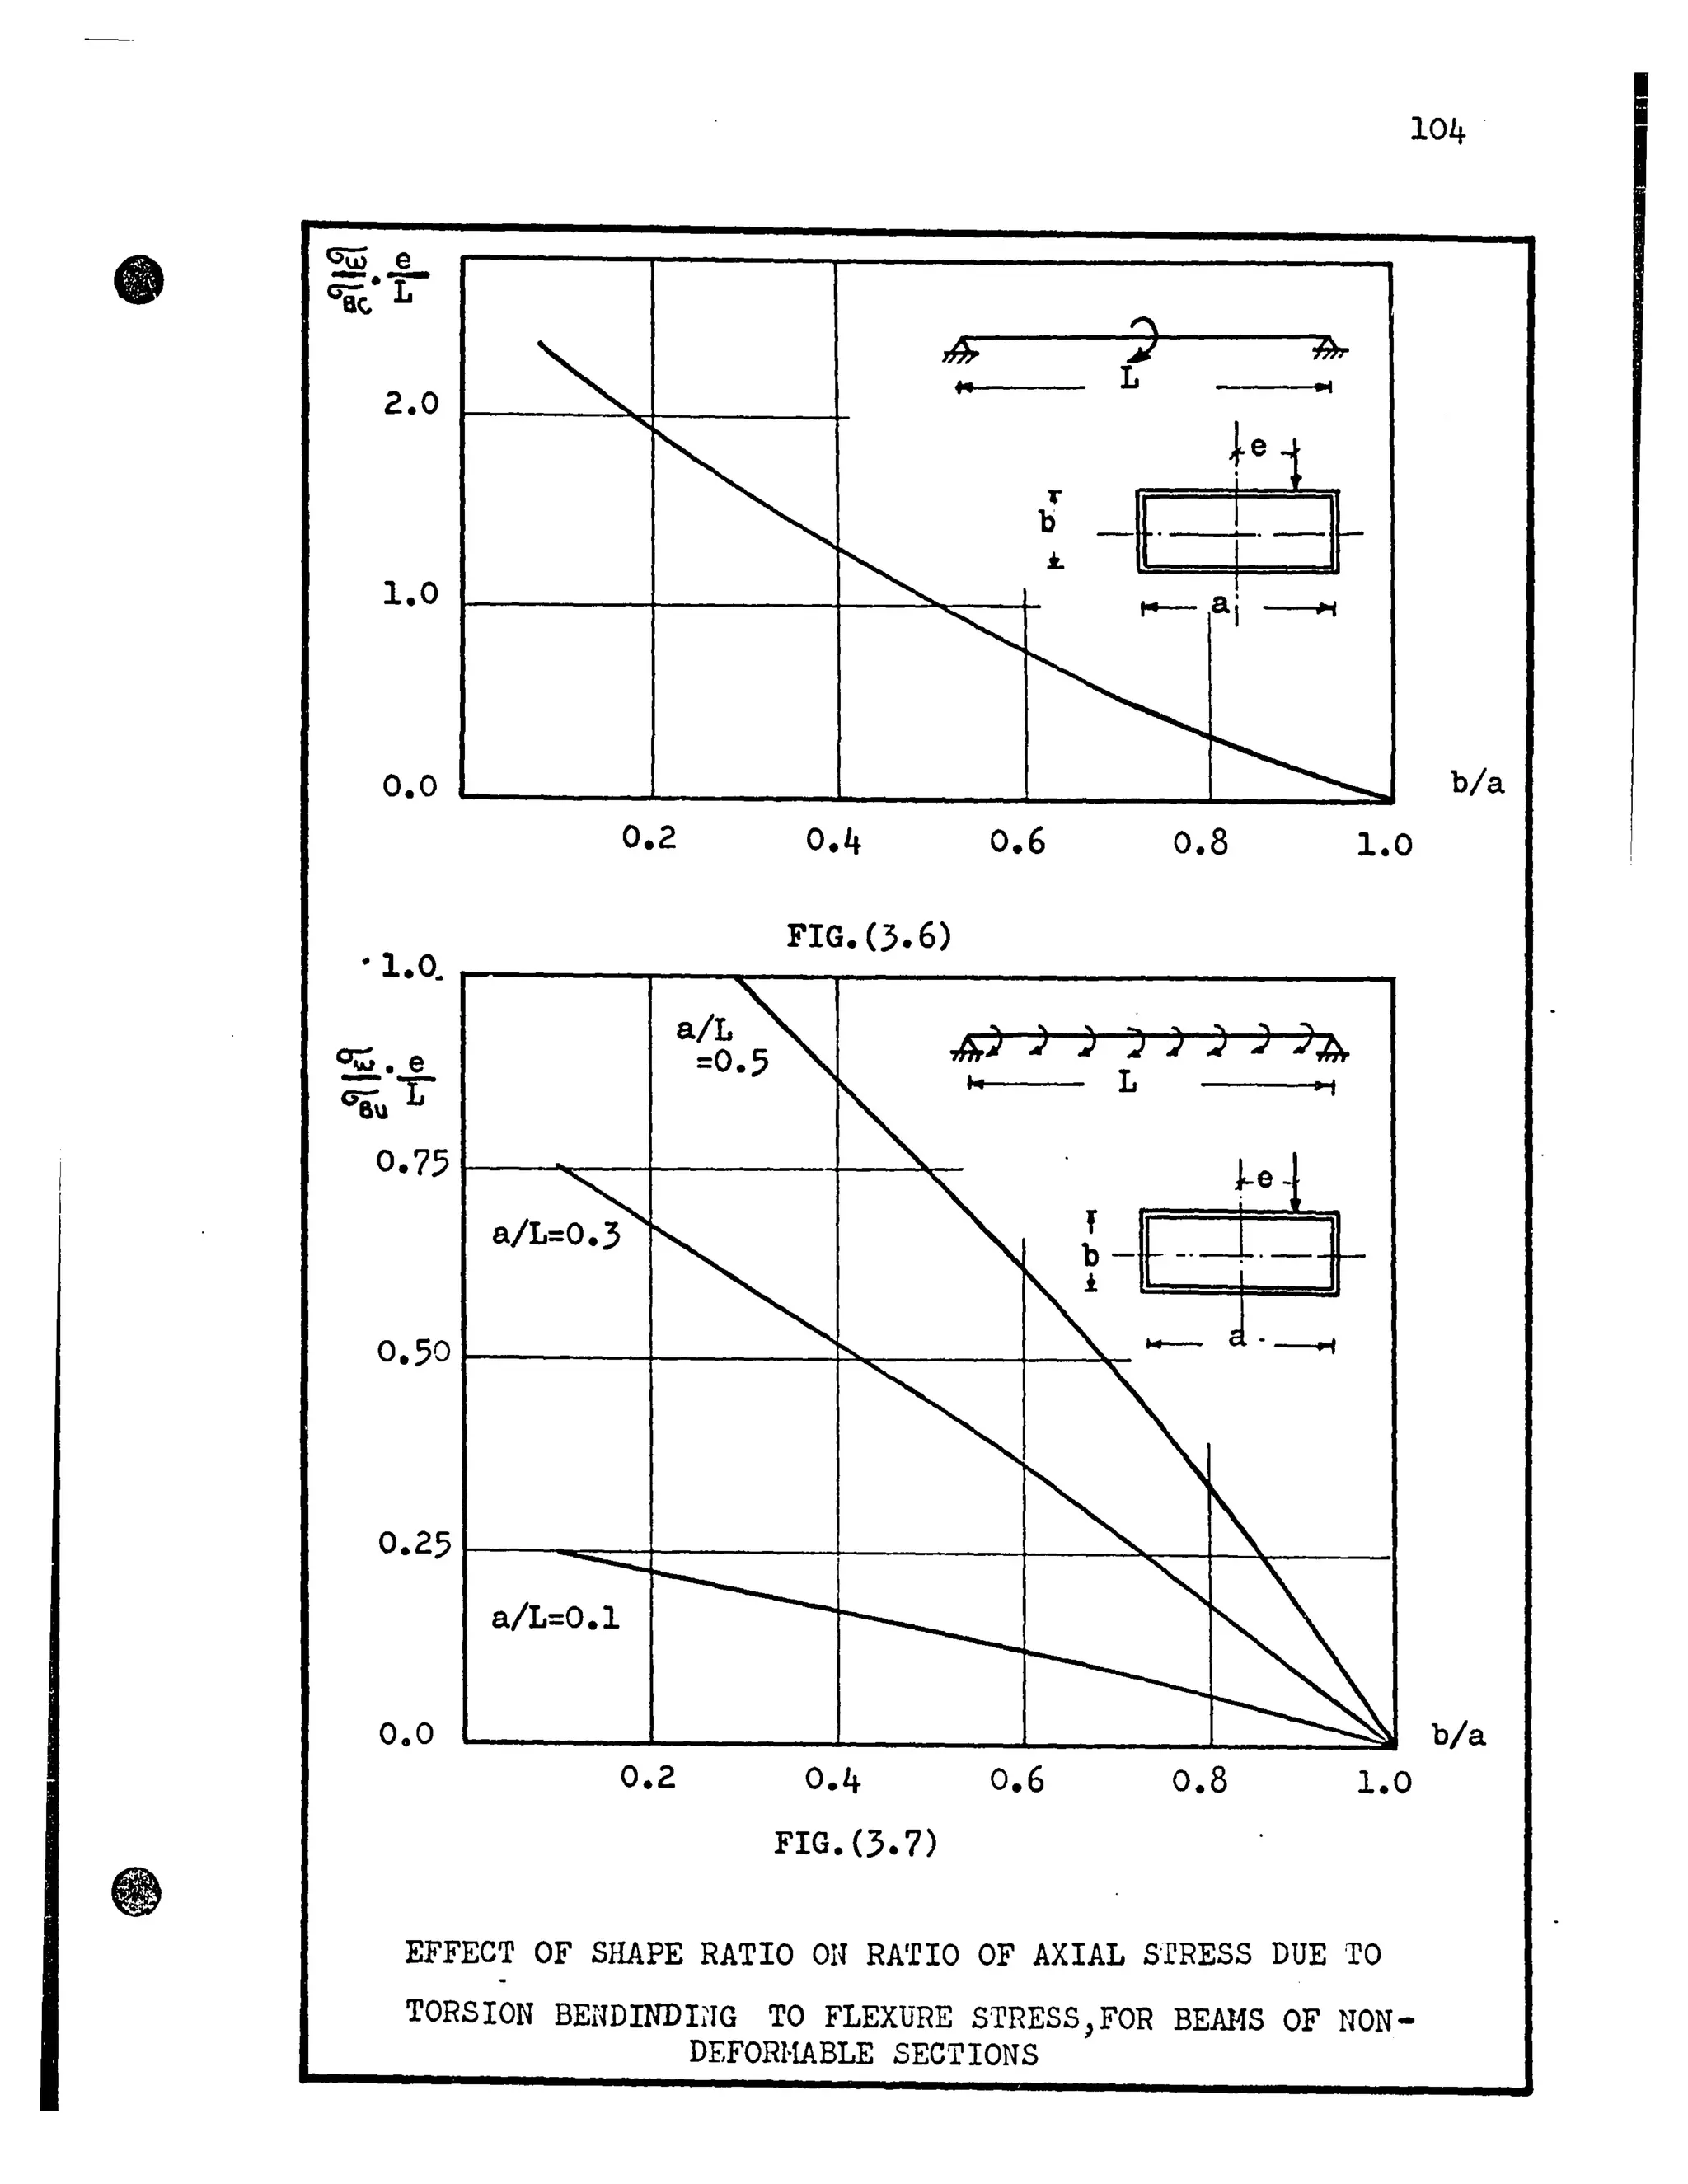
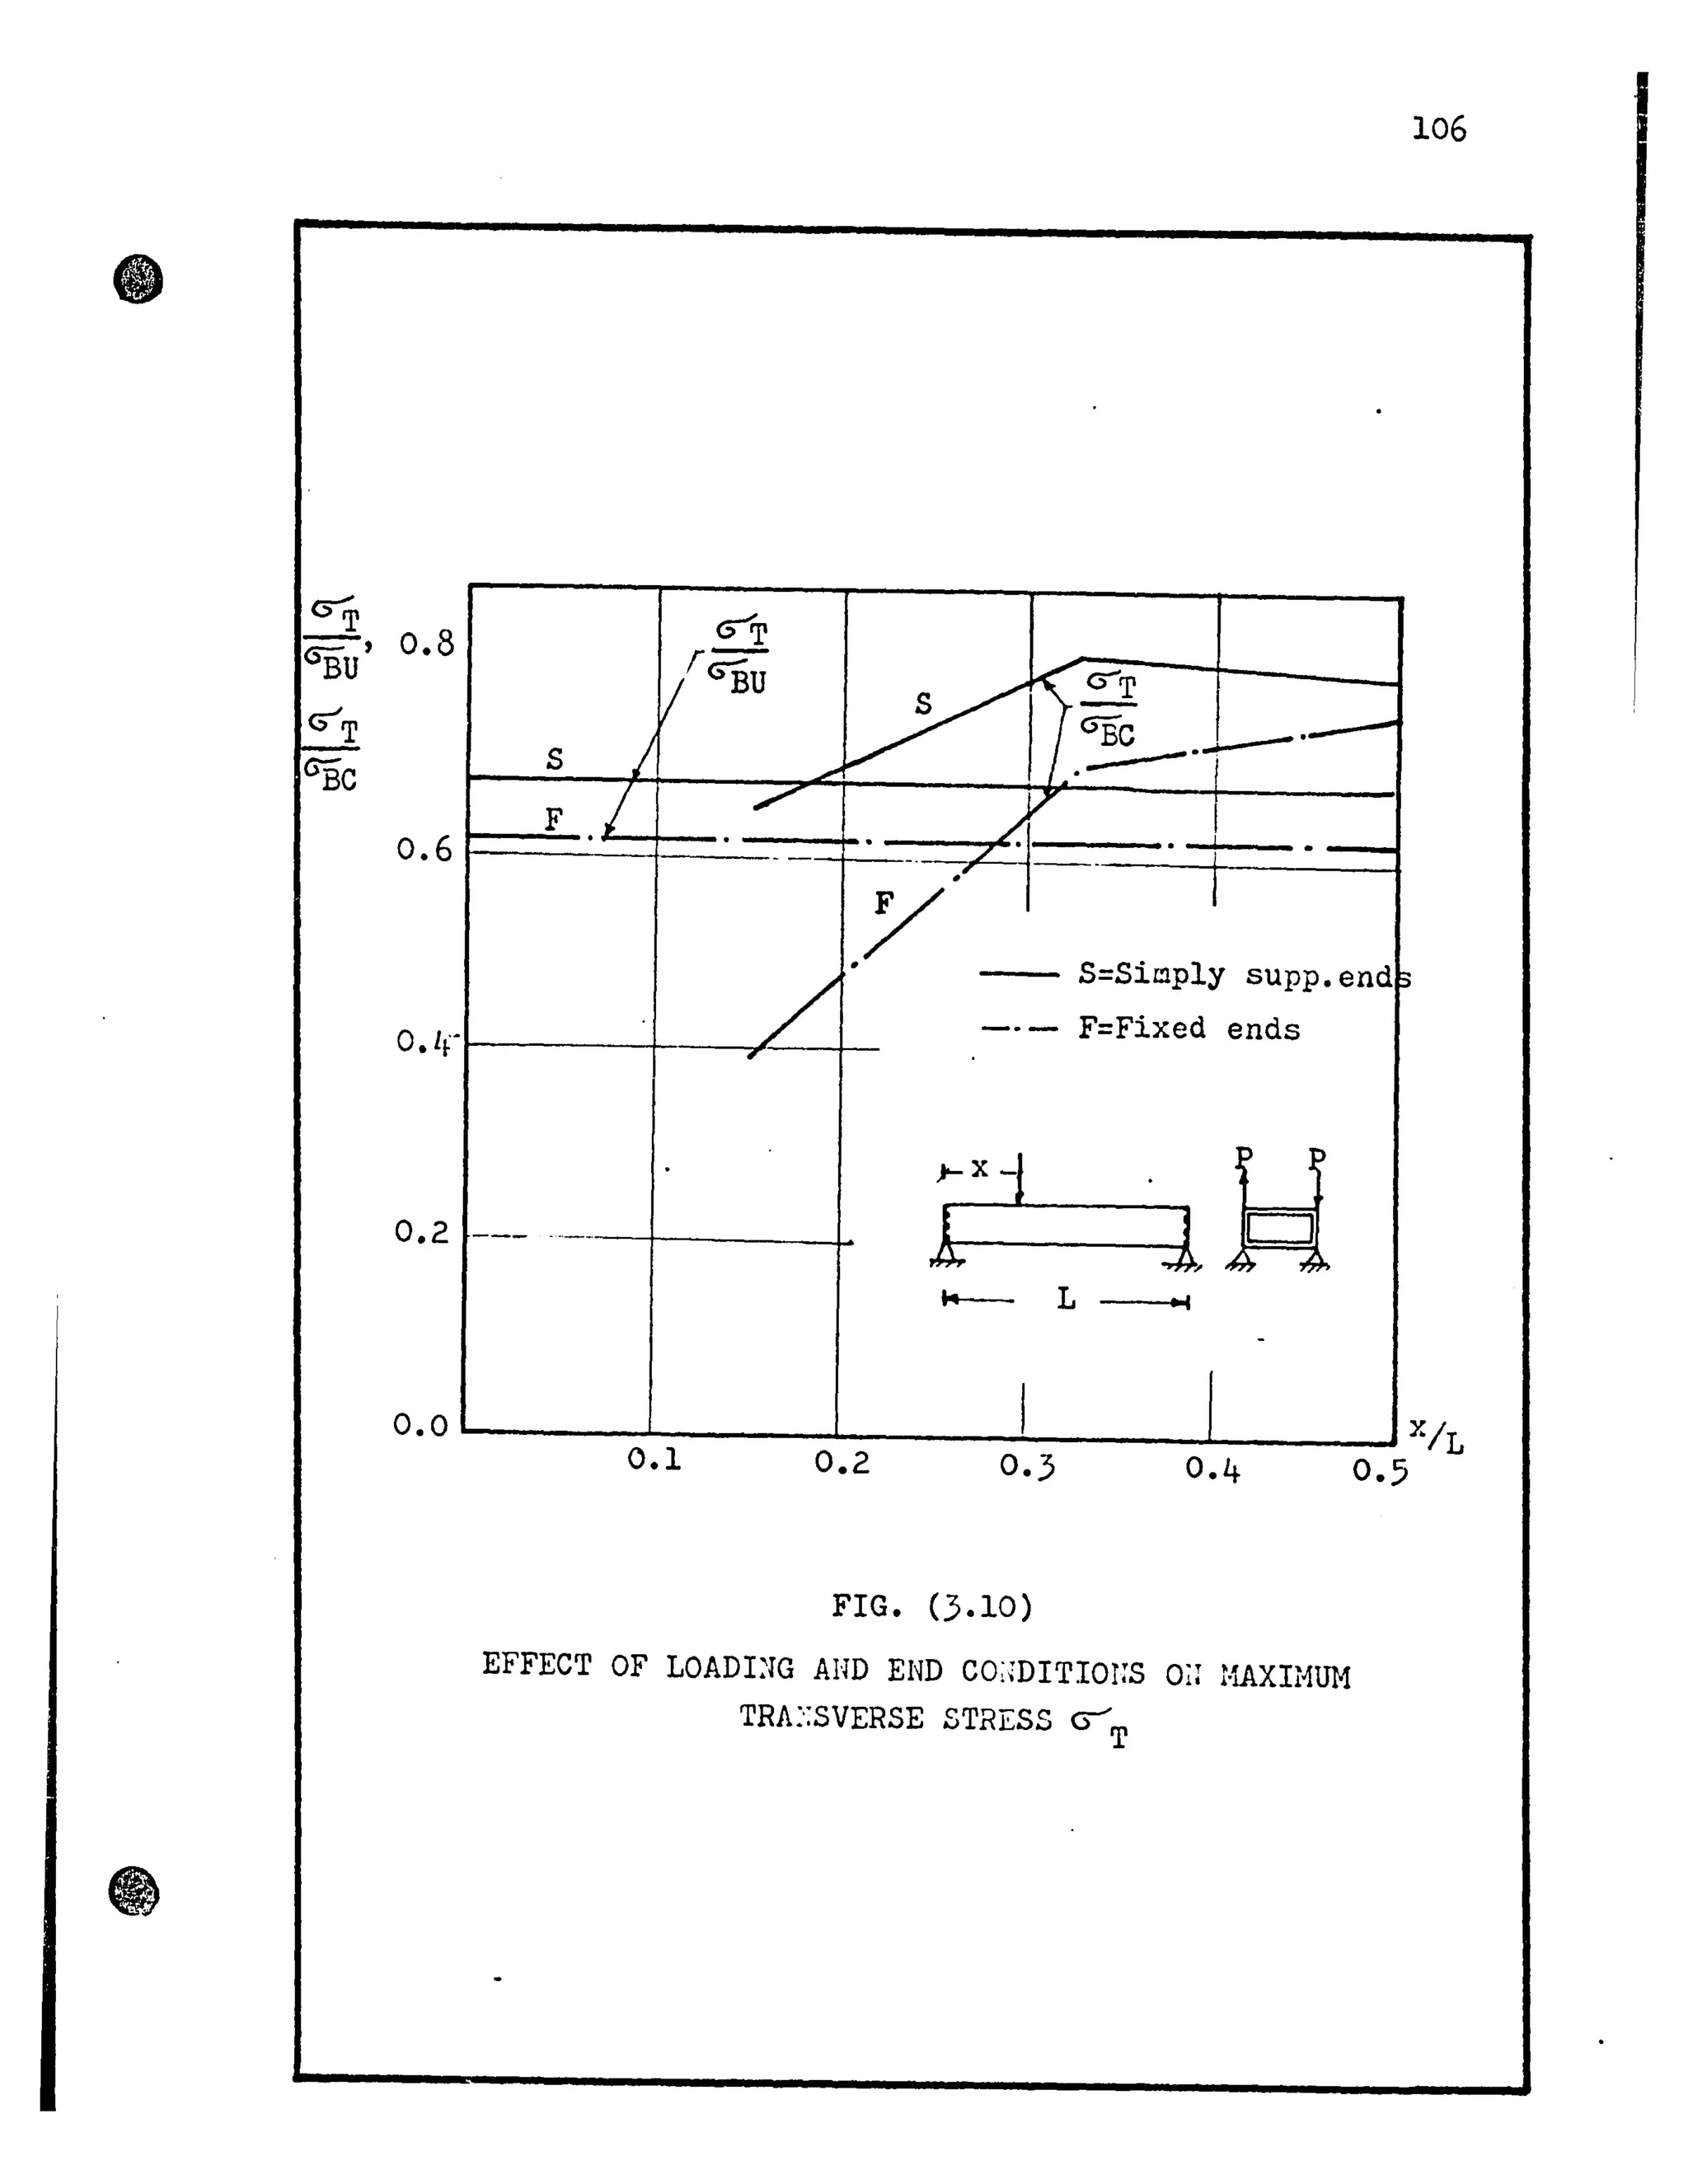
Using the formulas of the refined approximate theory
derived by Dabrowsky for the values of the maximum torsion bending
stress in an eccentrically loaded simply supported beam, the
writer inspected the effect of shape ratio on the increase of
axial stresses due to eccentricity of load on box girder bridges.
The results presented in Figures (3.6) and (].7) show the trans-
verse influence lines of the maximum axial stress ( ~ ) at mid-
span, for the cases of concentrated and uniformly distributed load.
The stresses are made dimensionless by dividing by the bending
stress (9;uor~) at midspan. The practical range of width to length
ratios, for box girder bridges, has been chosen for the case of
uniformly distributed load. It can be seen that the stress in-
crease is greater in the case of concentrated load and for the
worst practical conditions this increase May reach approximately
50%. However, the corresponding increase for uniformly distributed
loads is about 20%.
3.3 WORK DO~ΠFOR DEFORMABLE CROSS SEC.i.'ION
A considerable body of the early literature was devoted
to problems in aircraft field. 'l'he MOSt important of this is the
work of Reissner (Ref. 14) and Ebner (Ref. 15). The idealization
mentioned in Section 3.2 for aircraft structures was also the
basis of this Vlork. Ebner showed hoVl doubly symmetrical boxes
could be solved by the hlethod of influence coefficients ( ~ik).
His method is based on the principle of virtual forces and is
applicable to problems of two dimensional elasticity. Argyris](https://image.slidesharecdn.com/torsionalbehaviourofsinglecellboxgirderbridges-140613171733-phpapp01/75/Torsional-behaviour-of-single-cell-box-girder-bridges-34-2048.jpg)
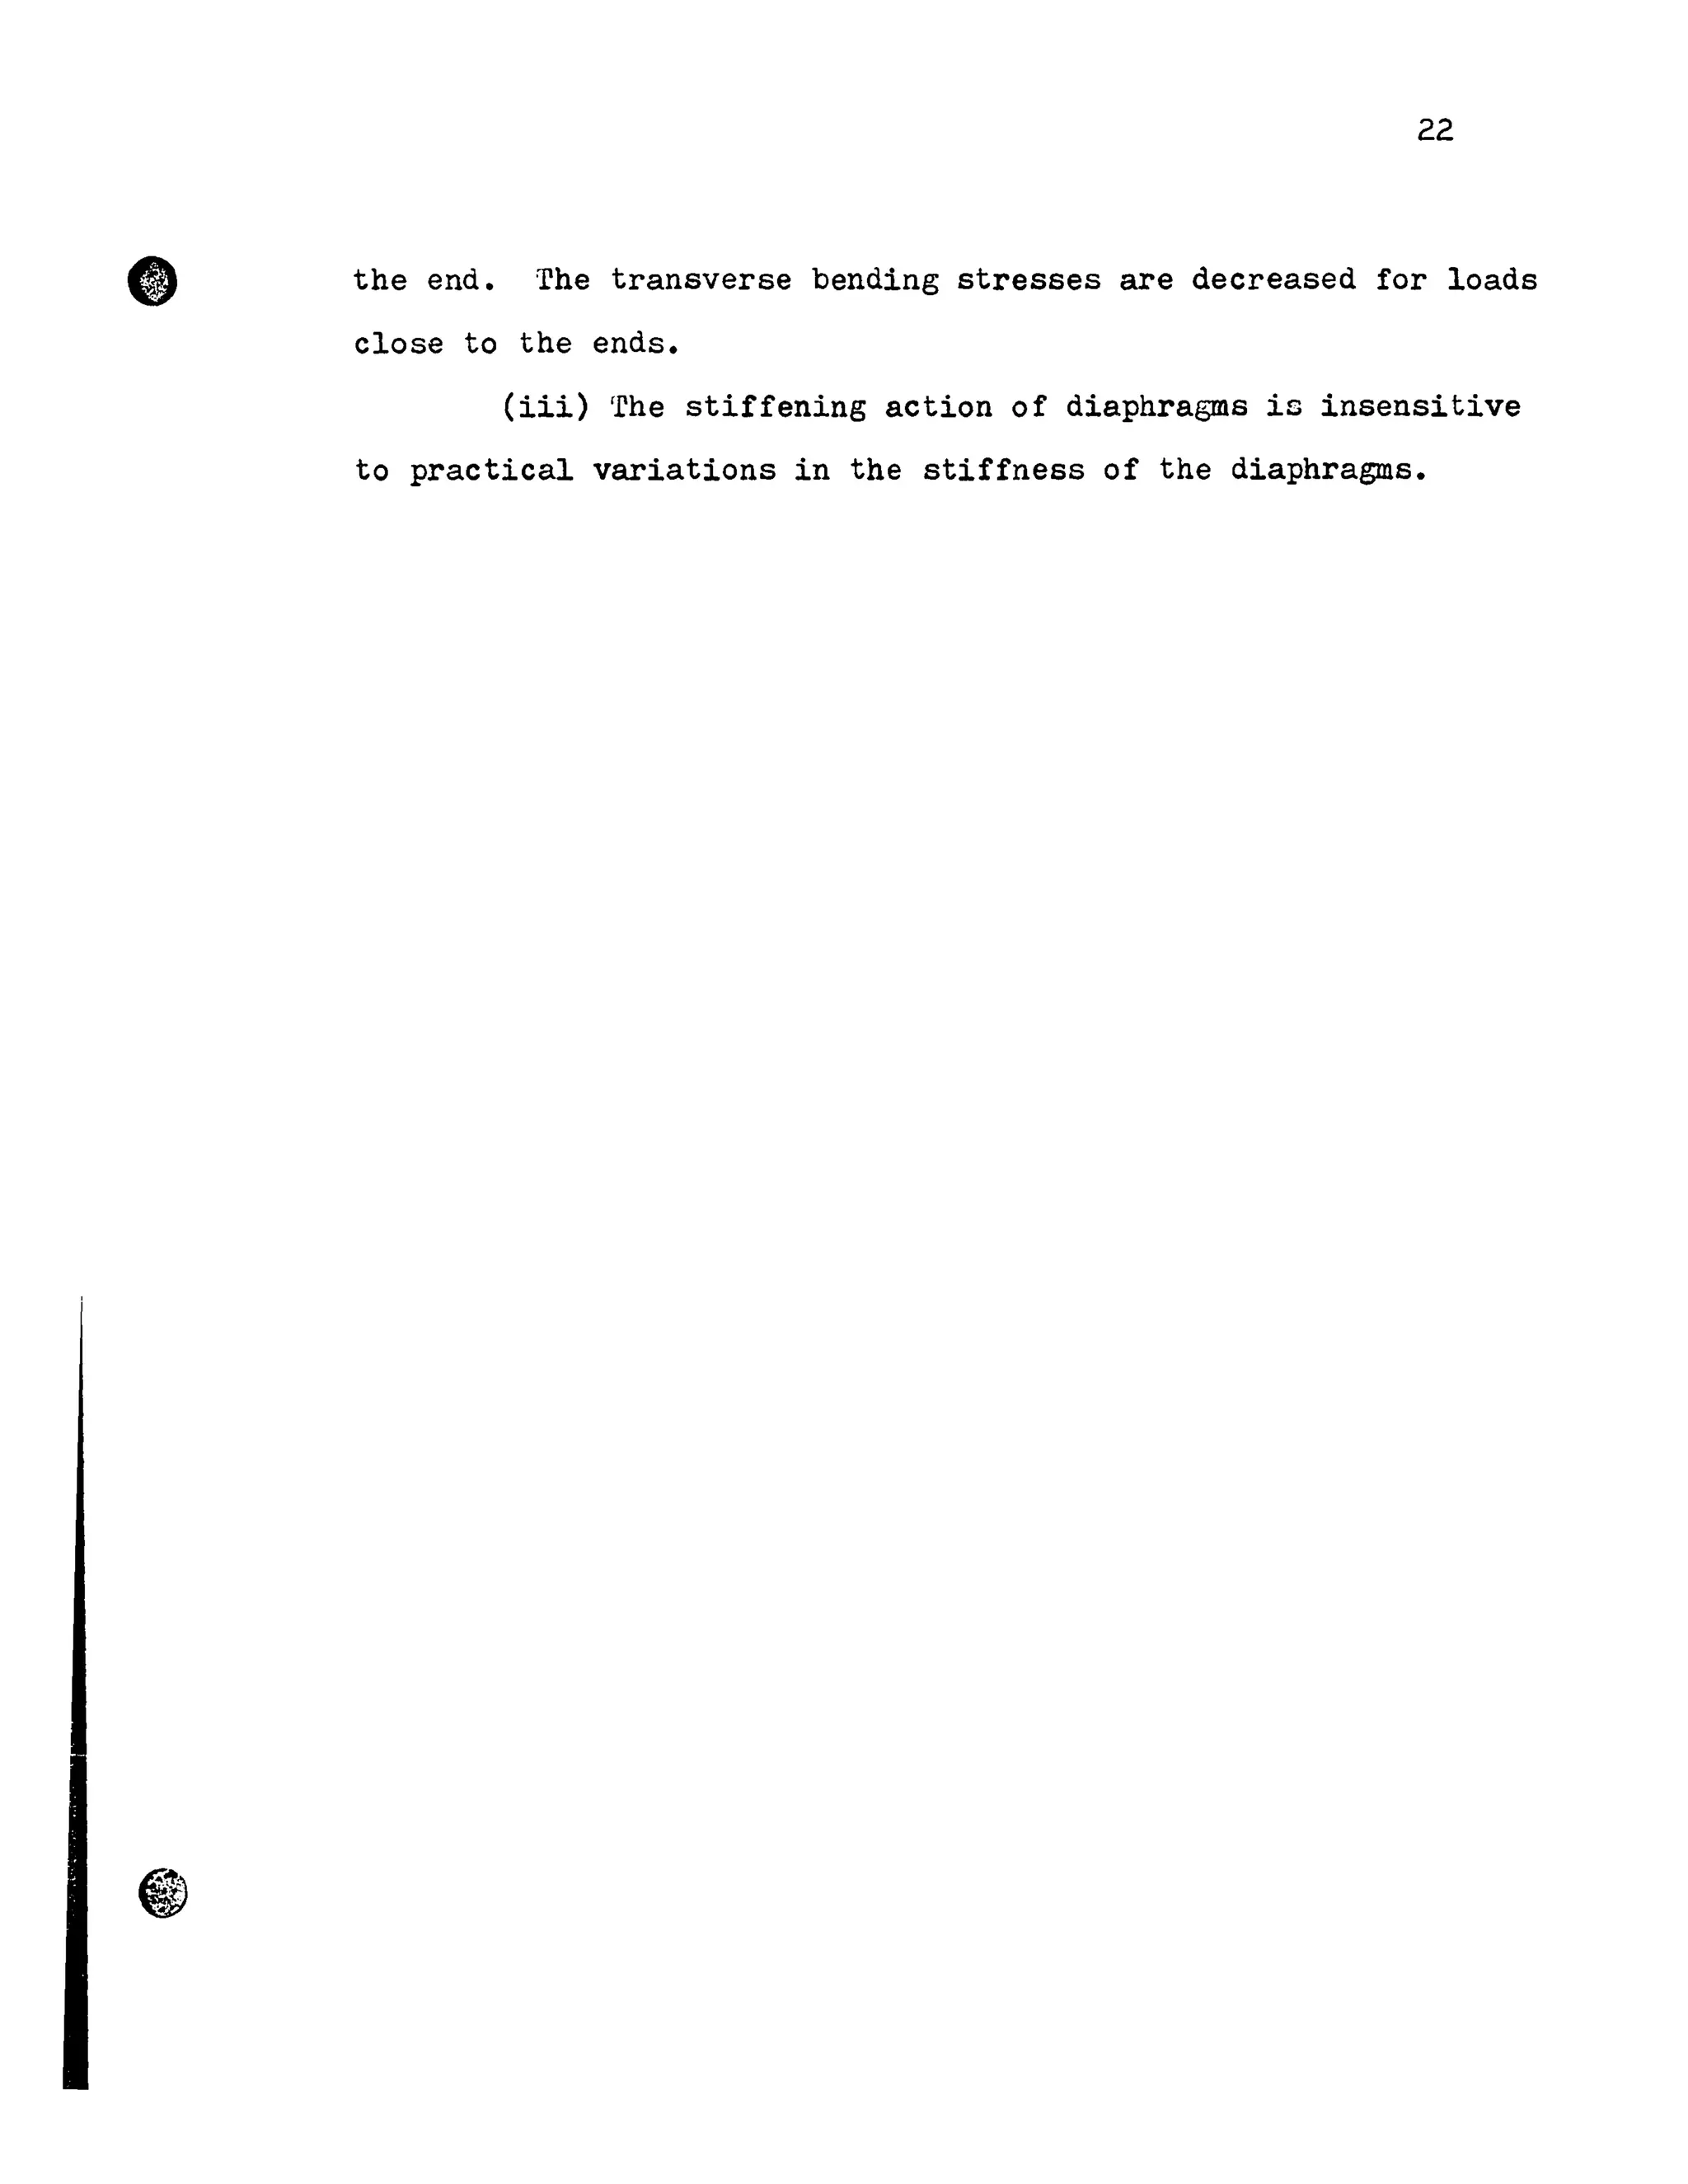
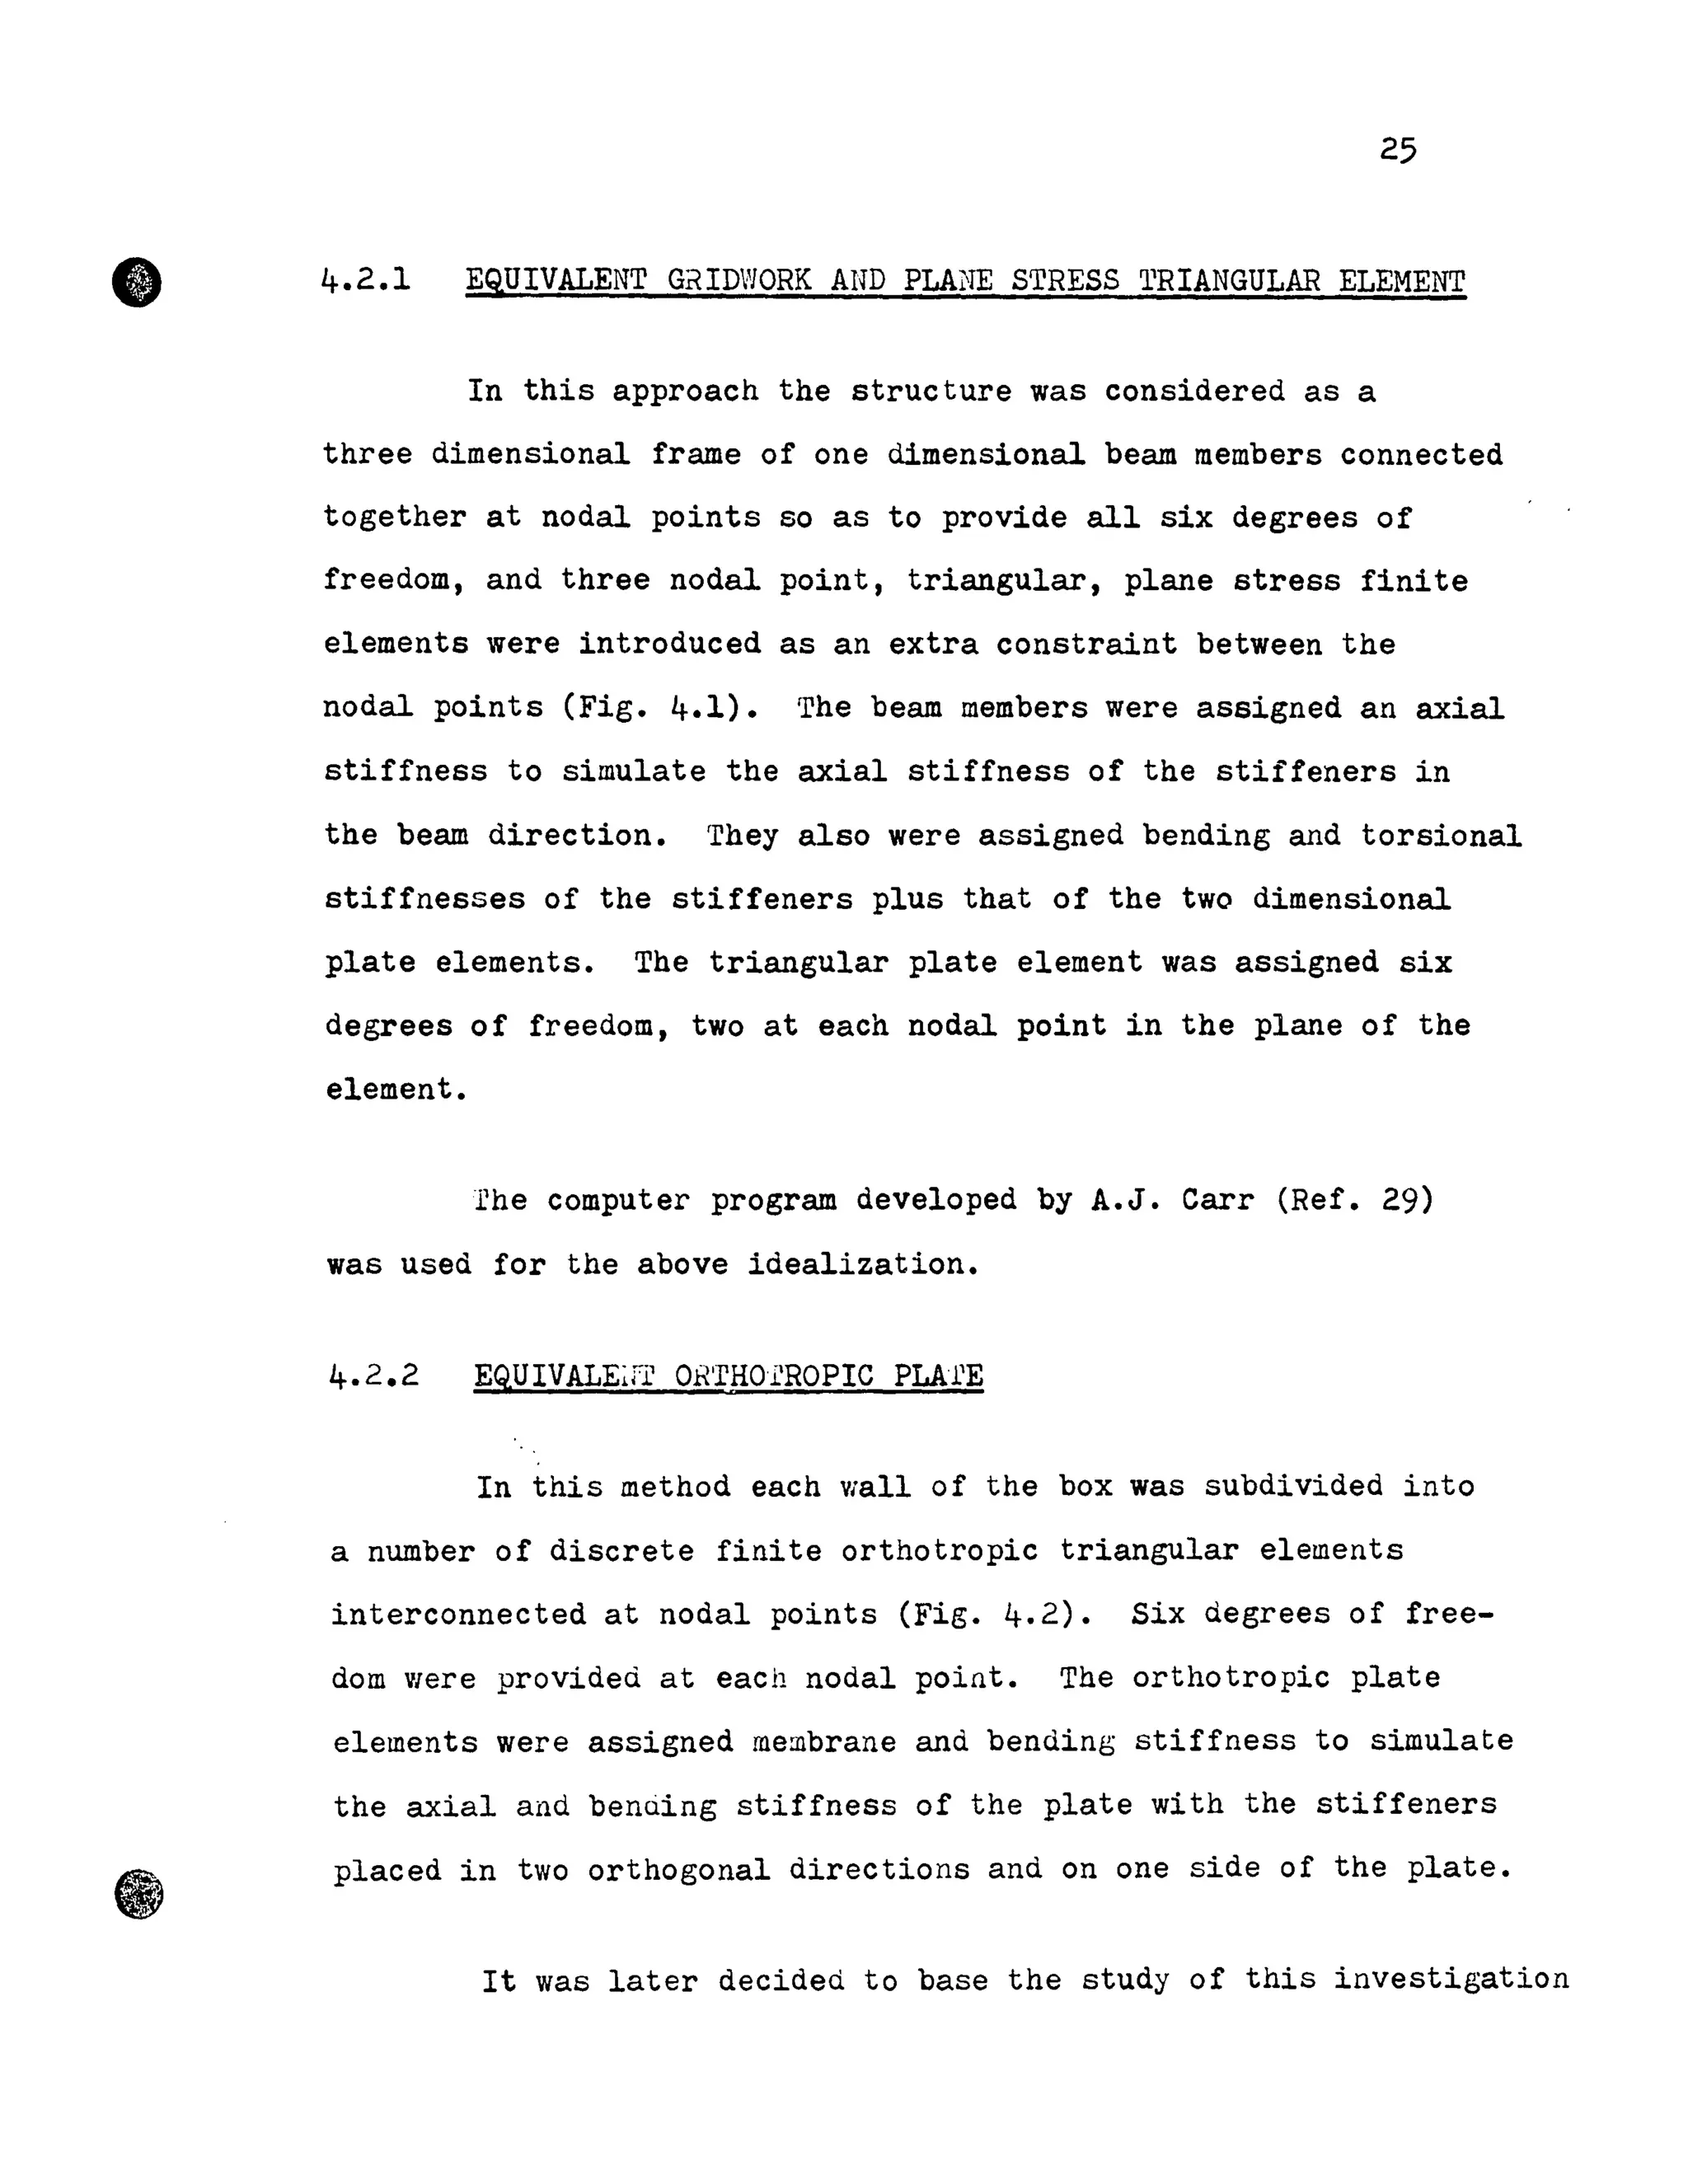

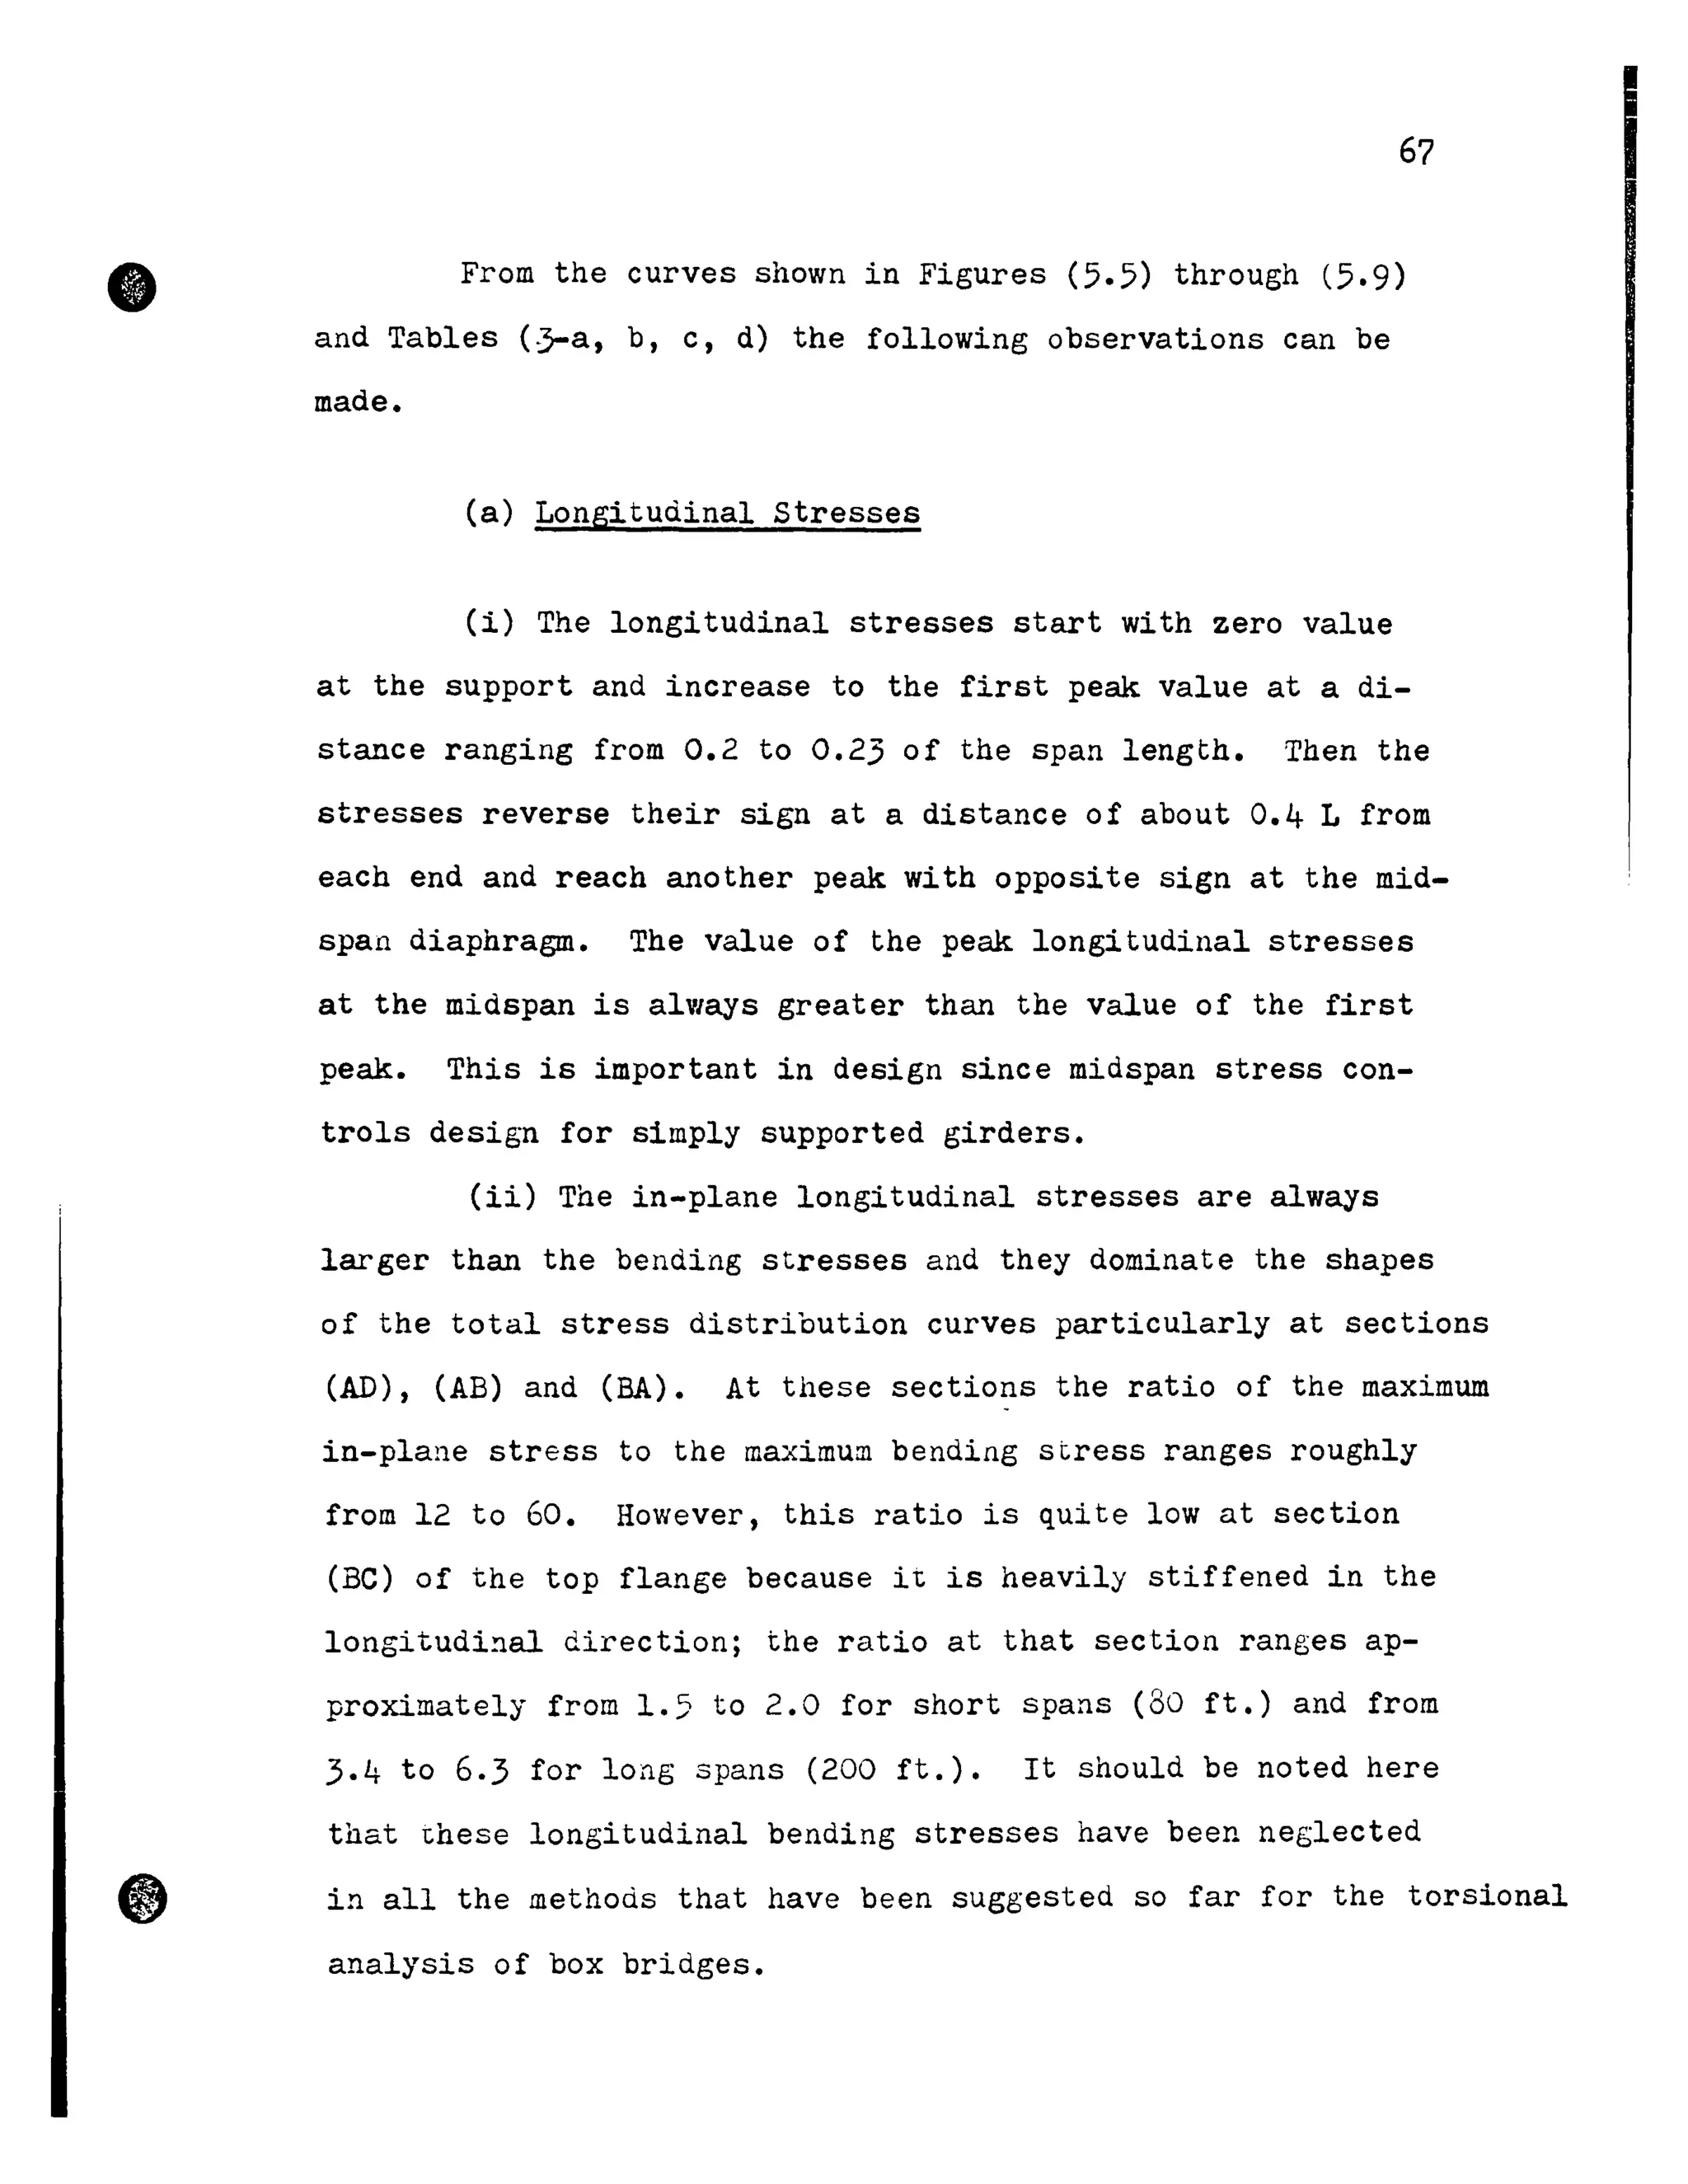
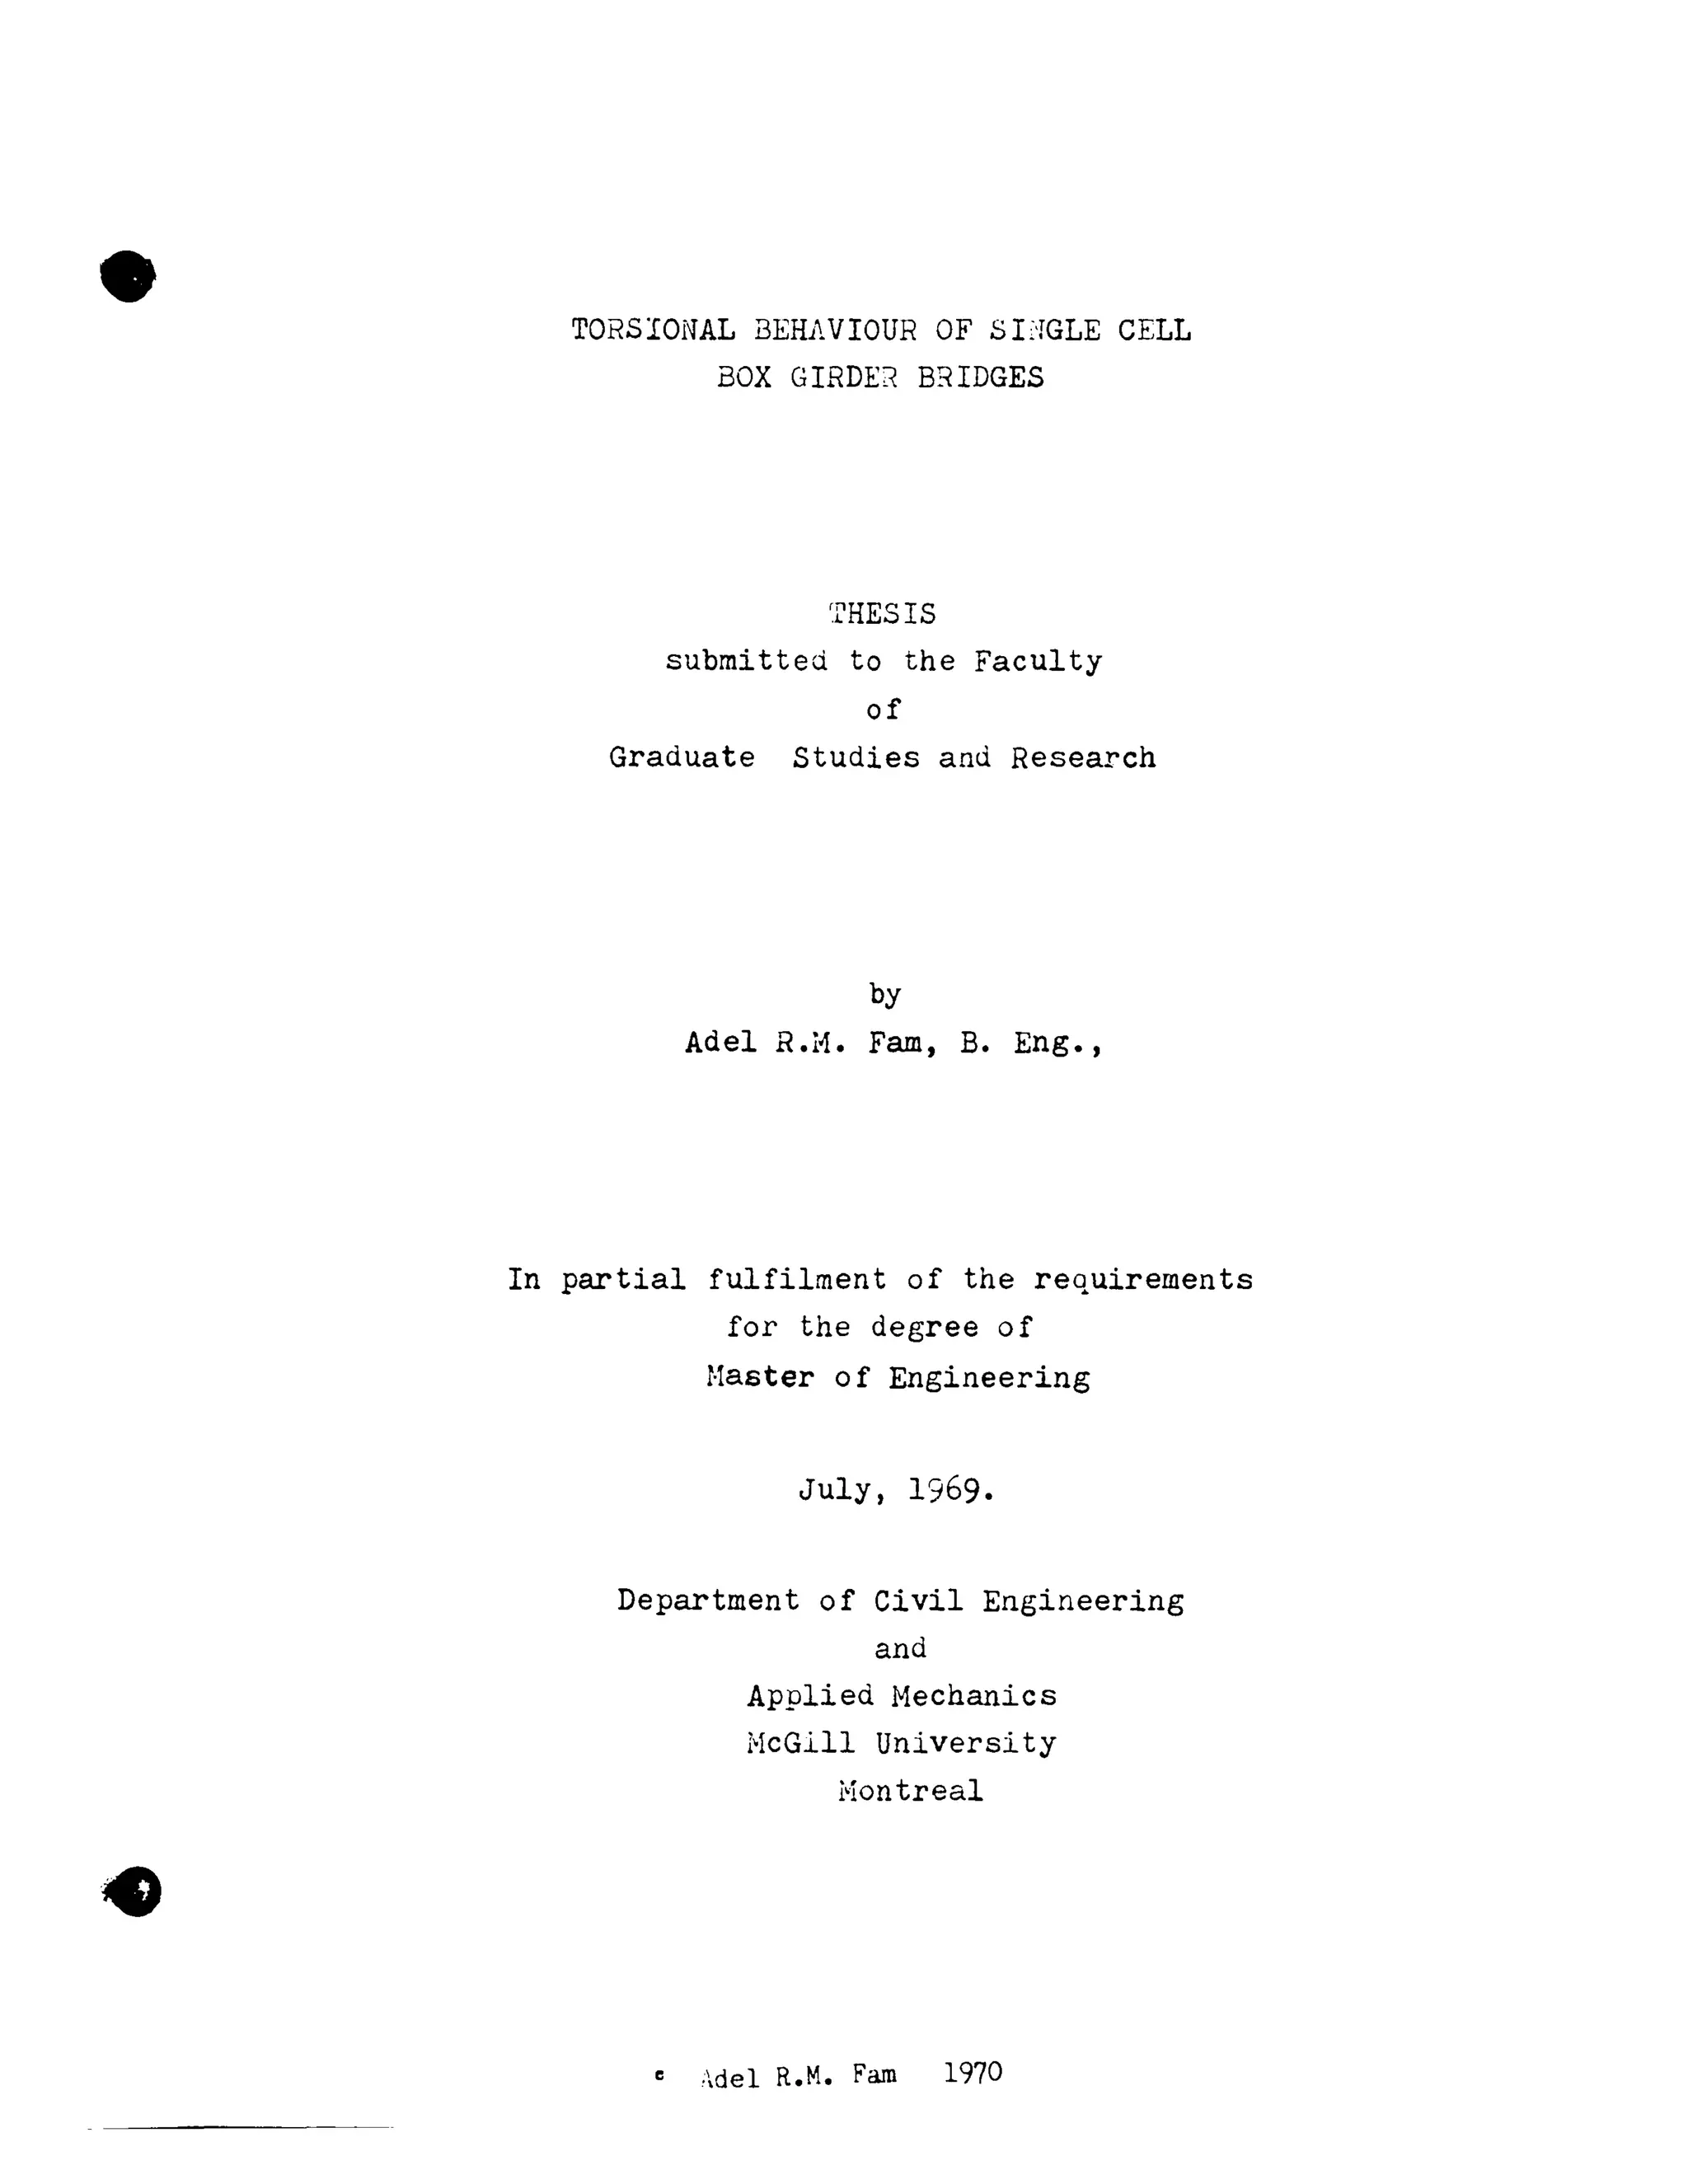
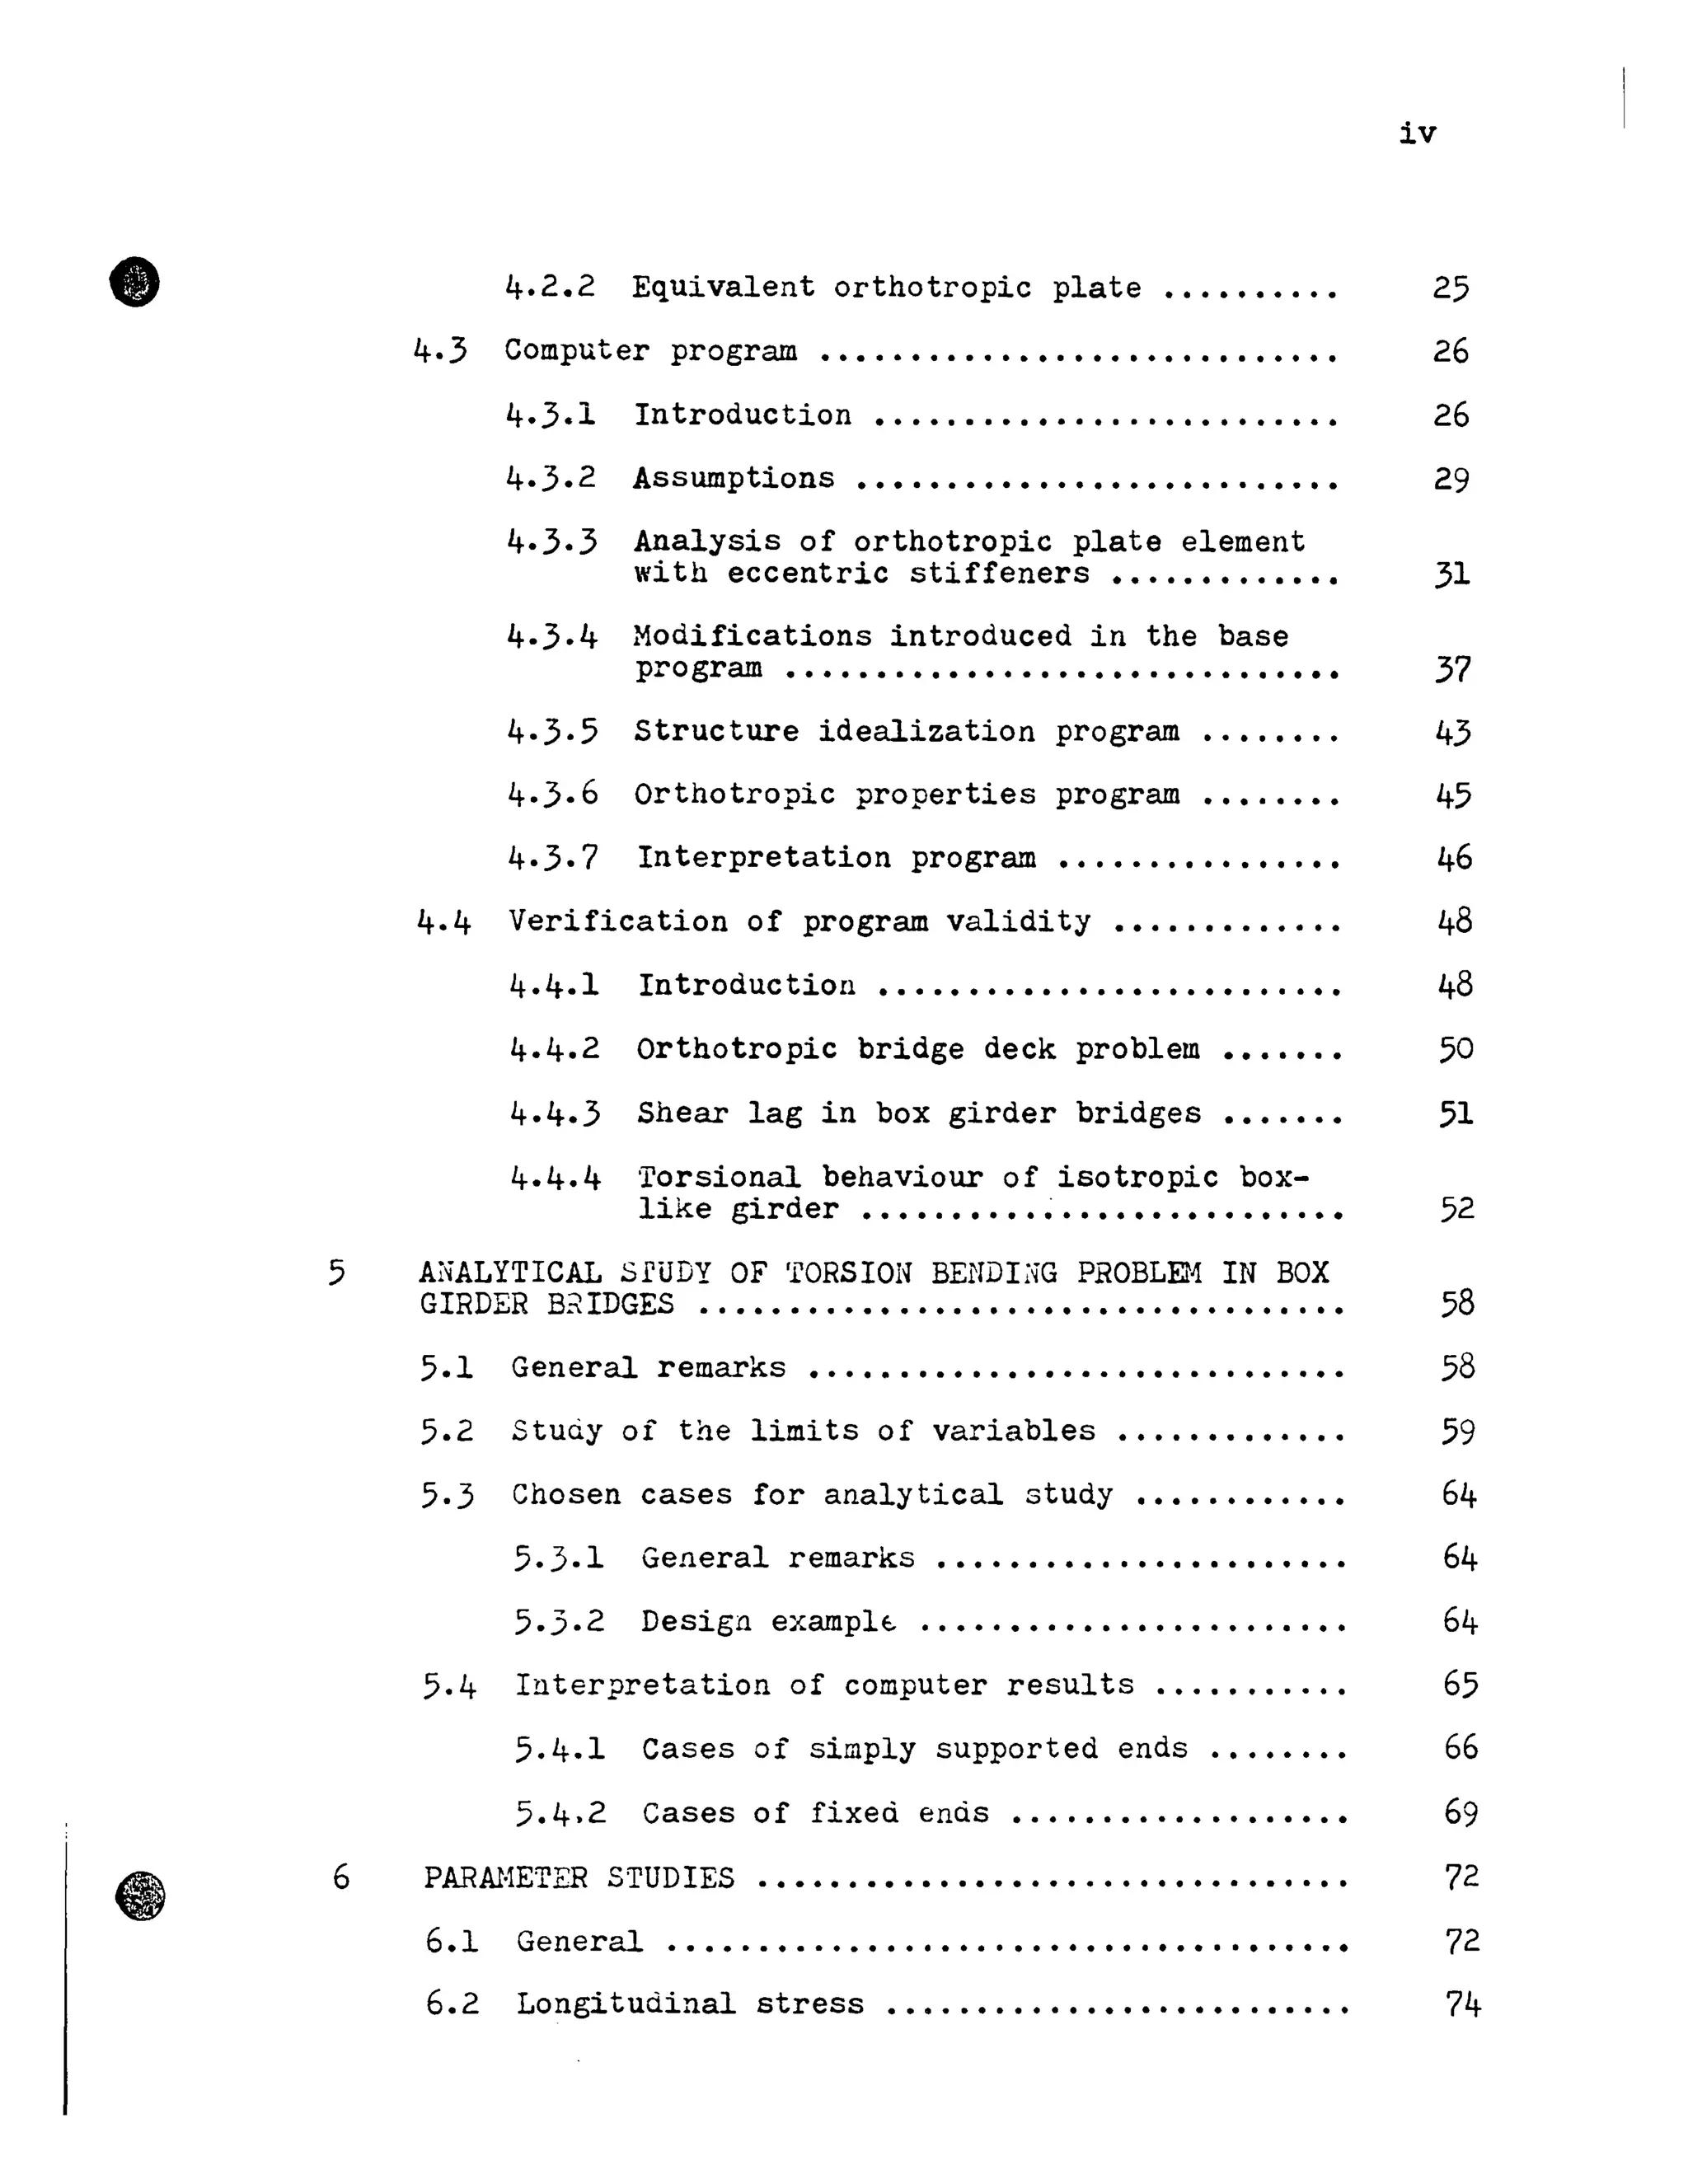
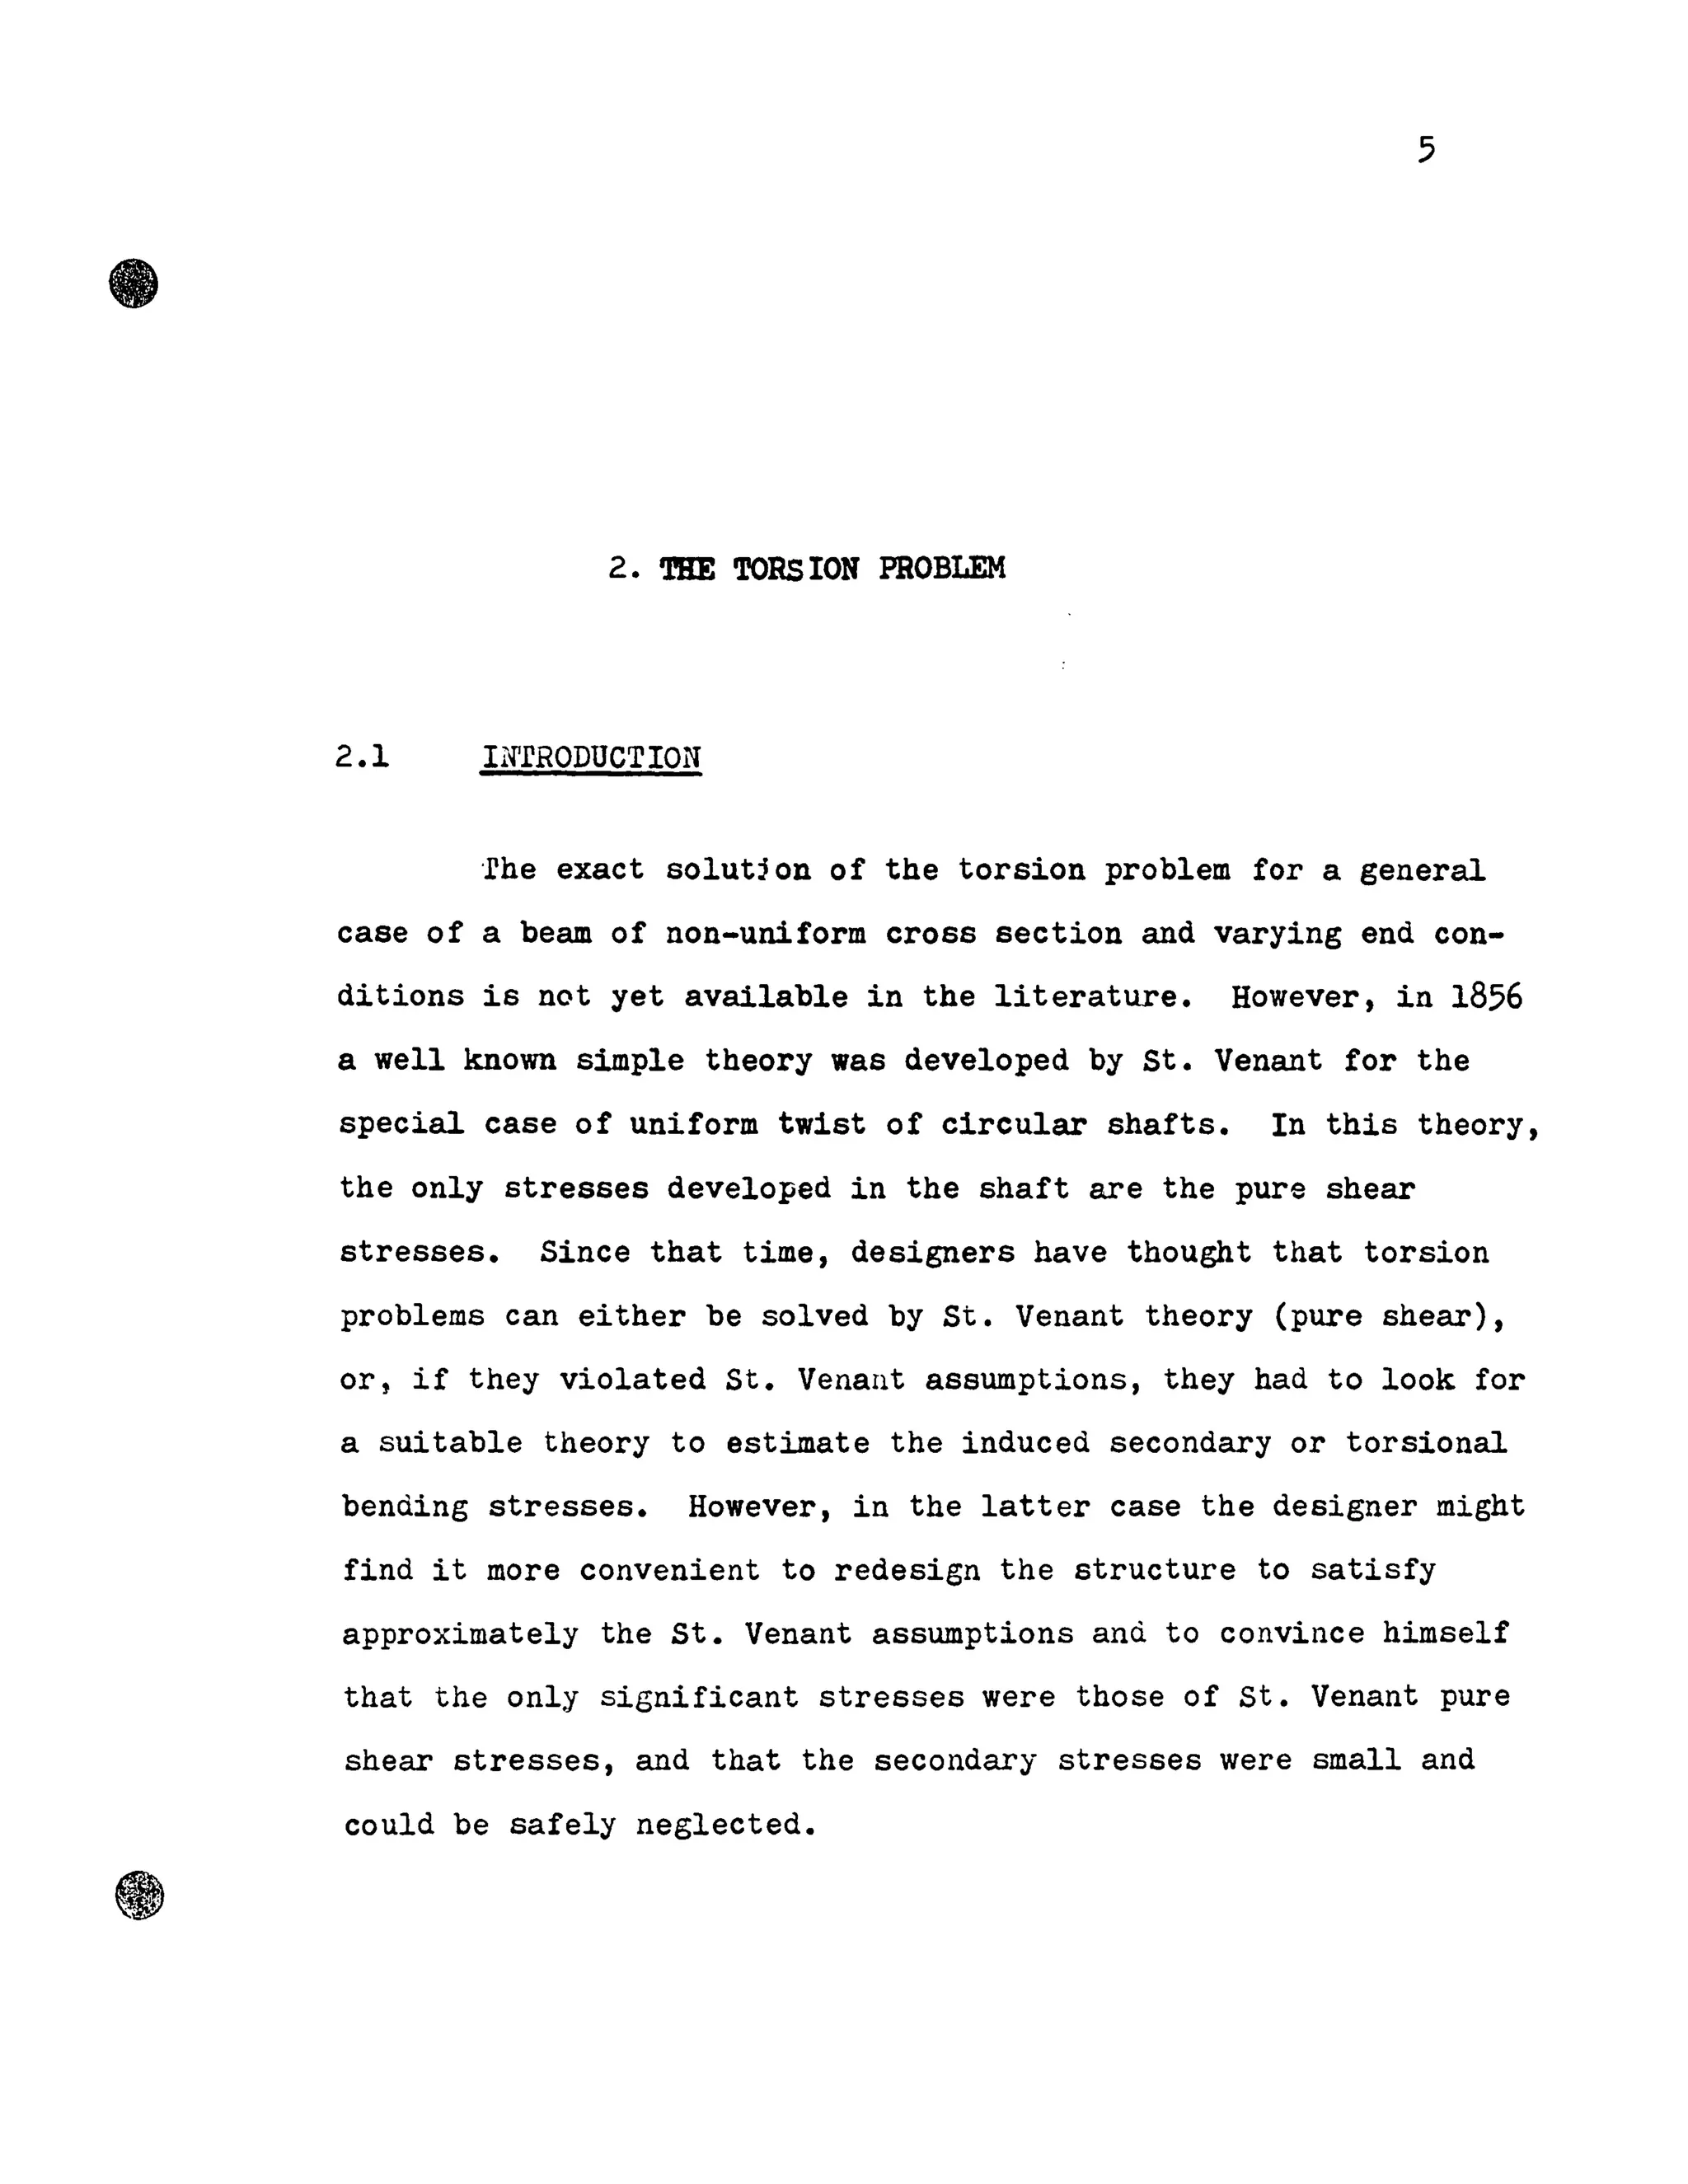
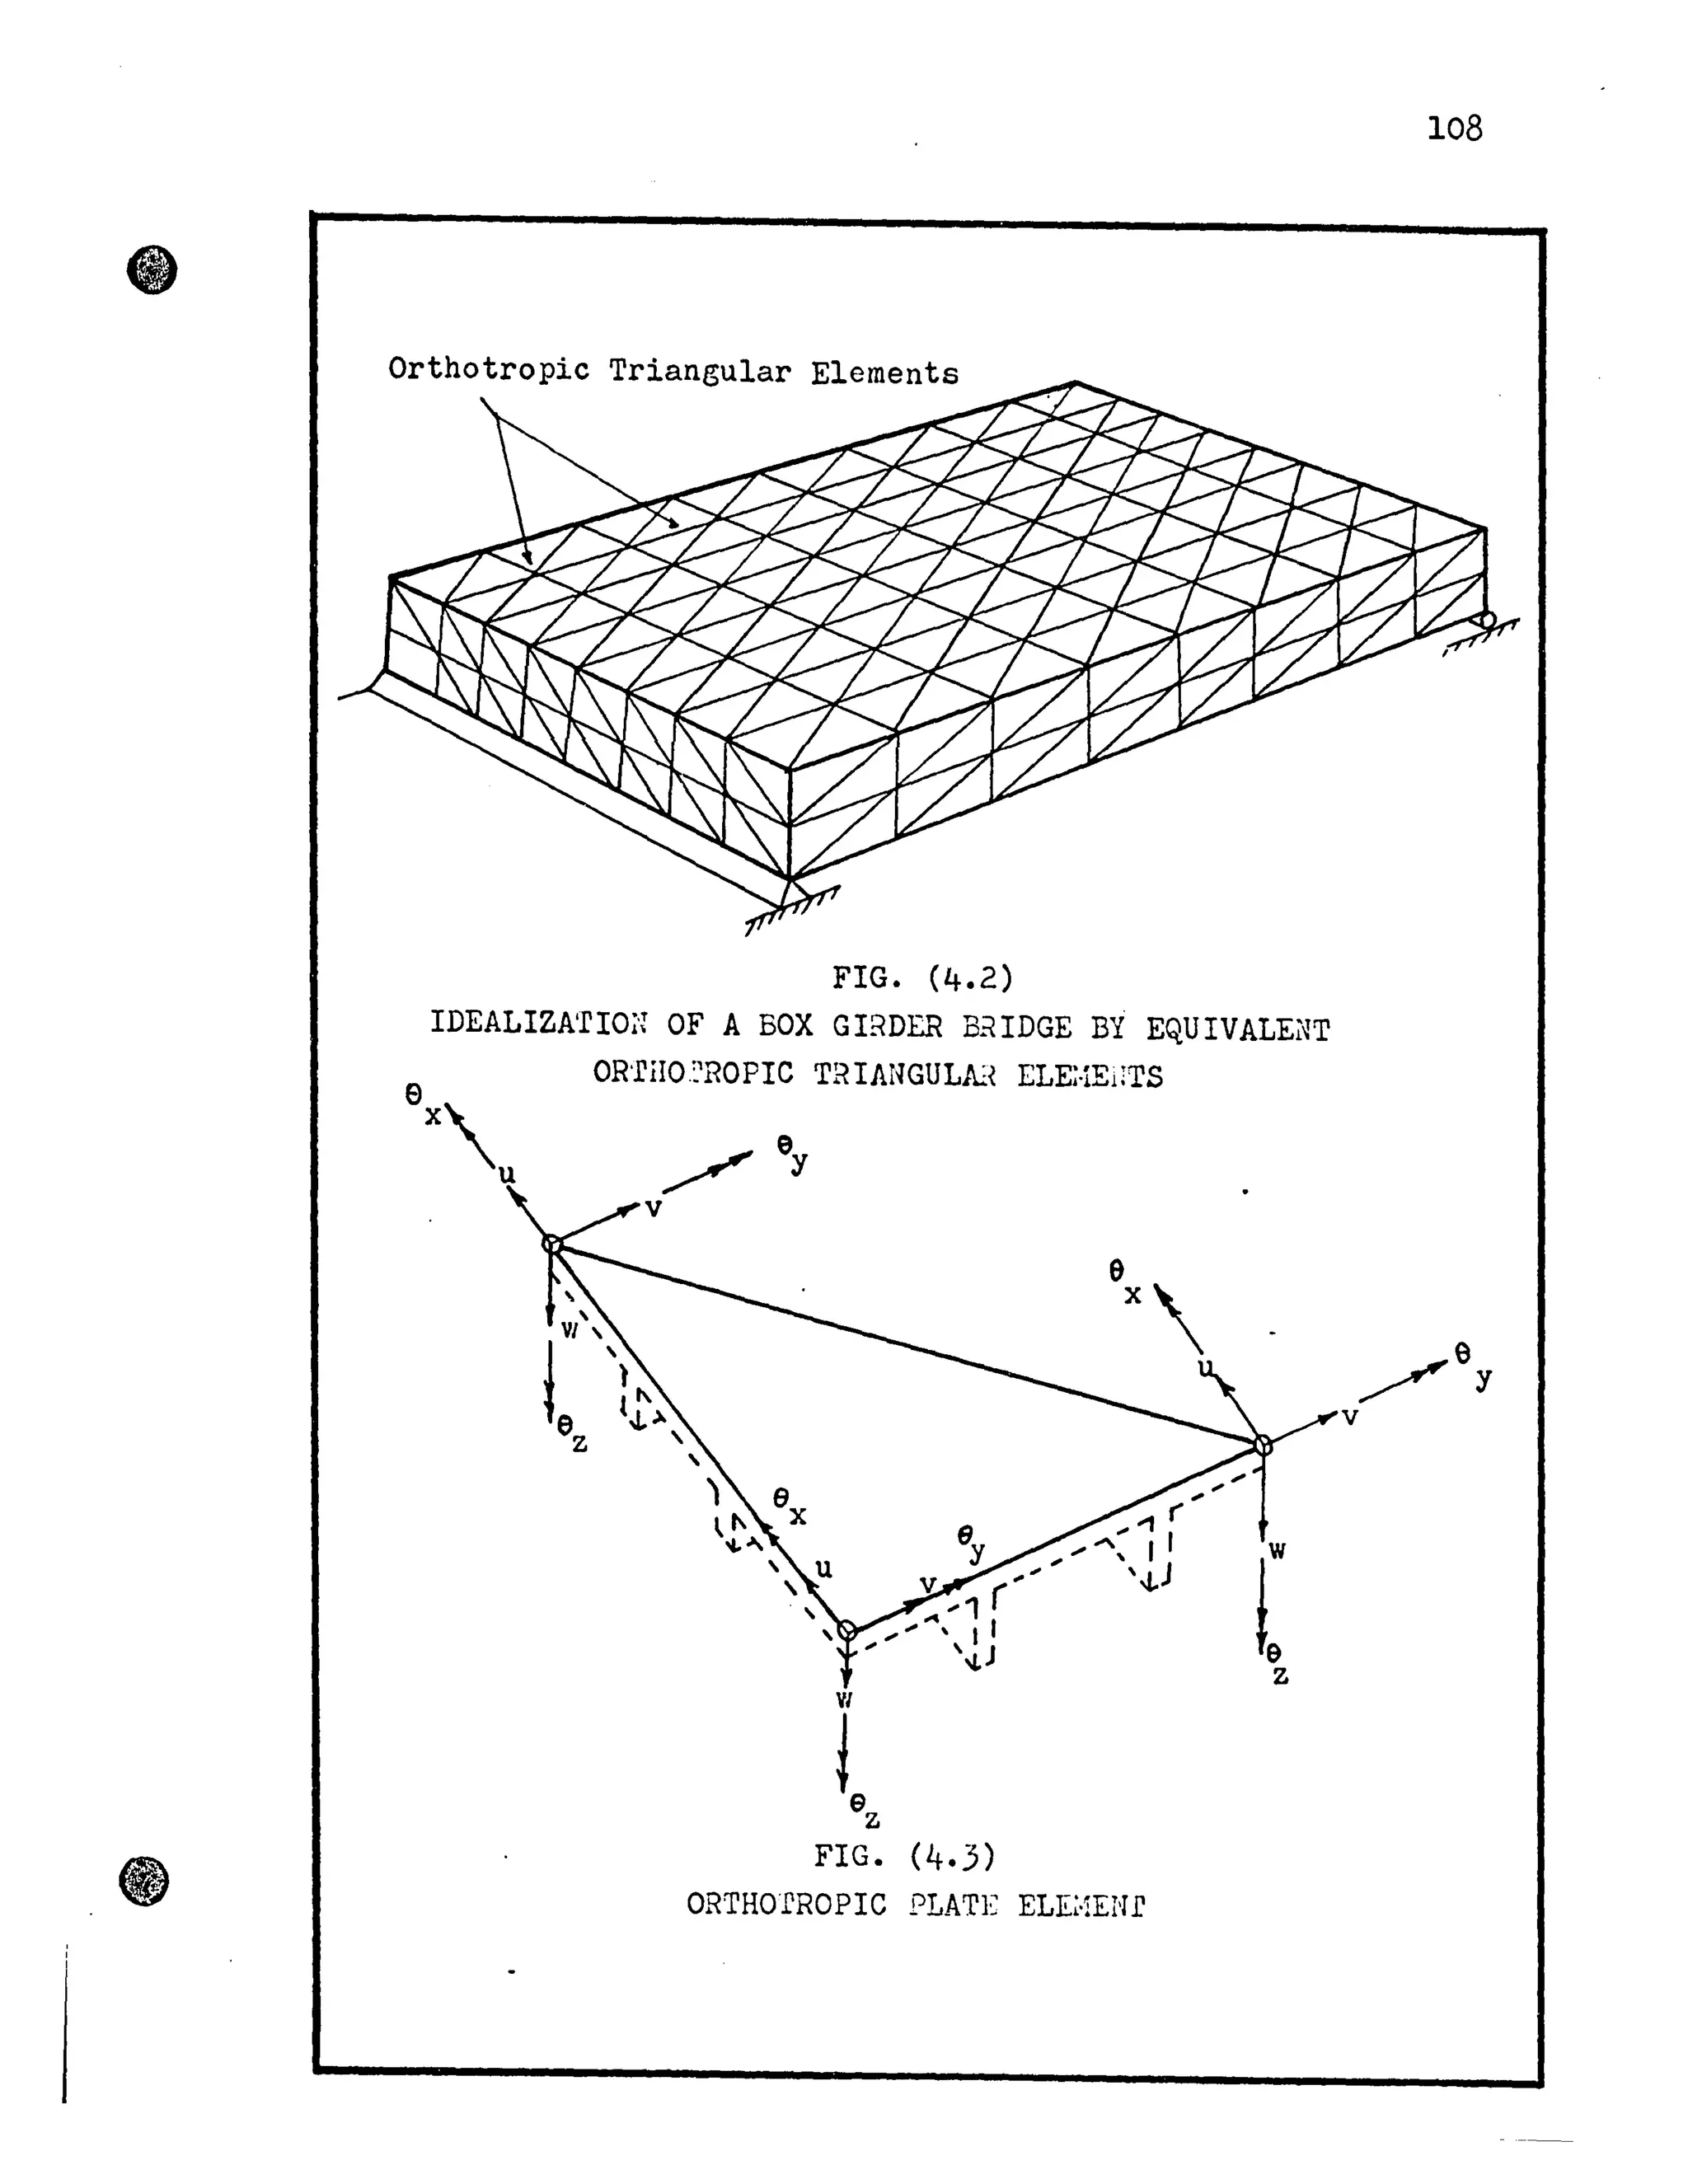
![Rigid Joints
e.
107
Bearn
Hembers
Triangular Plane
stress Elements
x~
Vi
VI !z
e~z
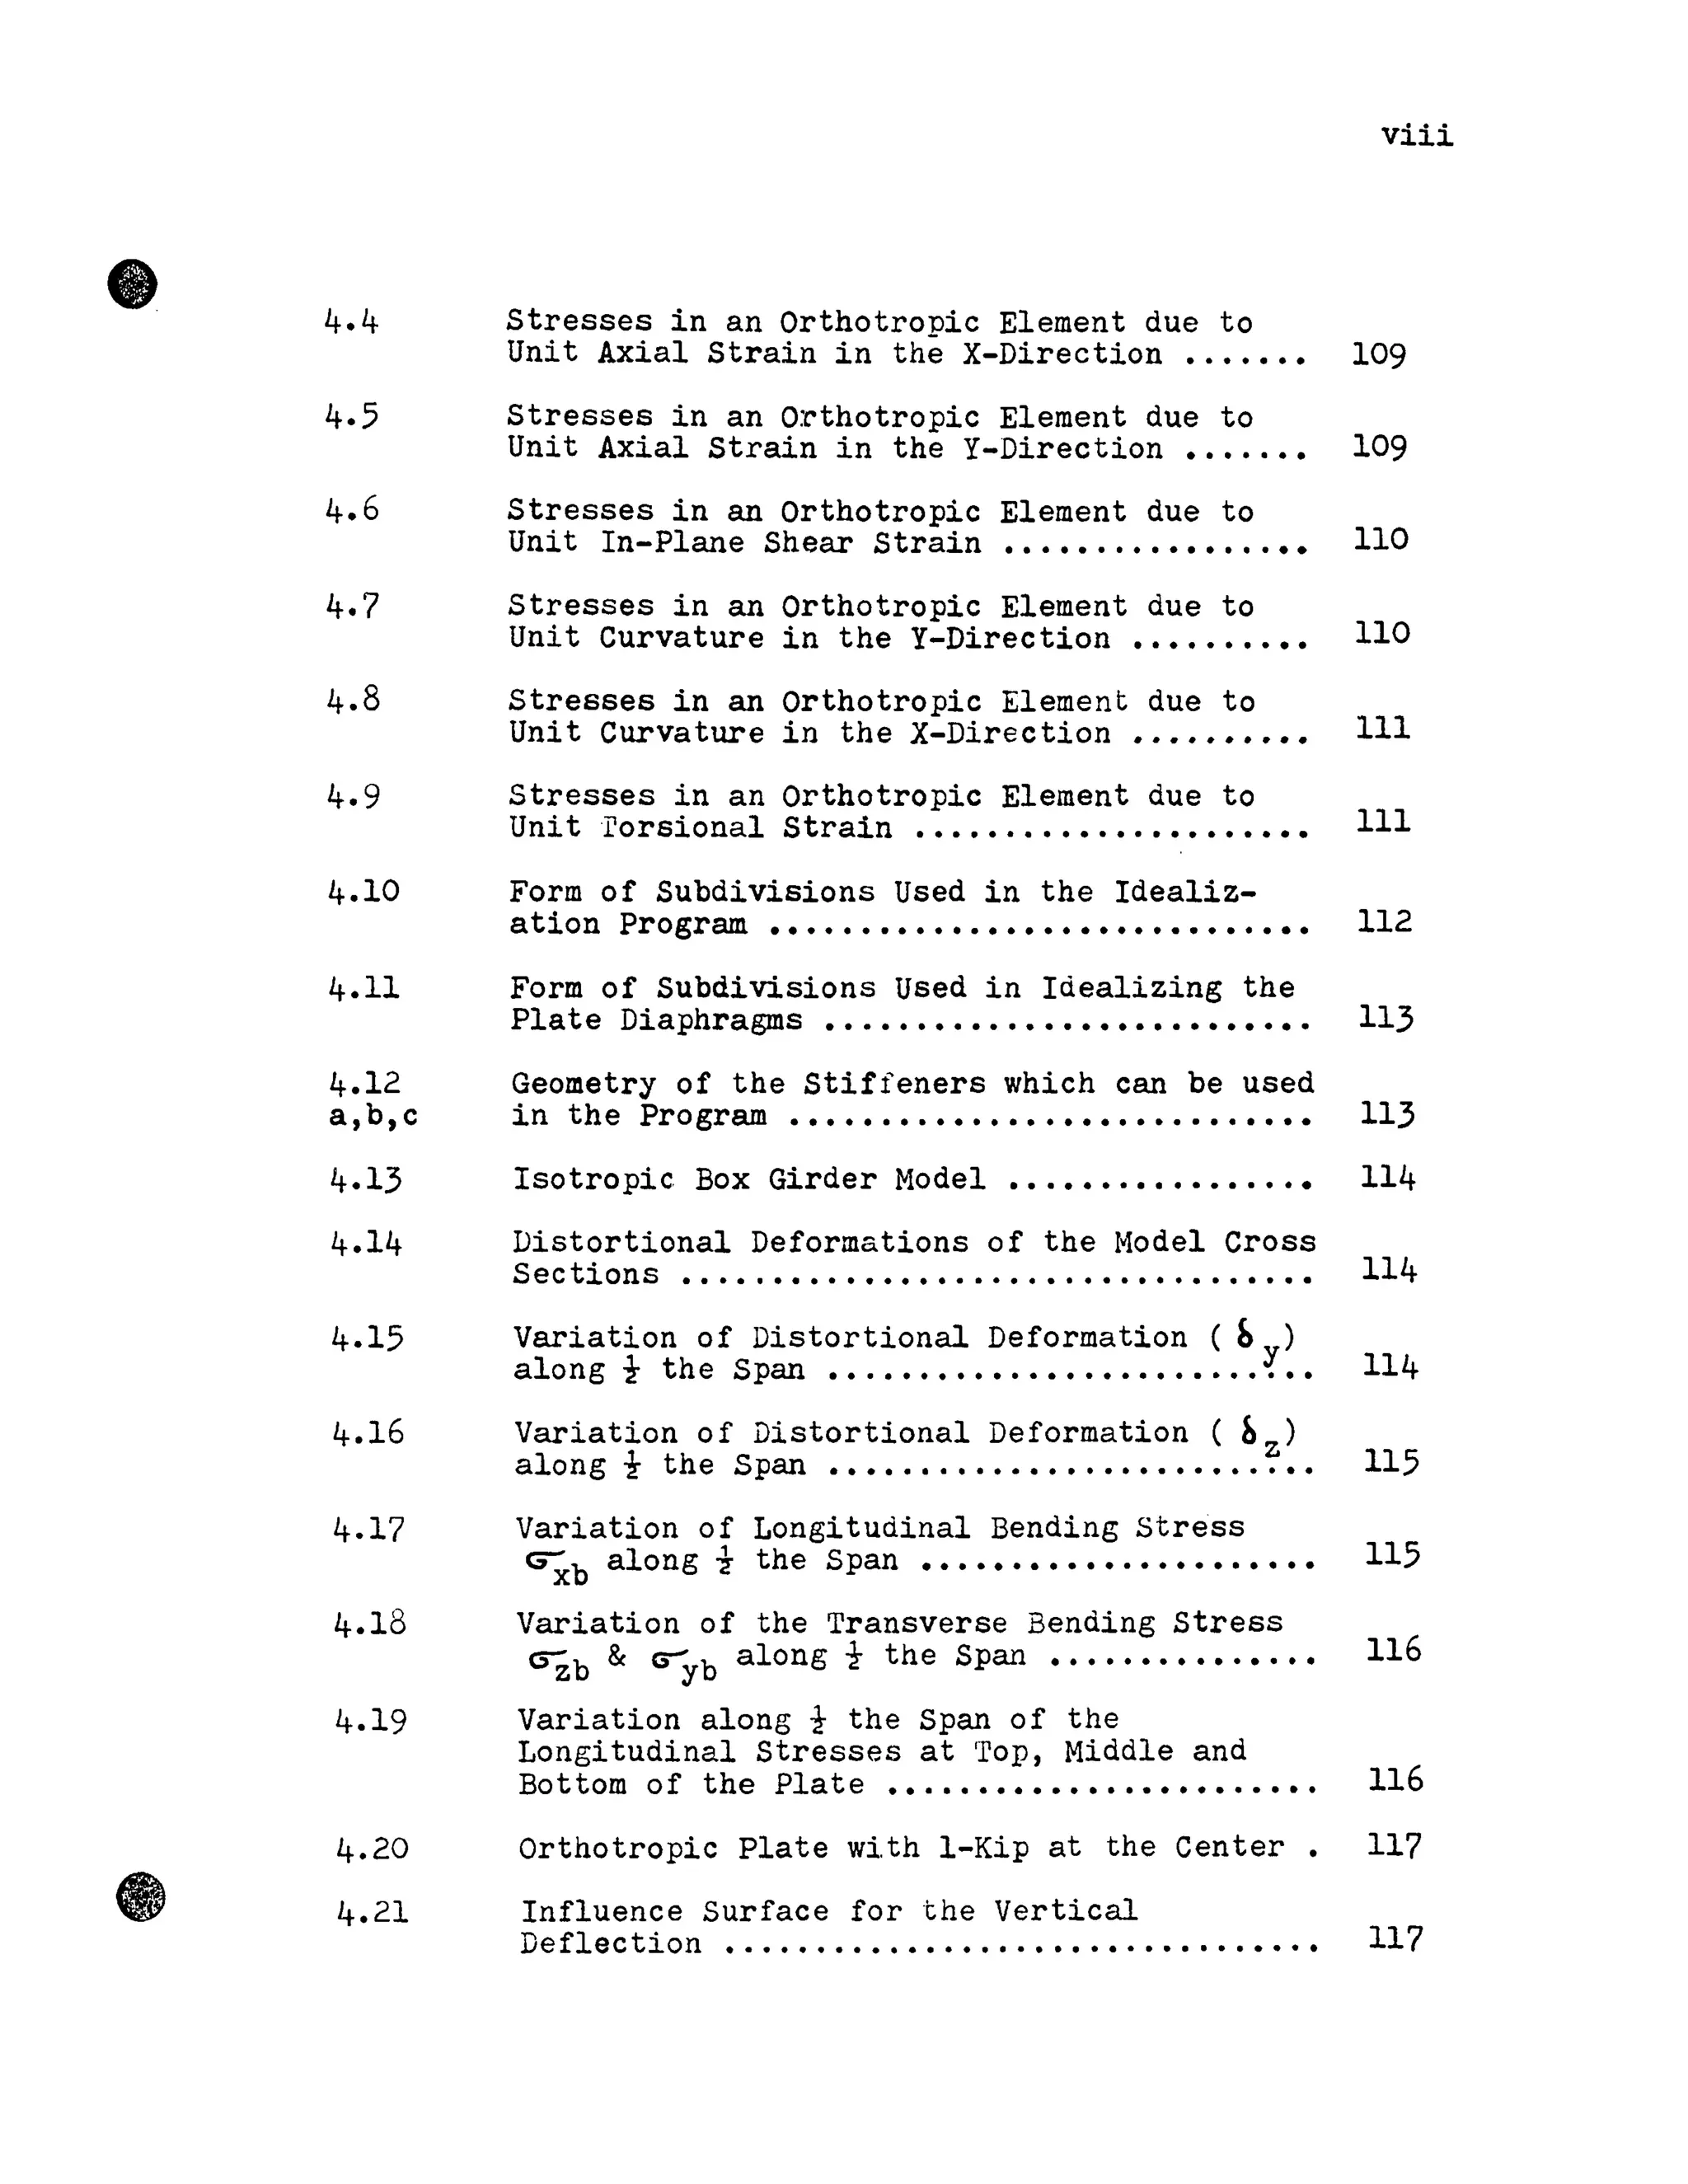
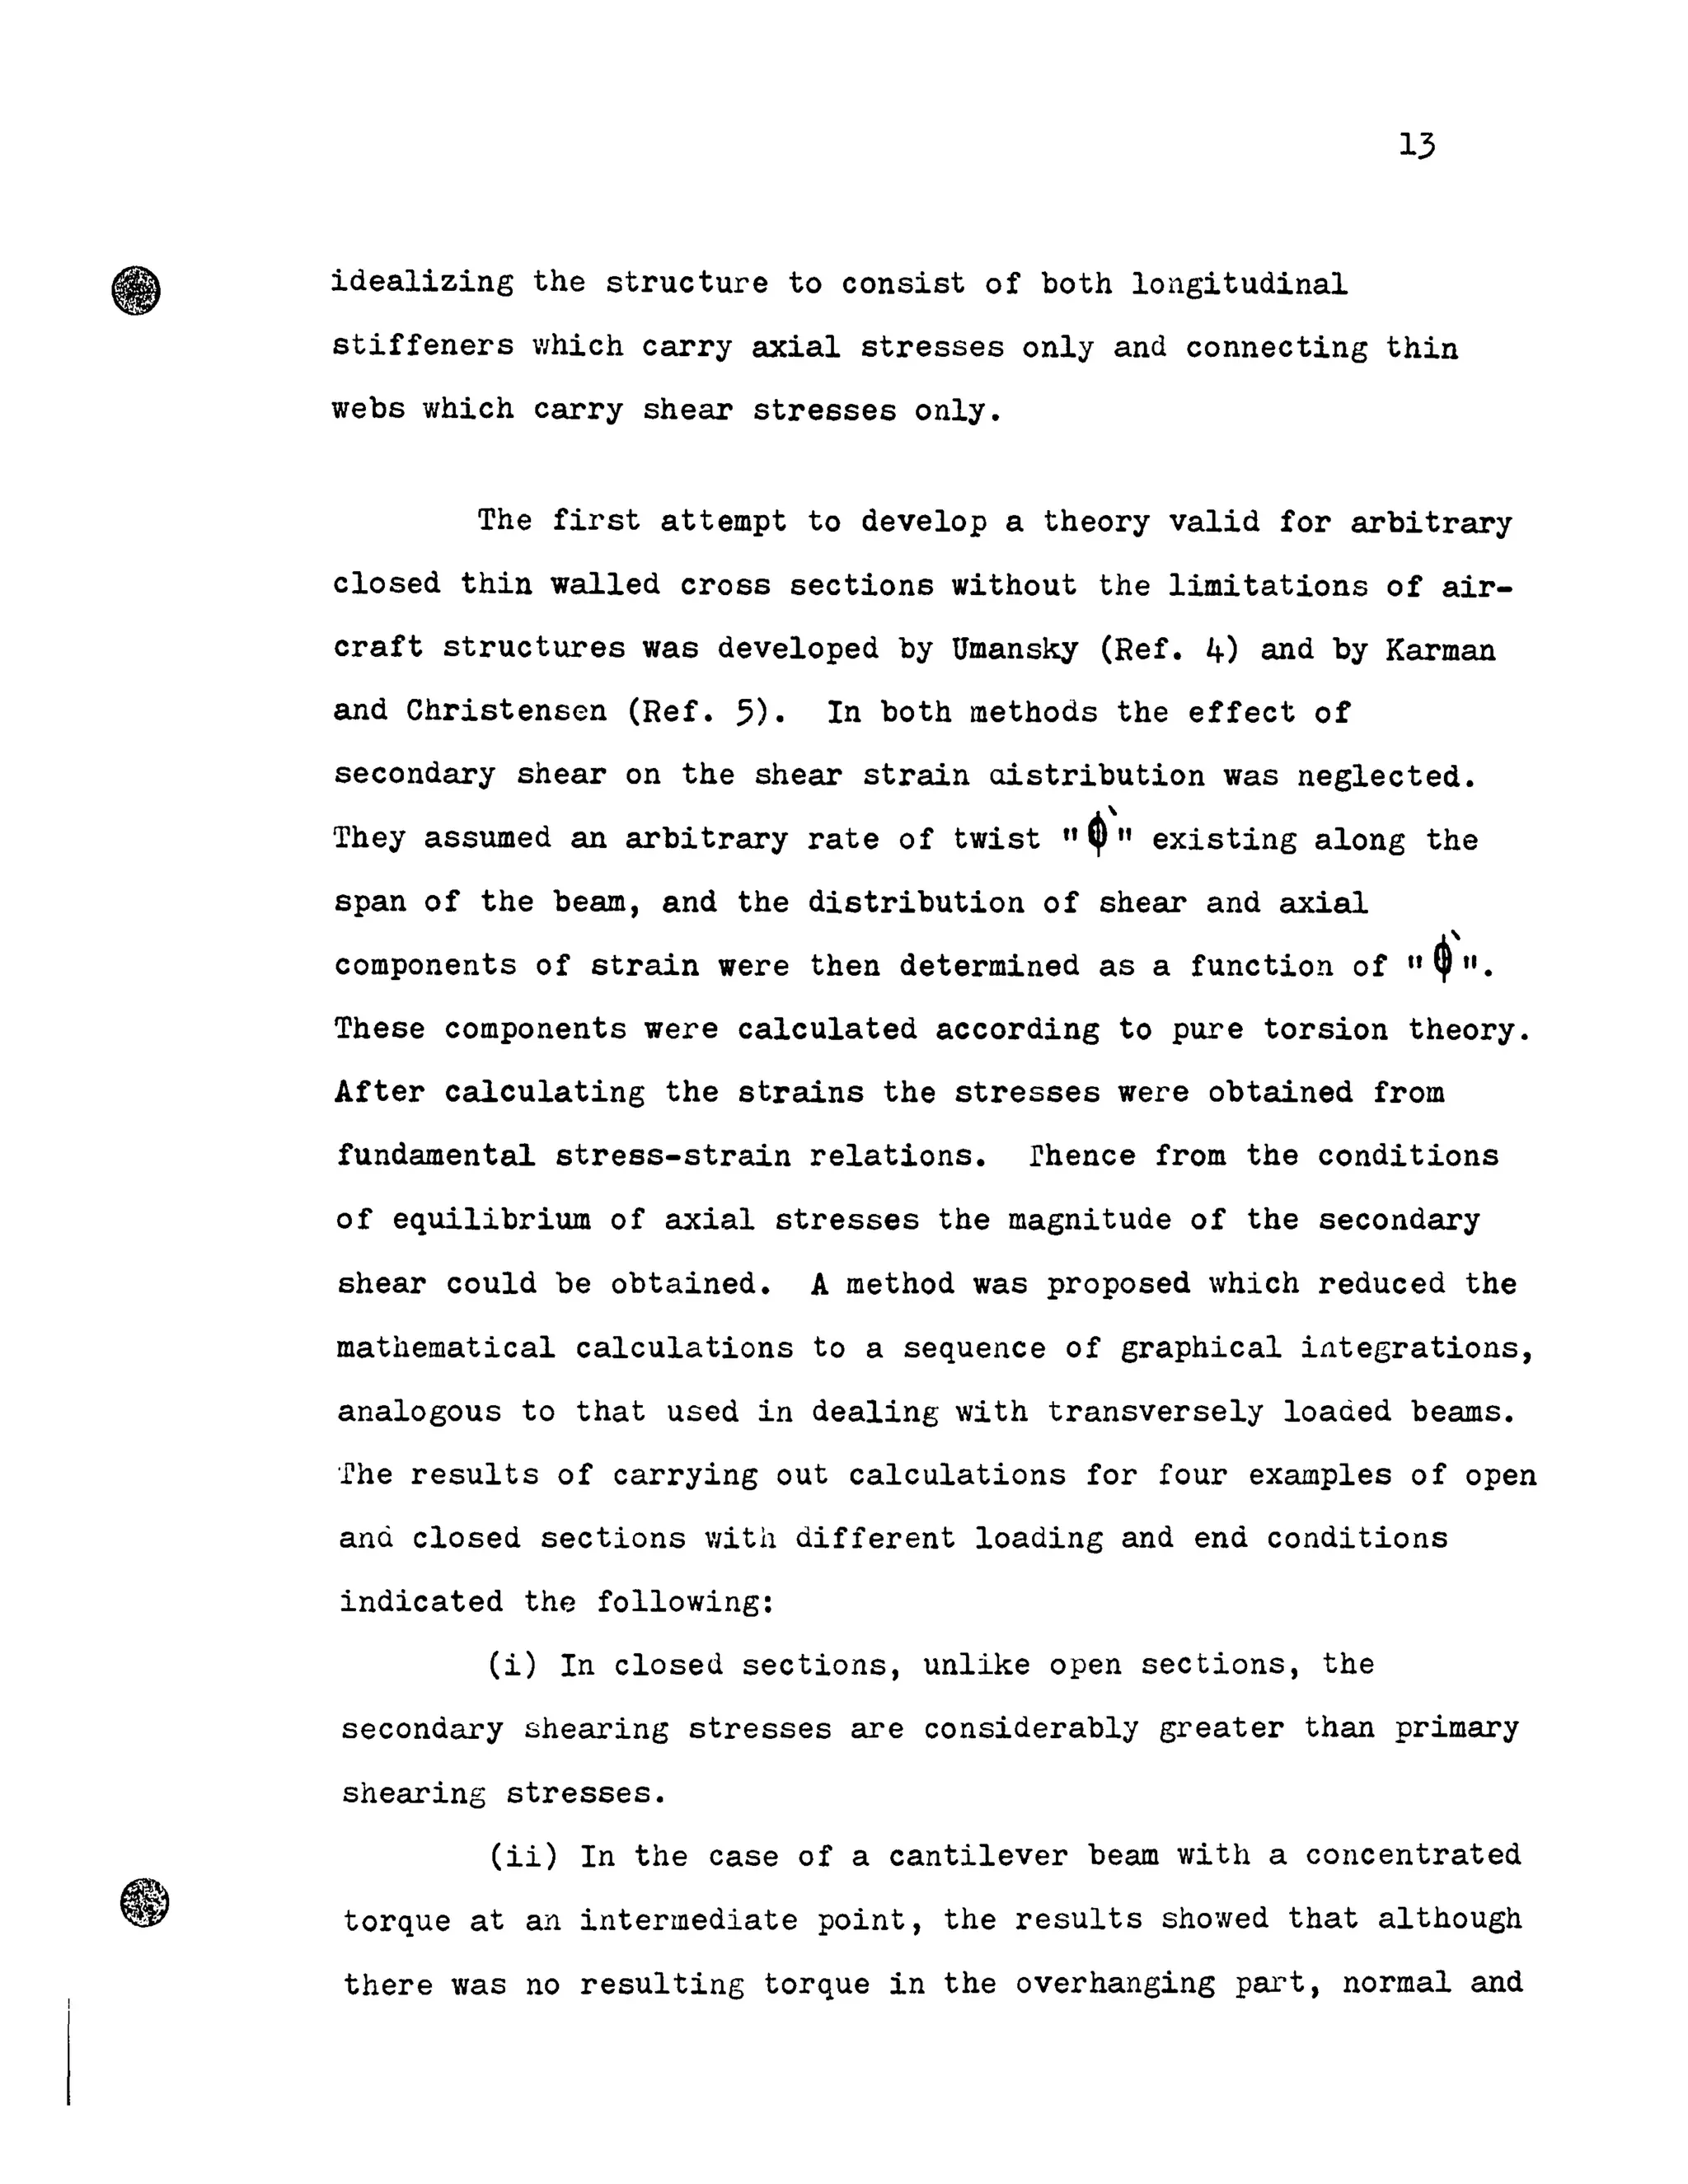
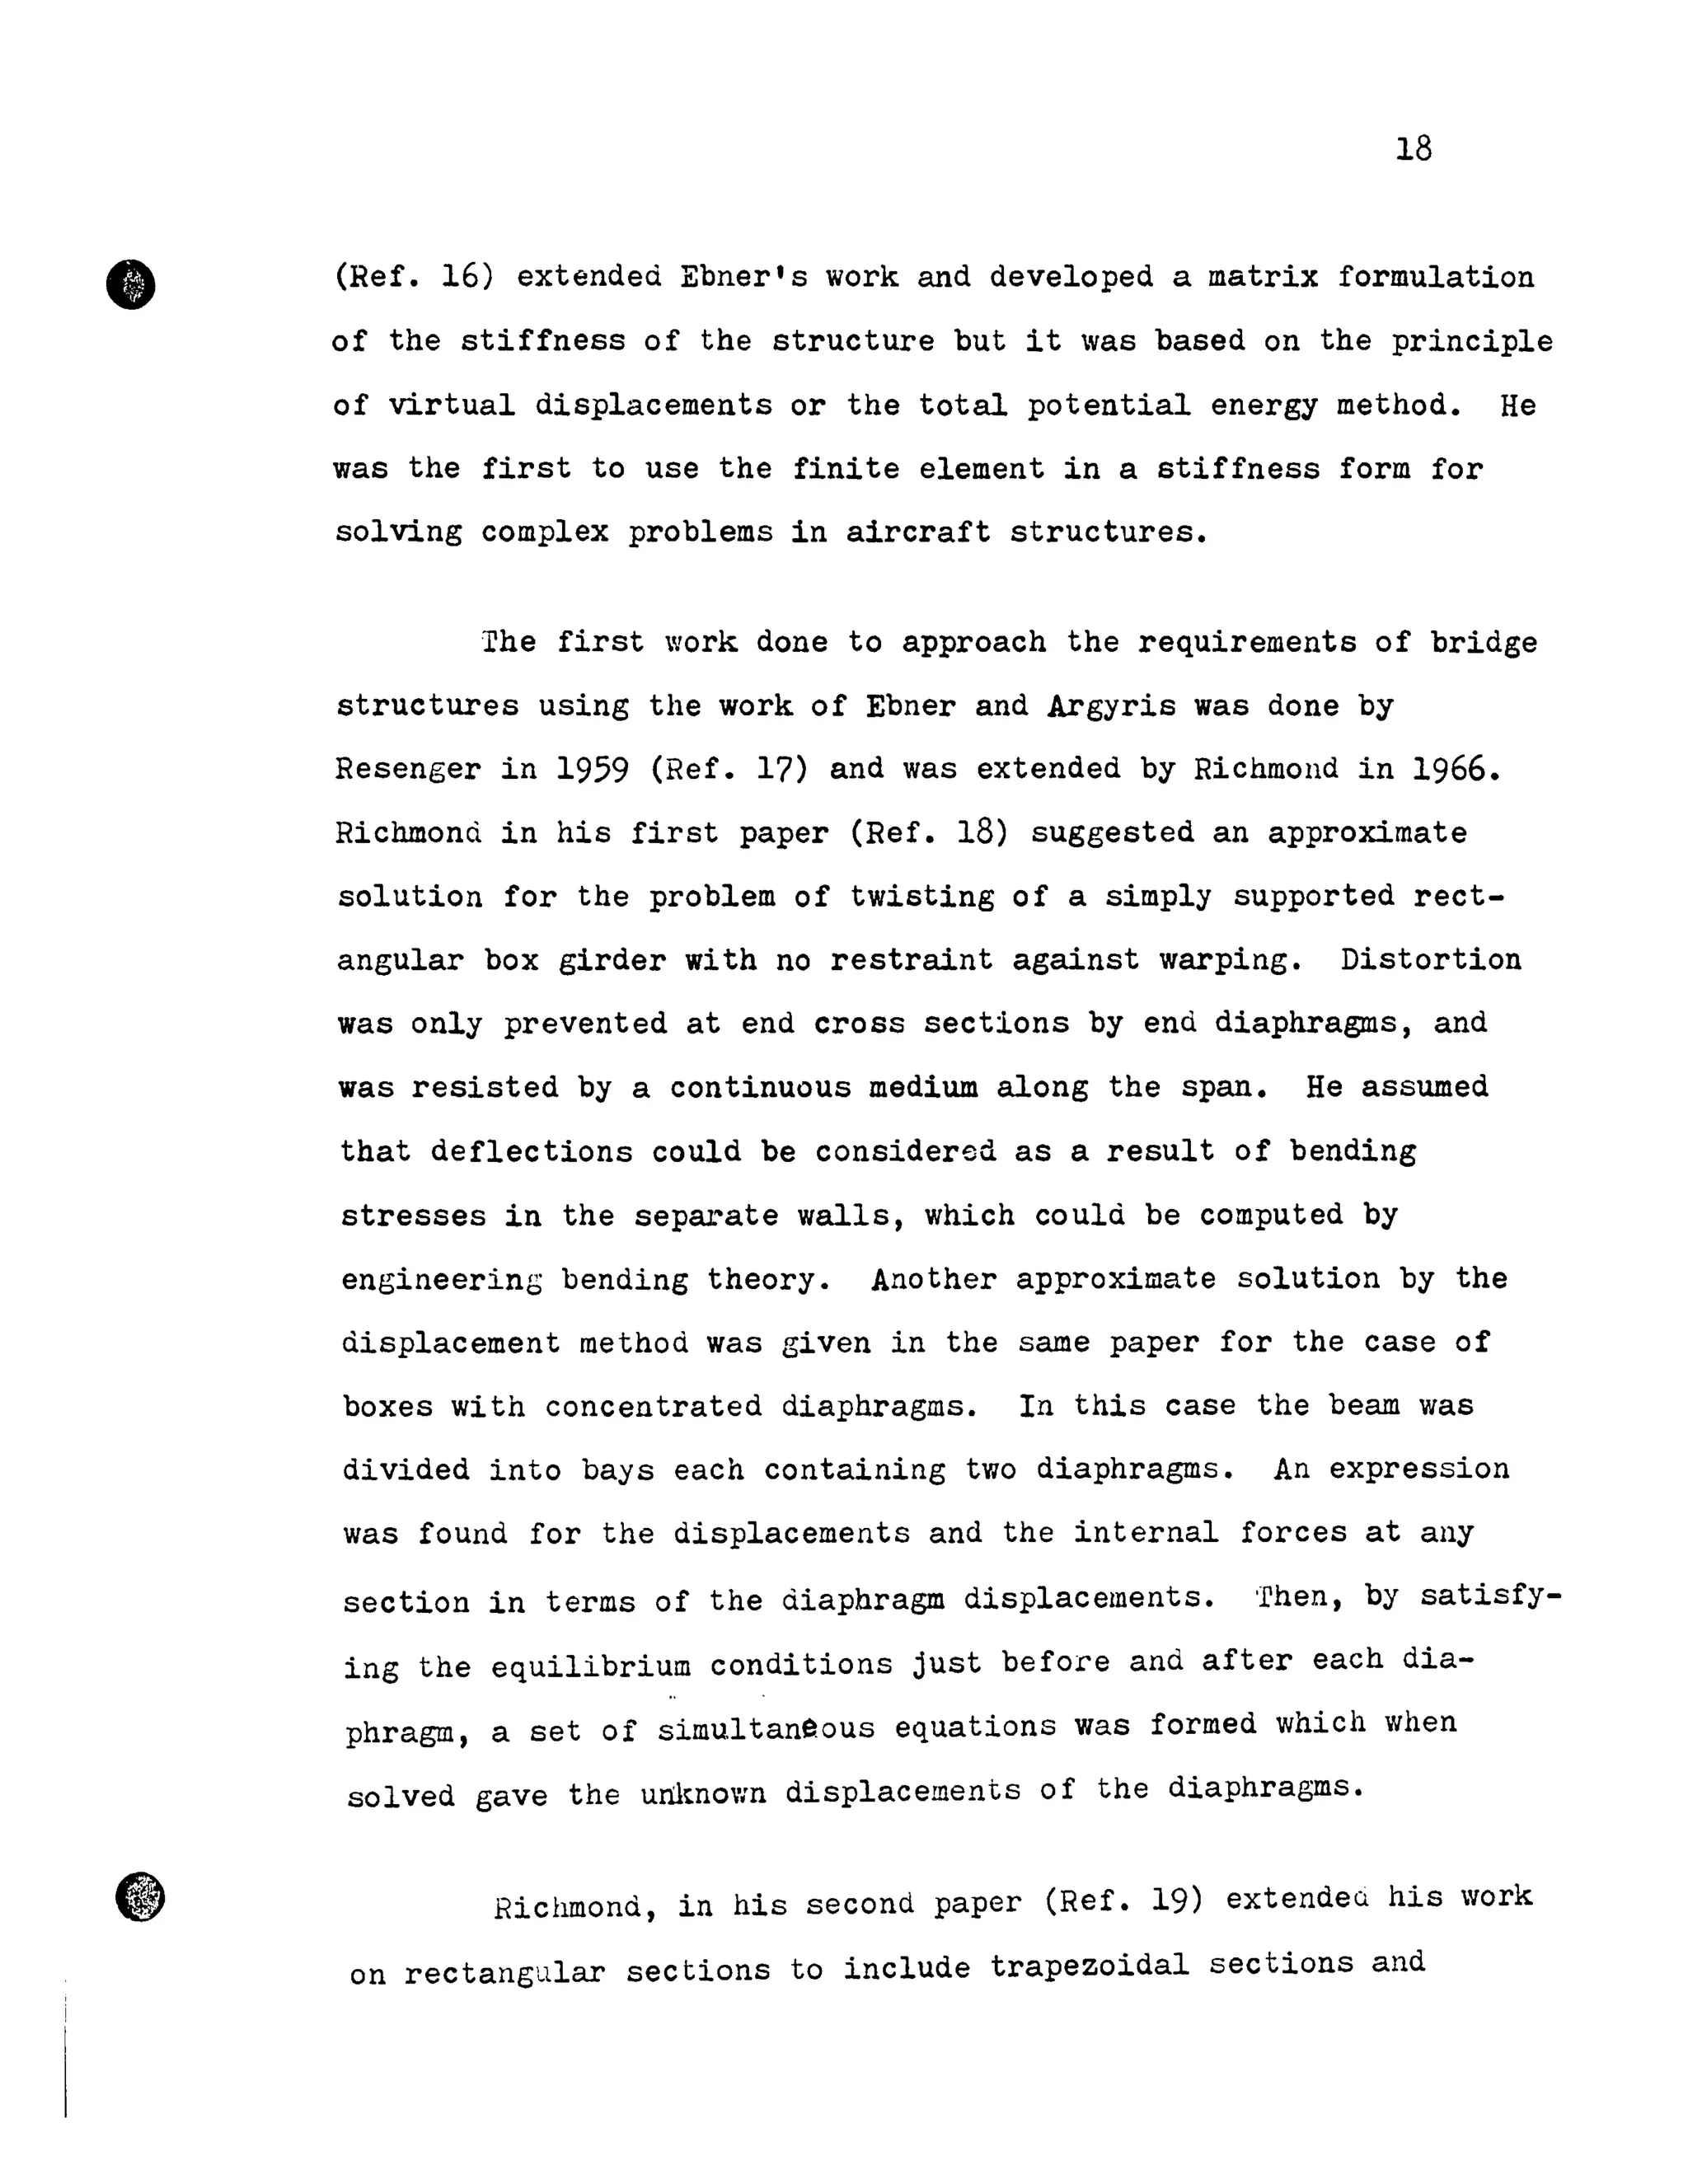
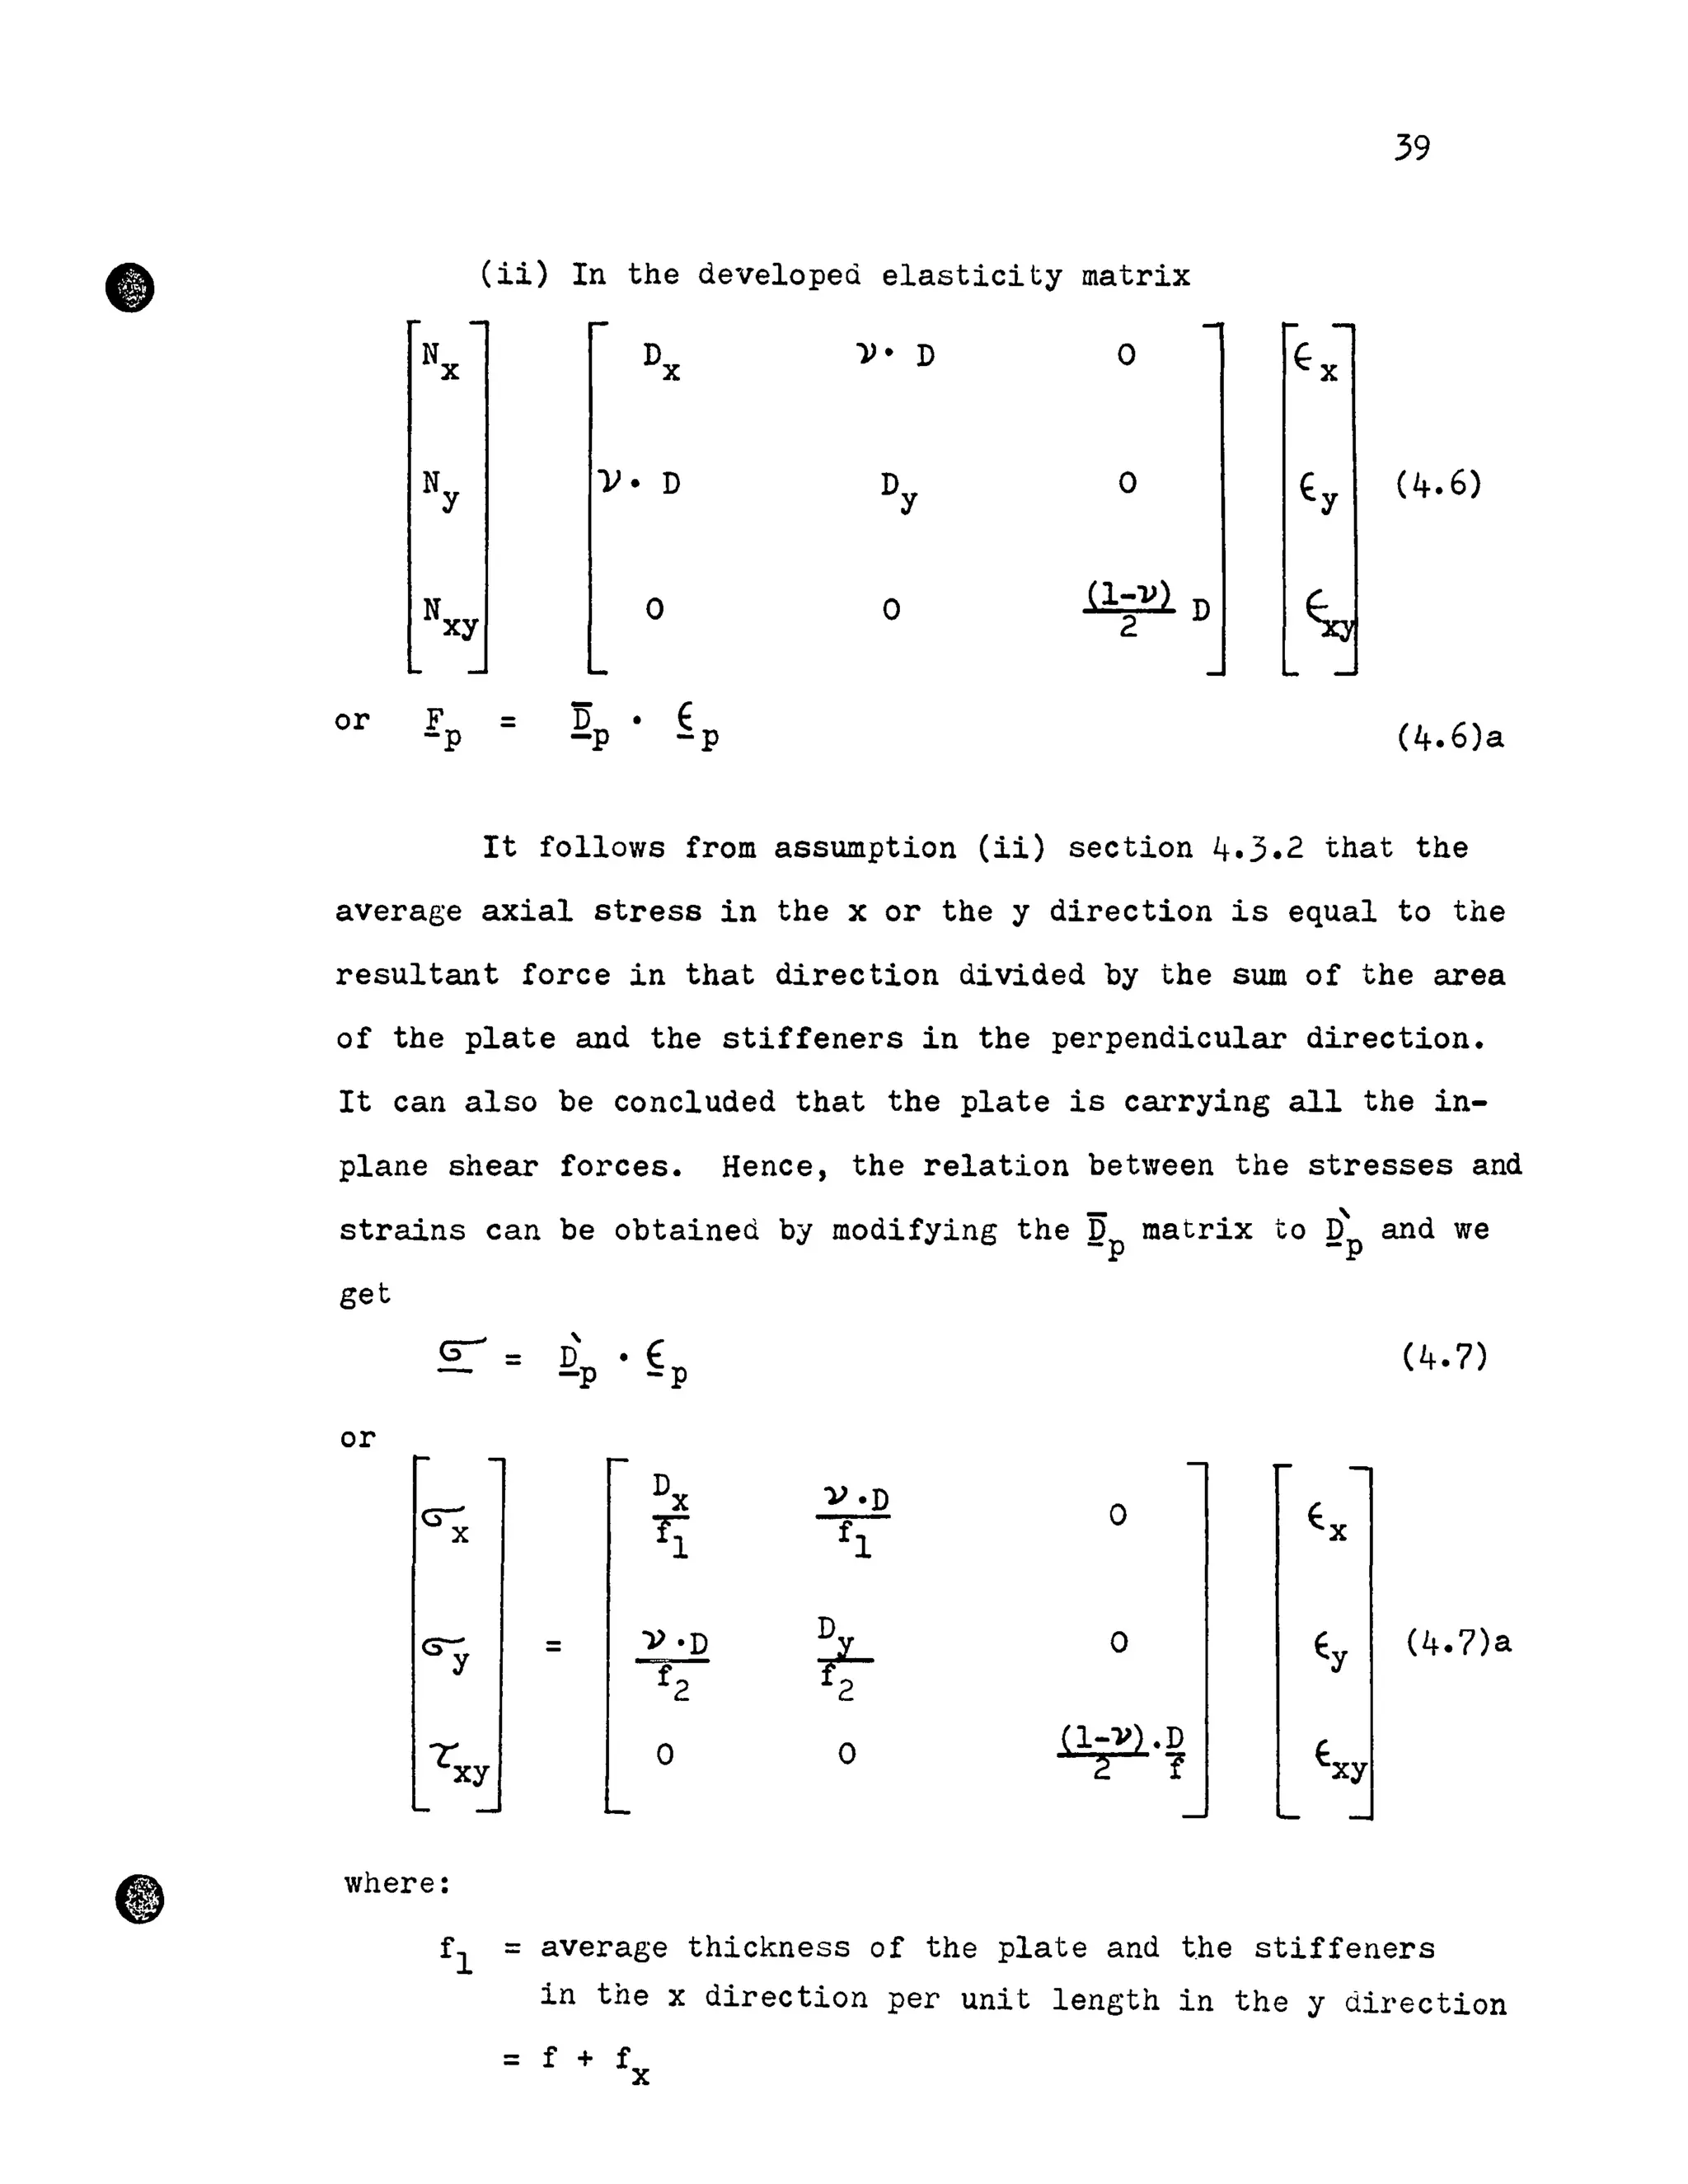
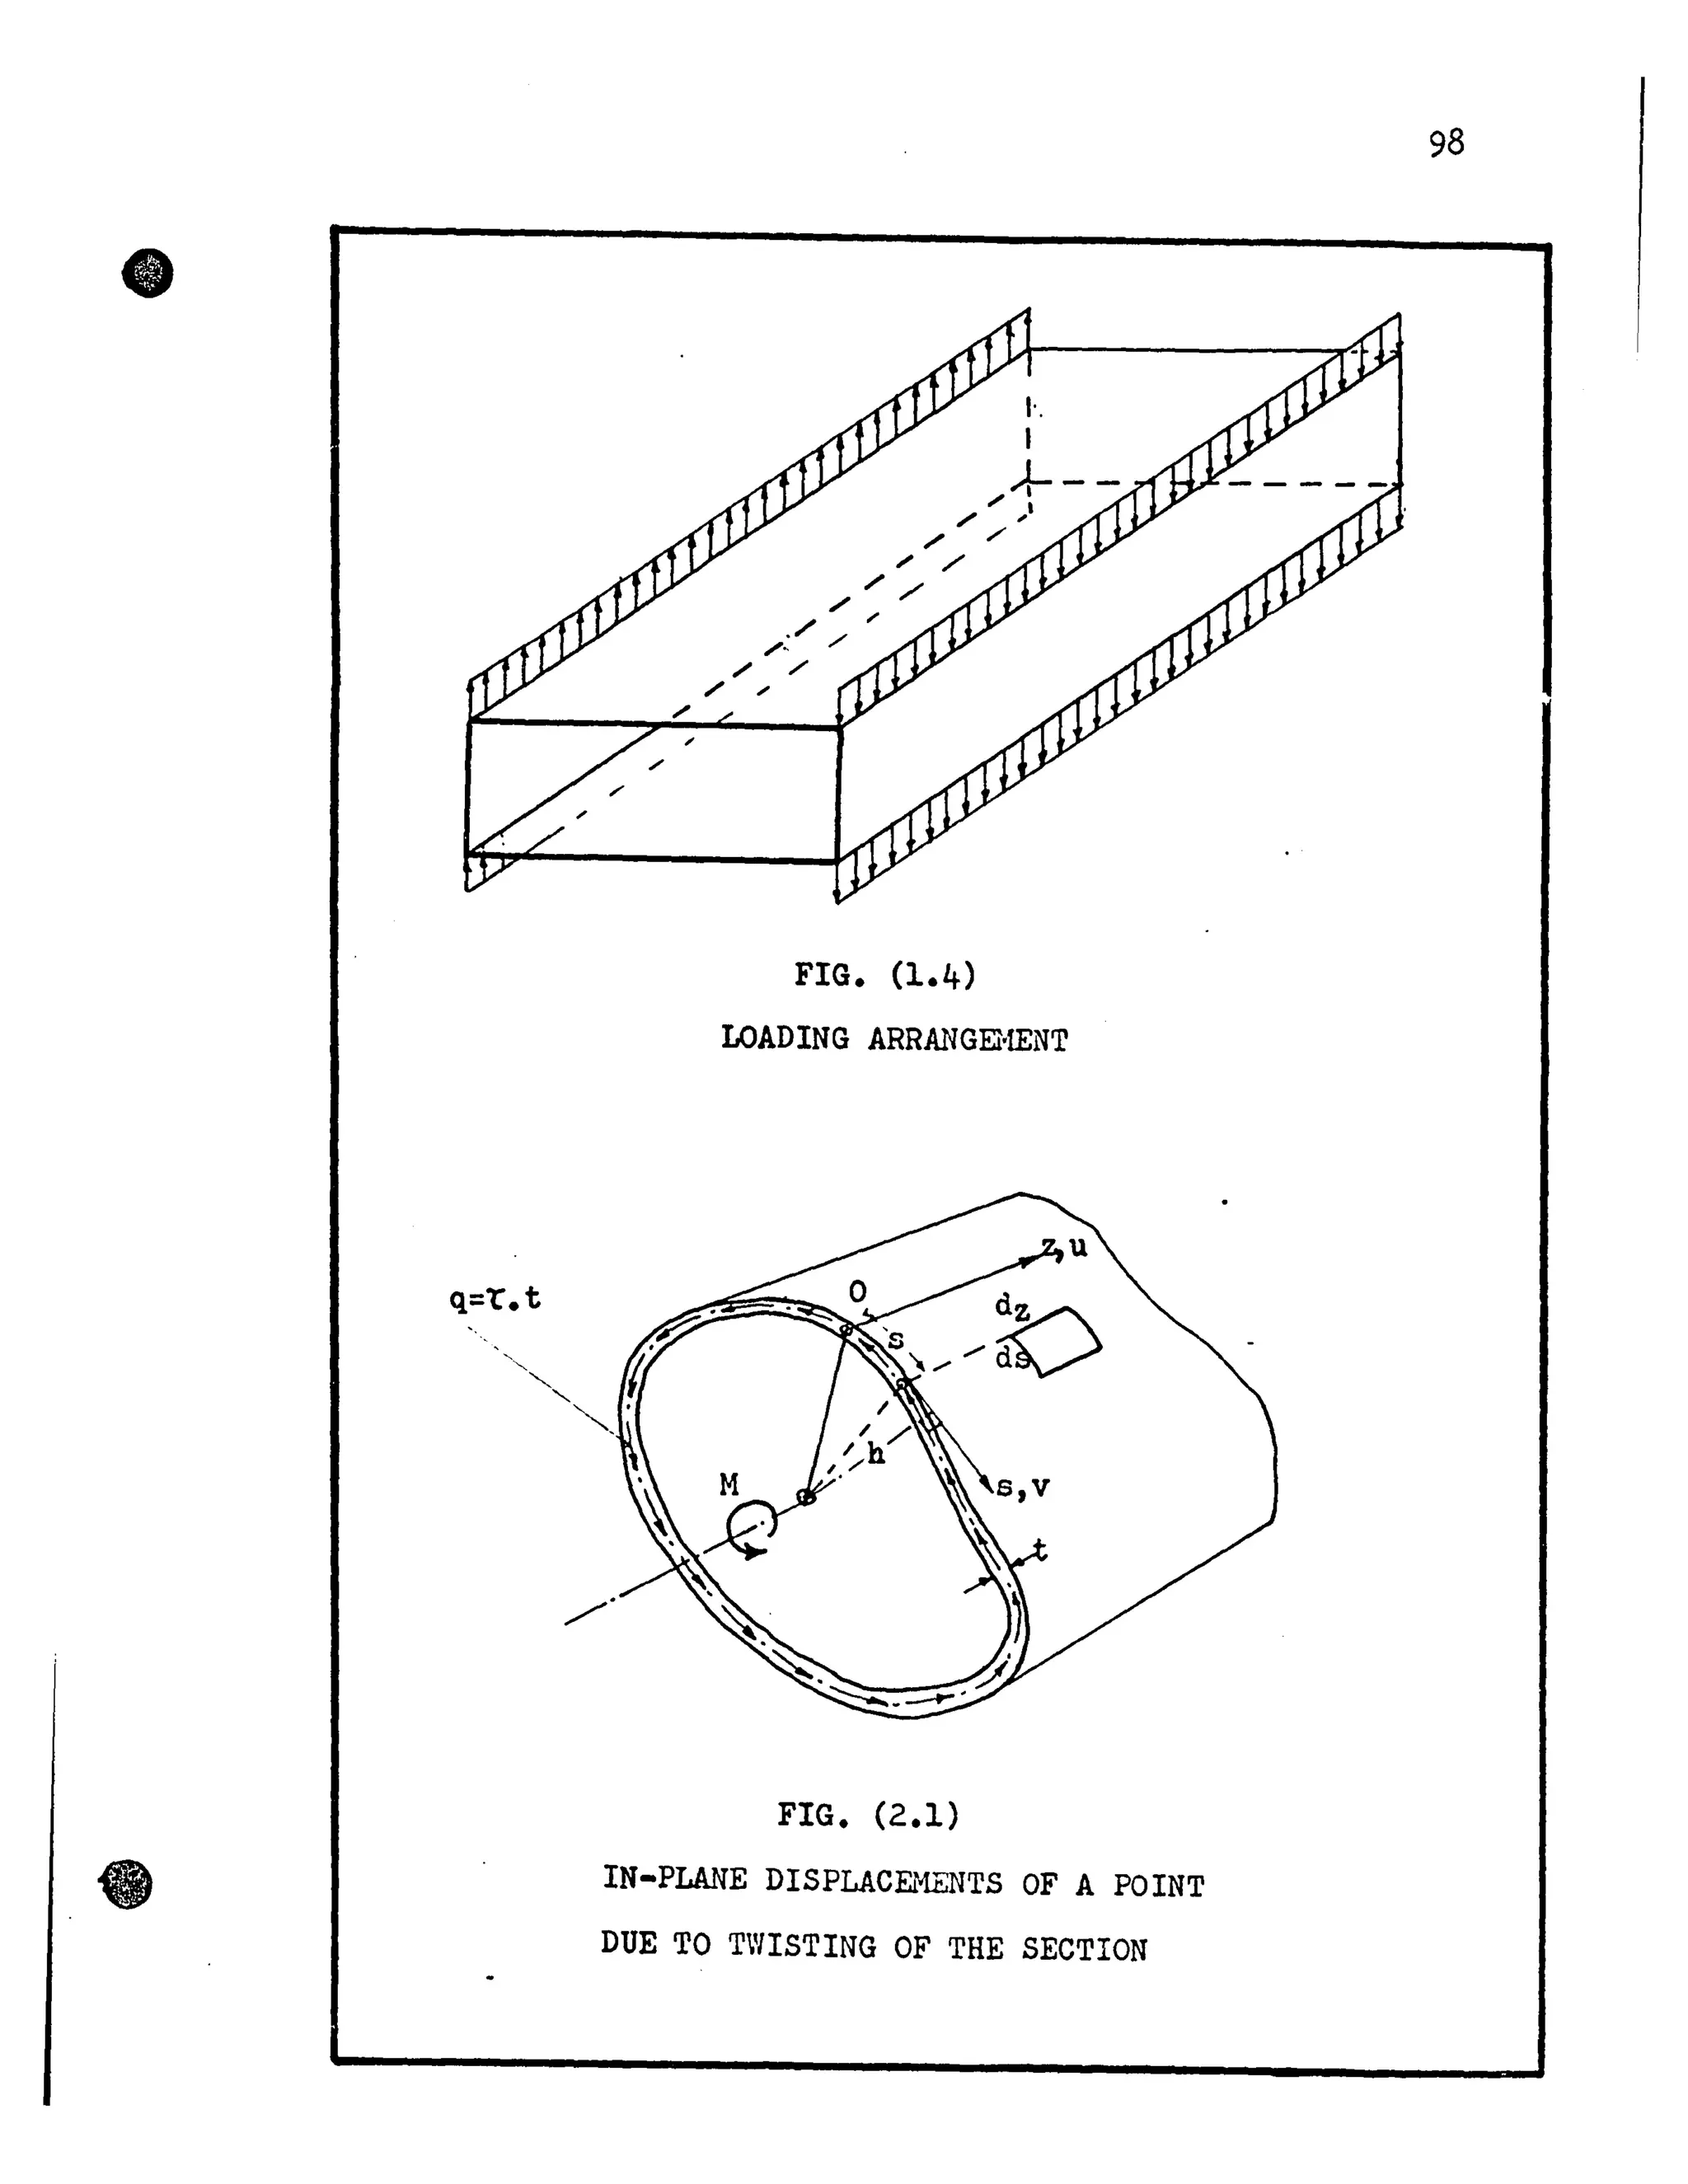
FIG. (4.1)
IDEALIZArrON OF A BOX GI~DE:::! BRIDGE B1 EQUIVALE:;T
GR ID~JOJK MW PLA::E STRESS TRIA;~GULA] ELEME~'irrS
"ex](https://image.slidesharecdn.com/torsionalbehaviourofsinglecellboxgirderbridges-140613171733-phpapp01/75/Torsional-behaviour-of-single-cell-box-girder-bridges-124-2048.jpg)
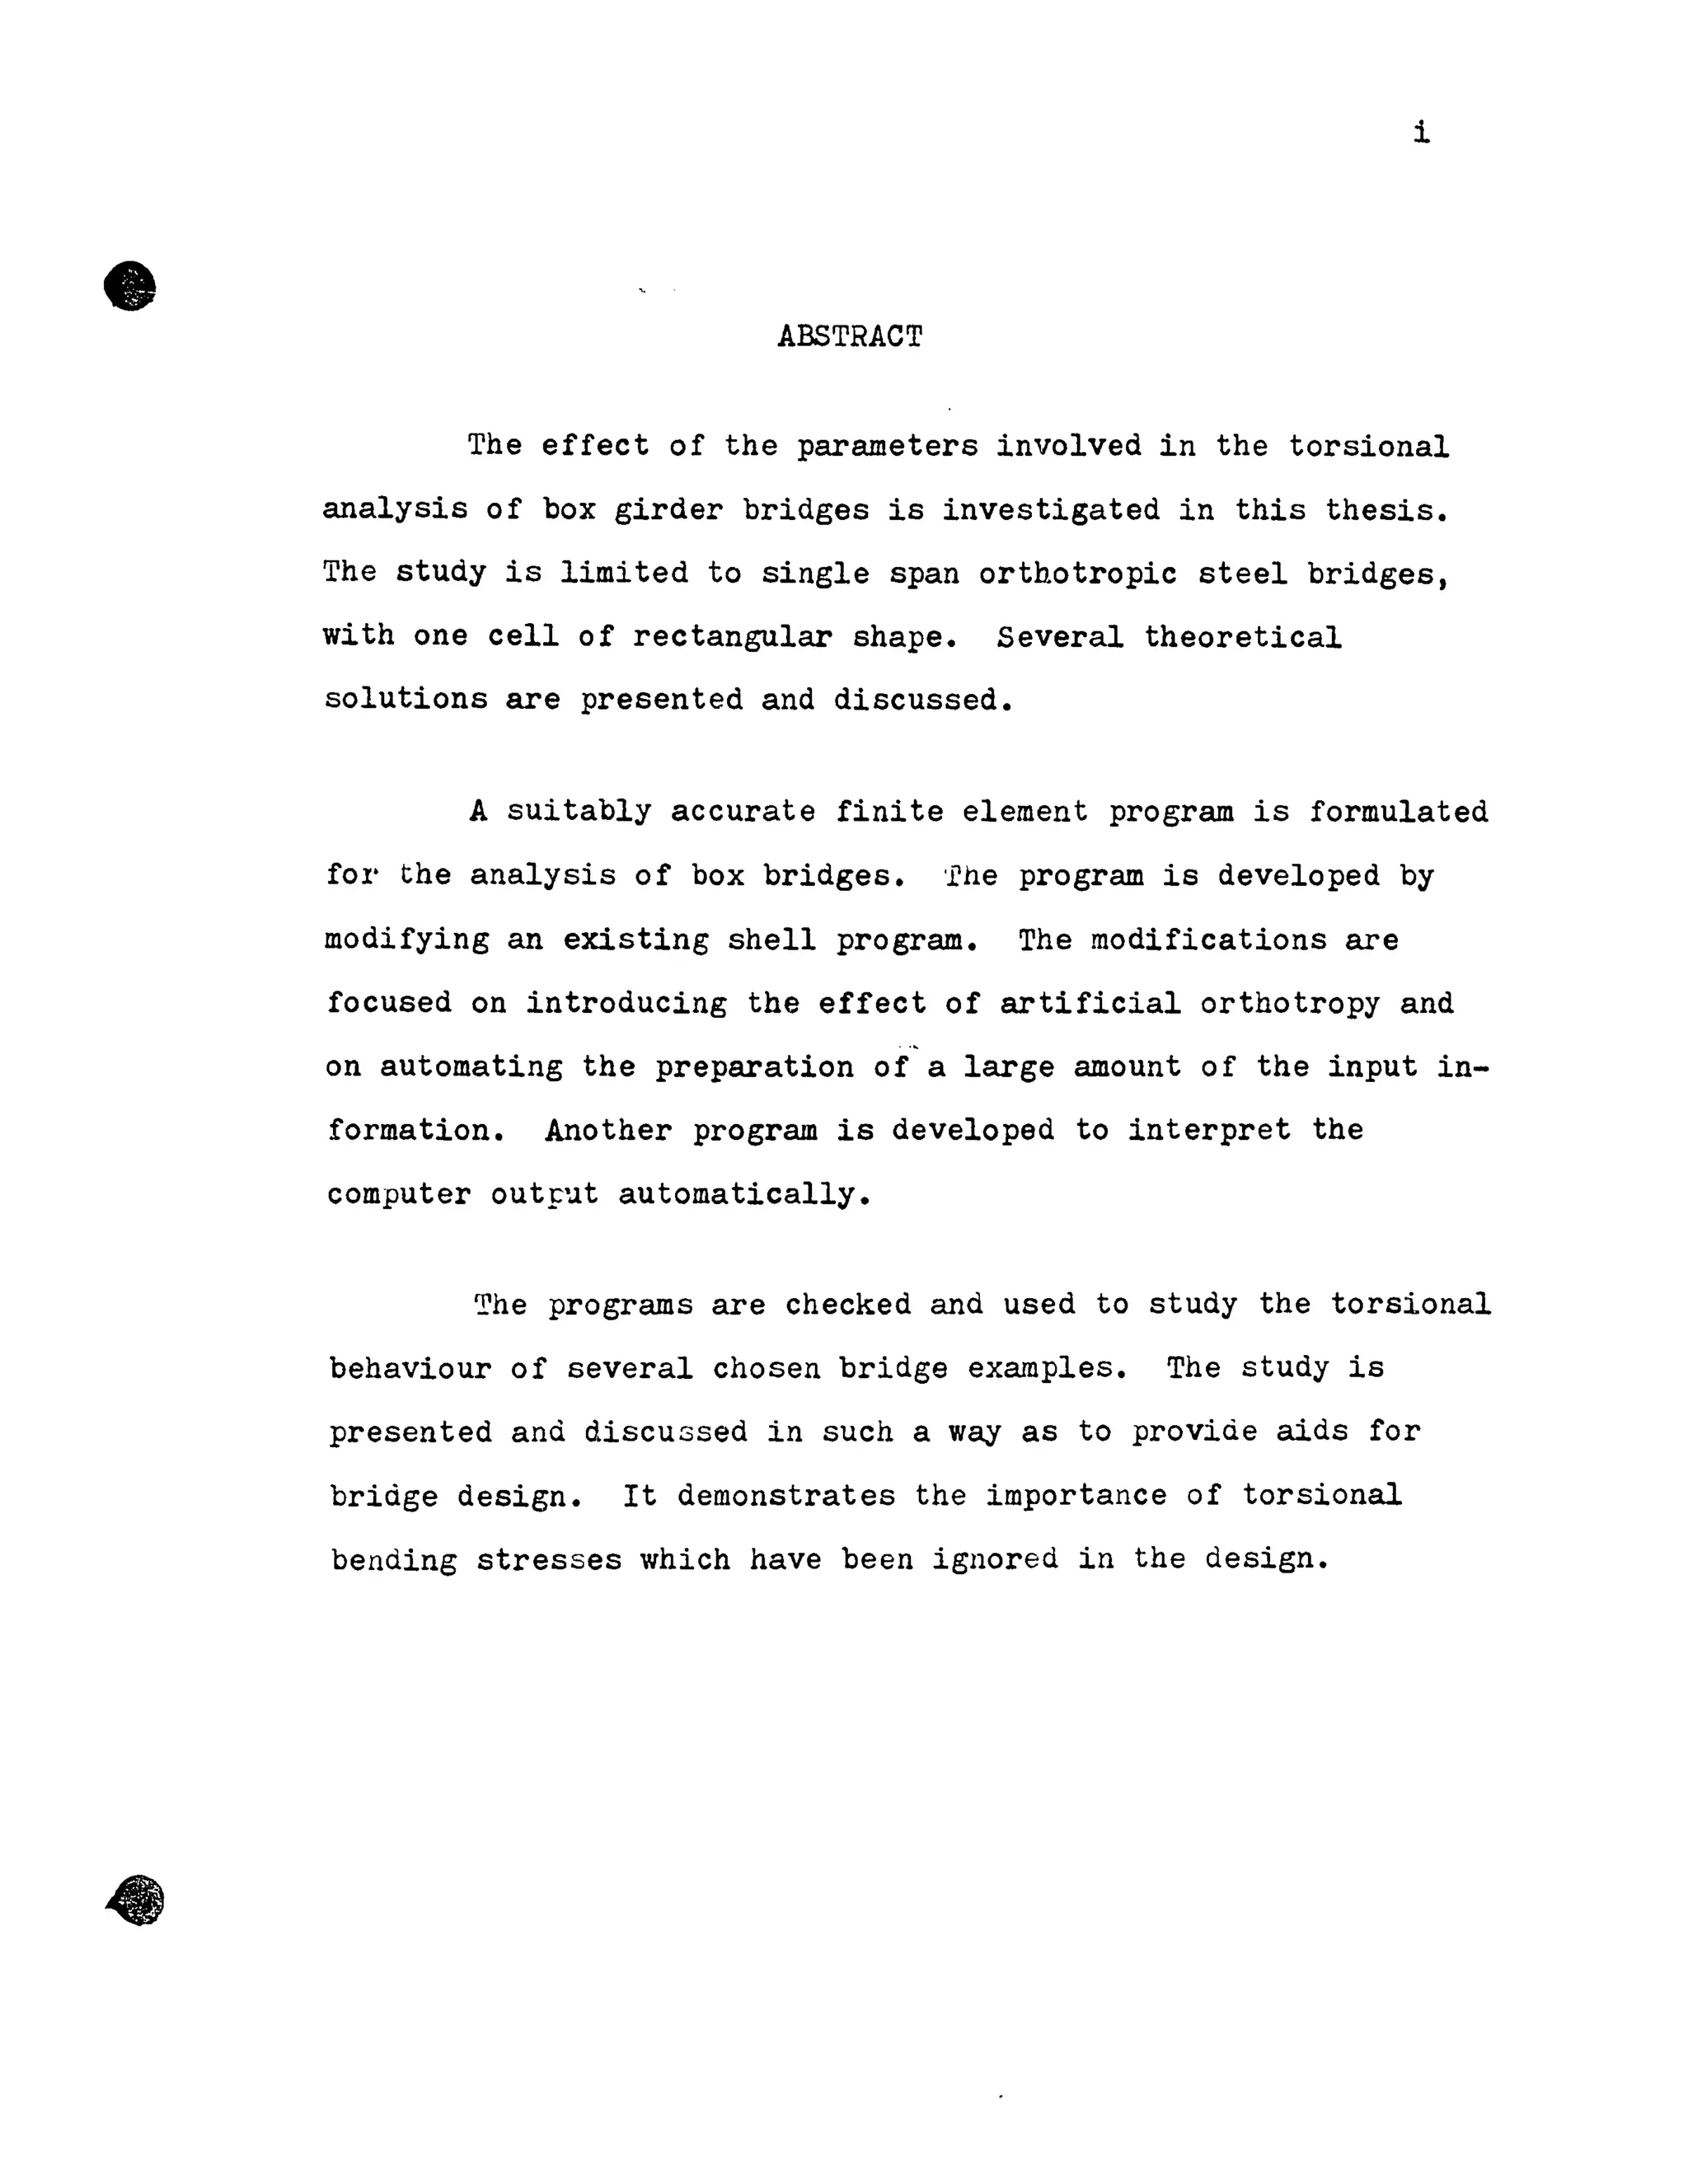
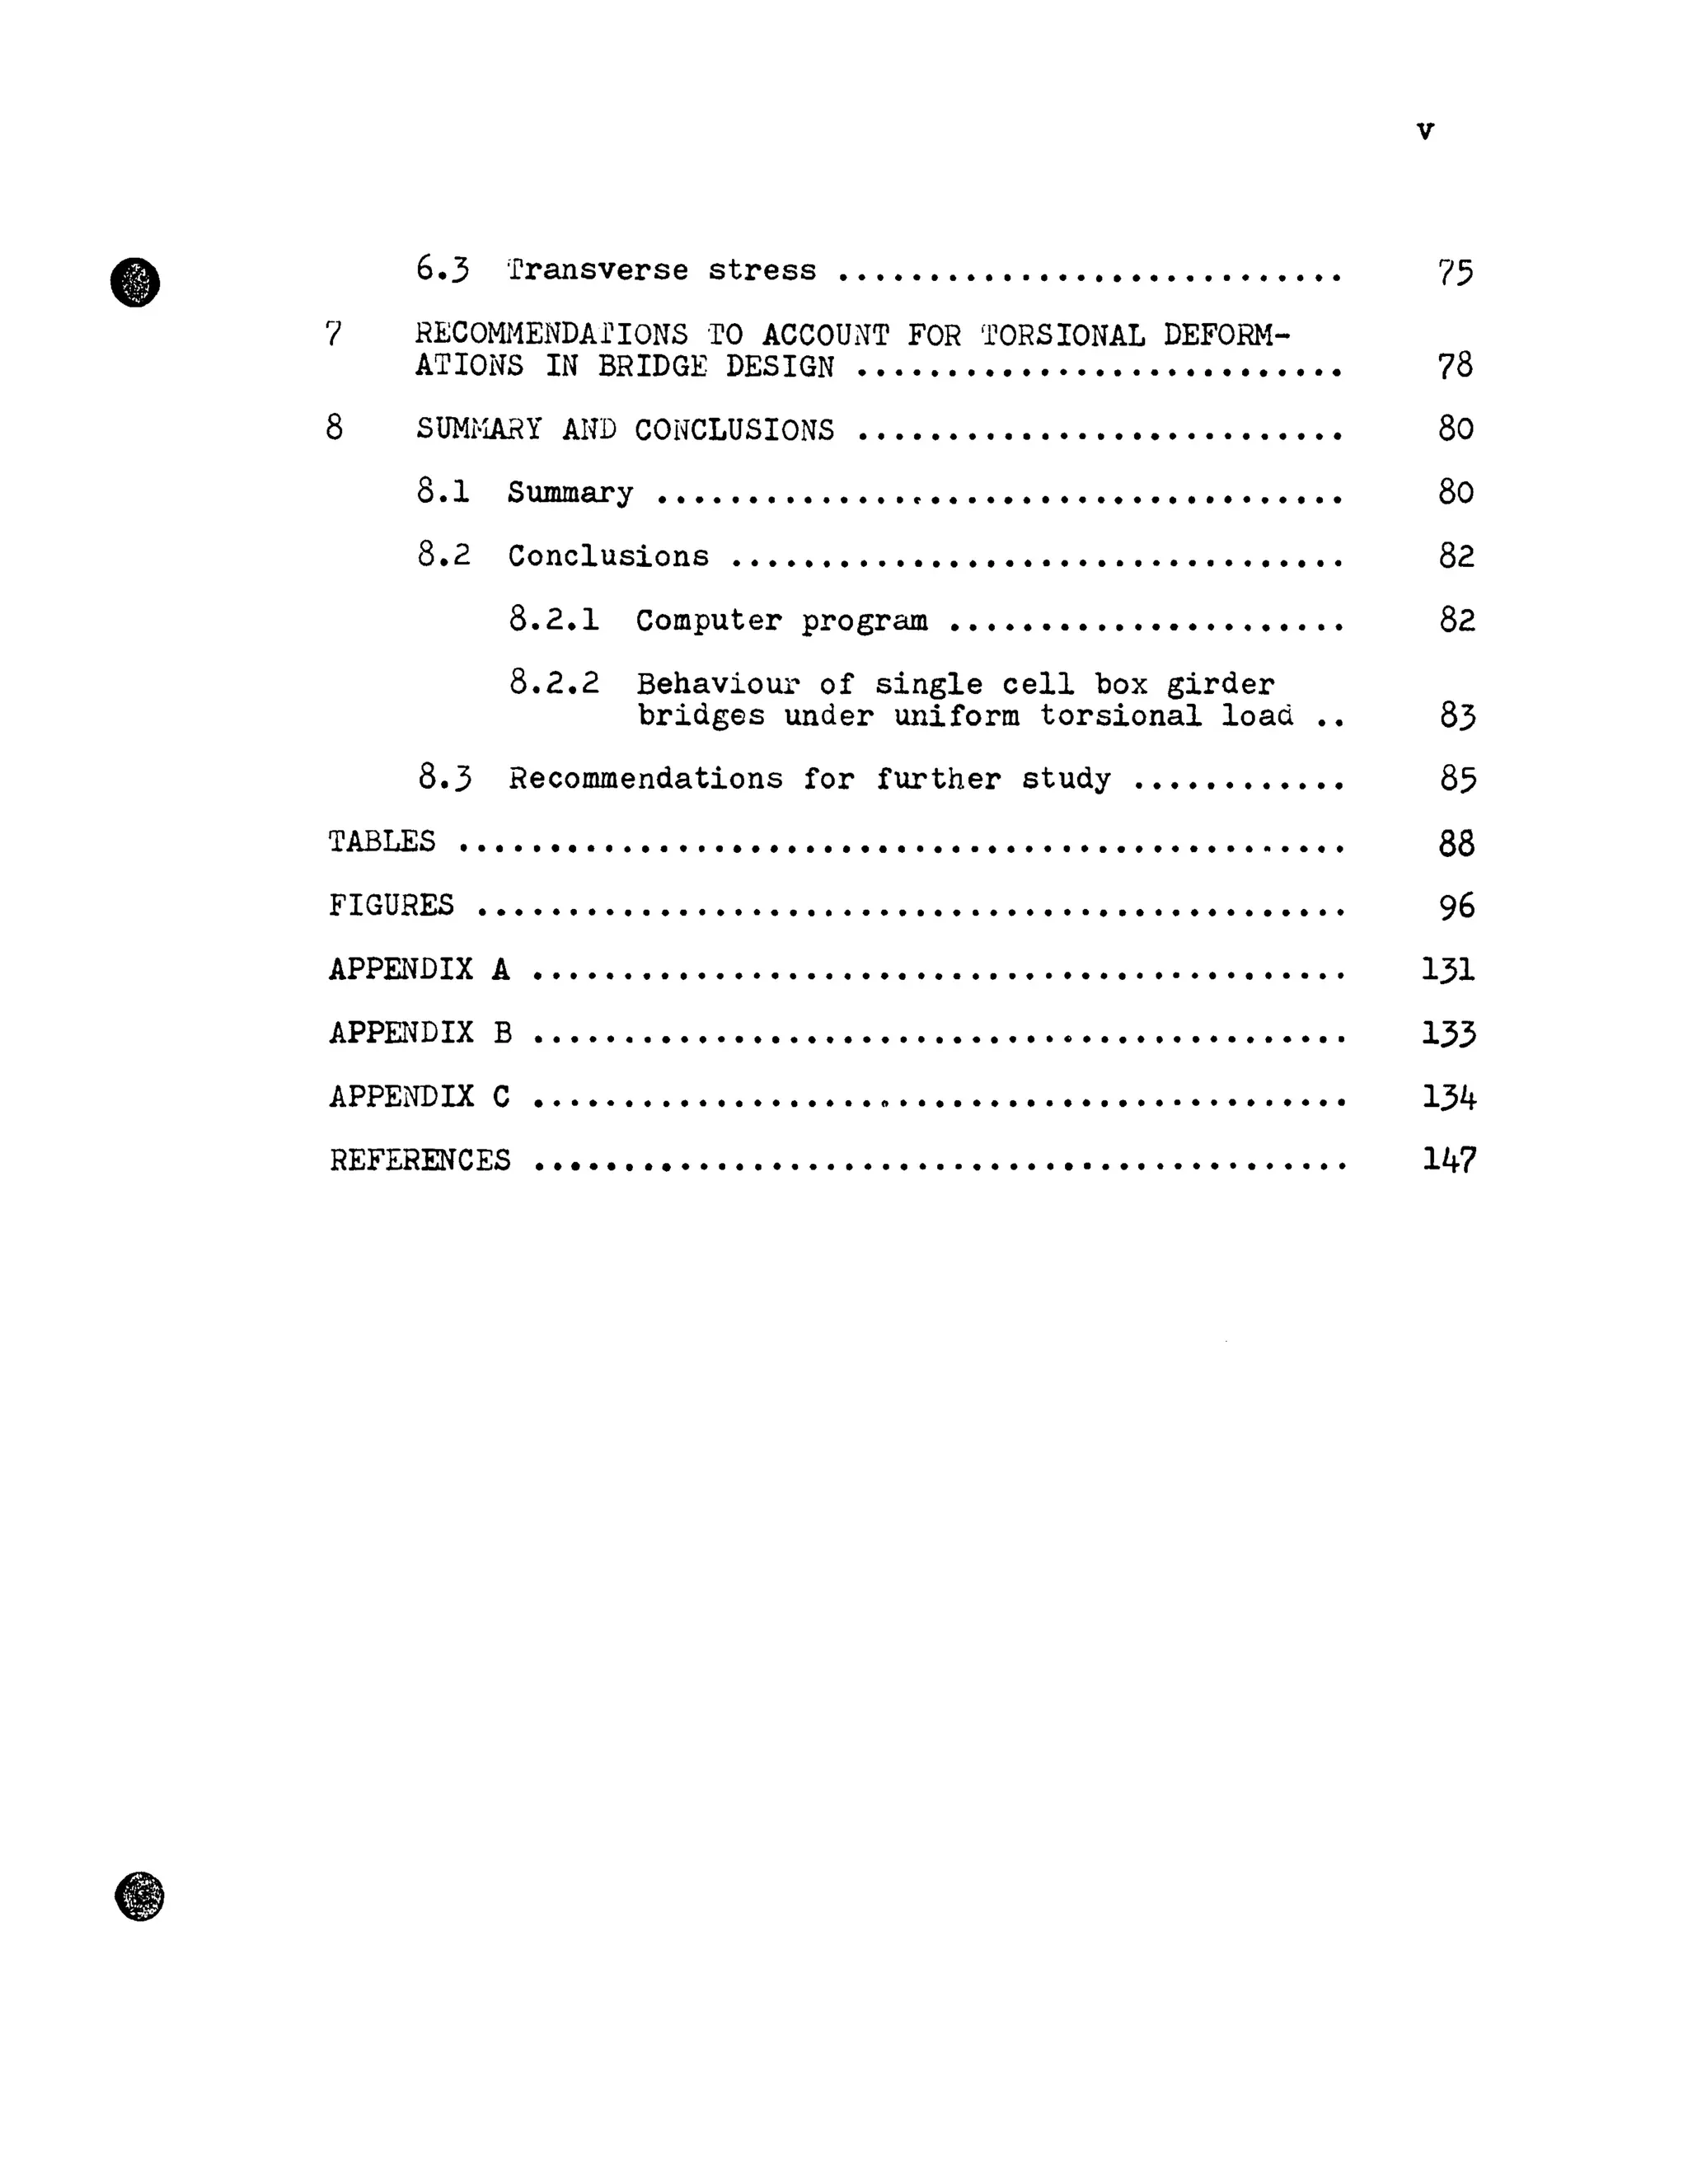
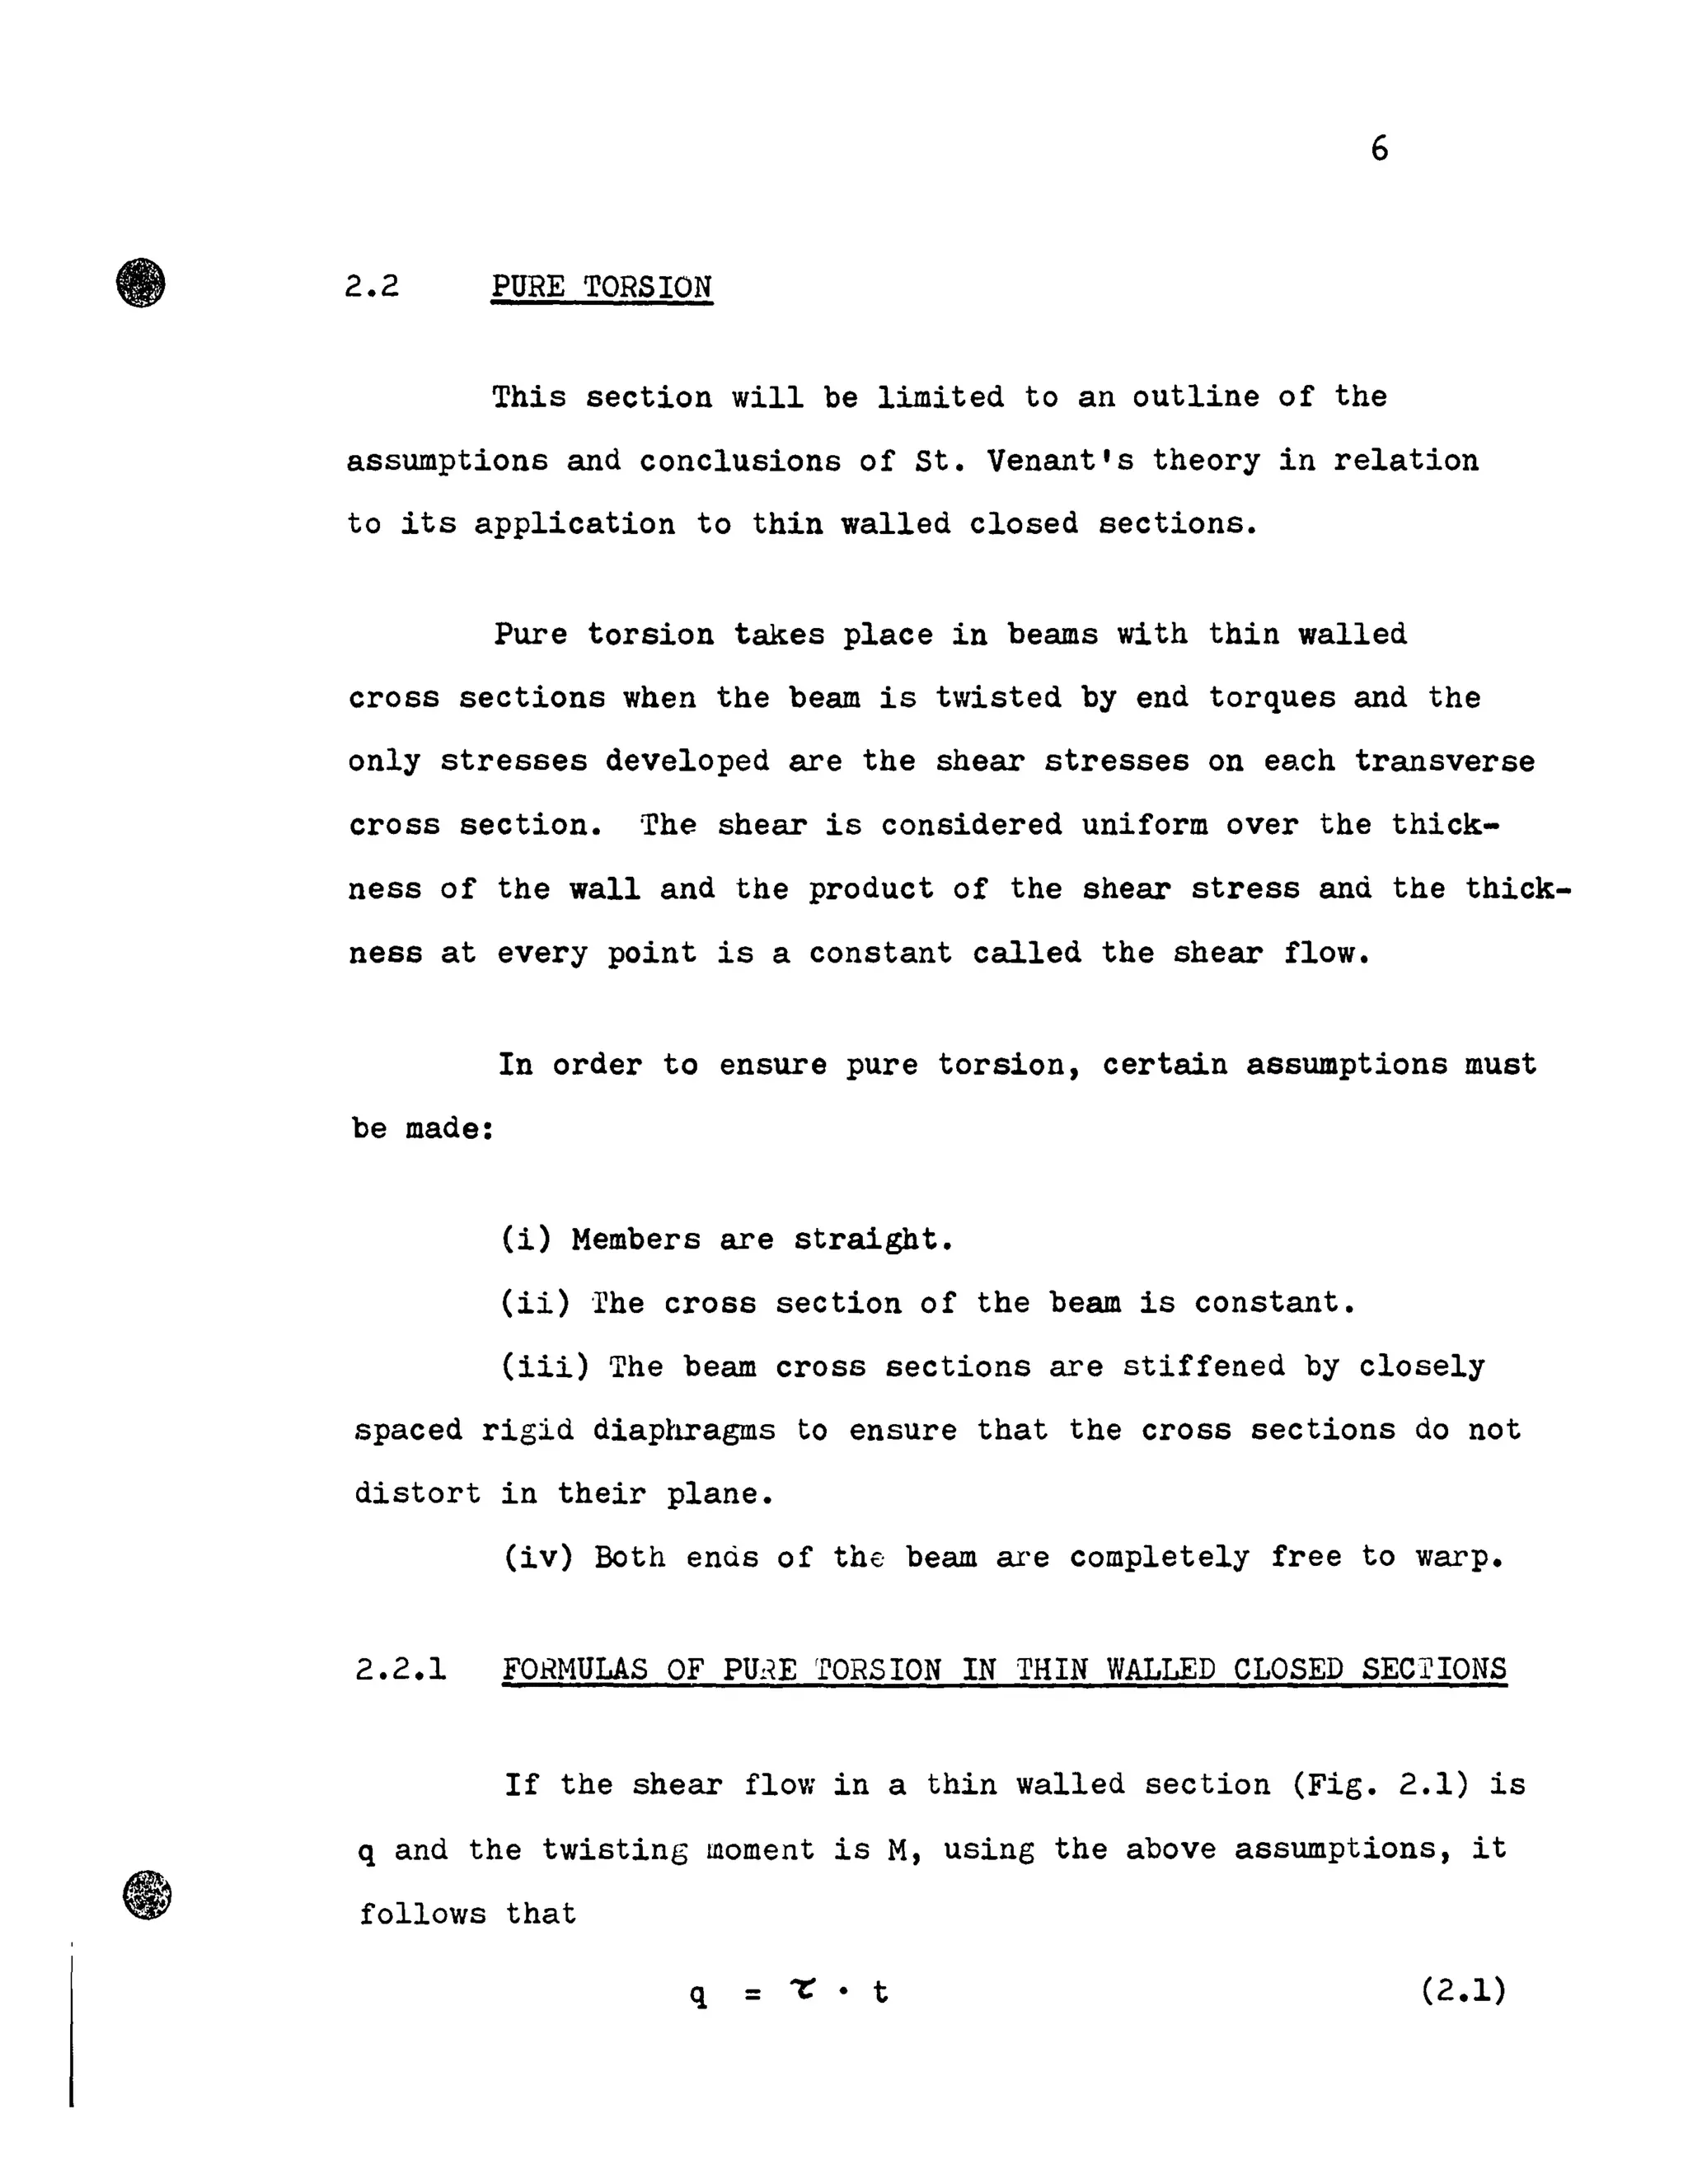
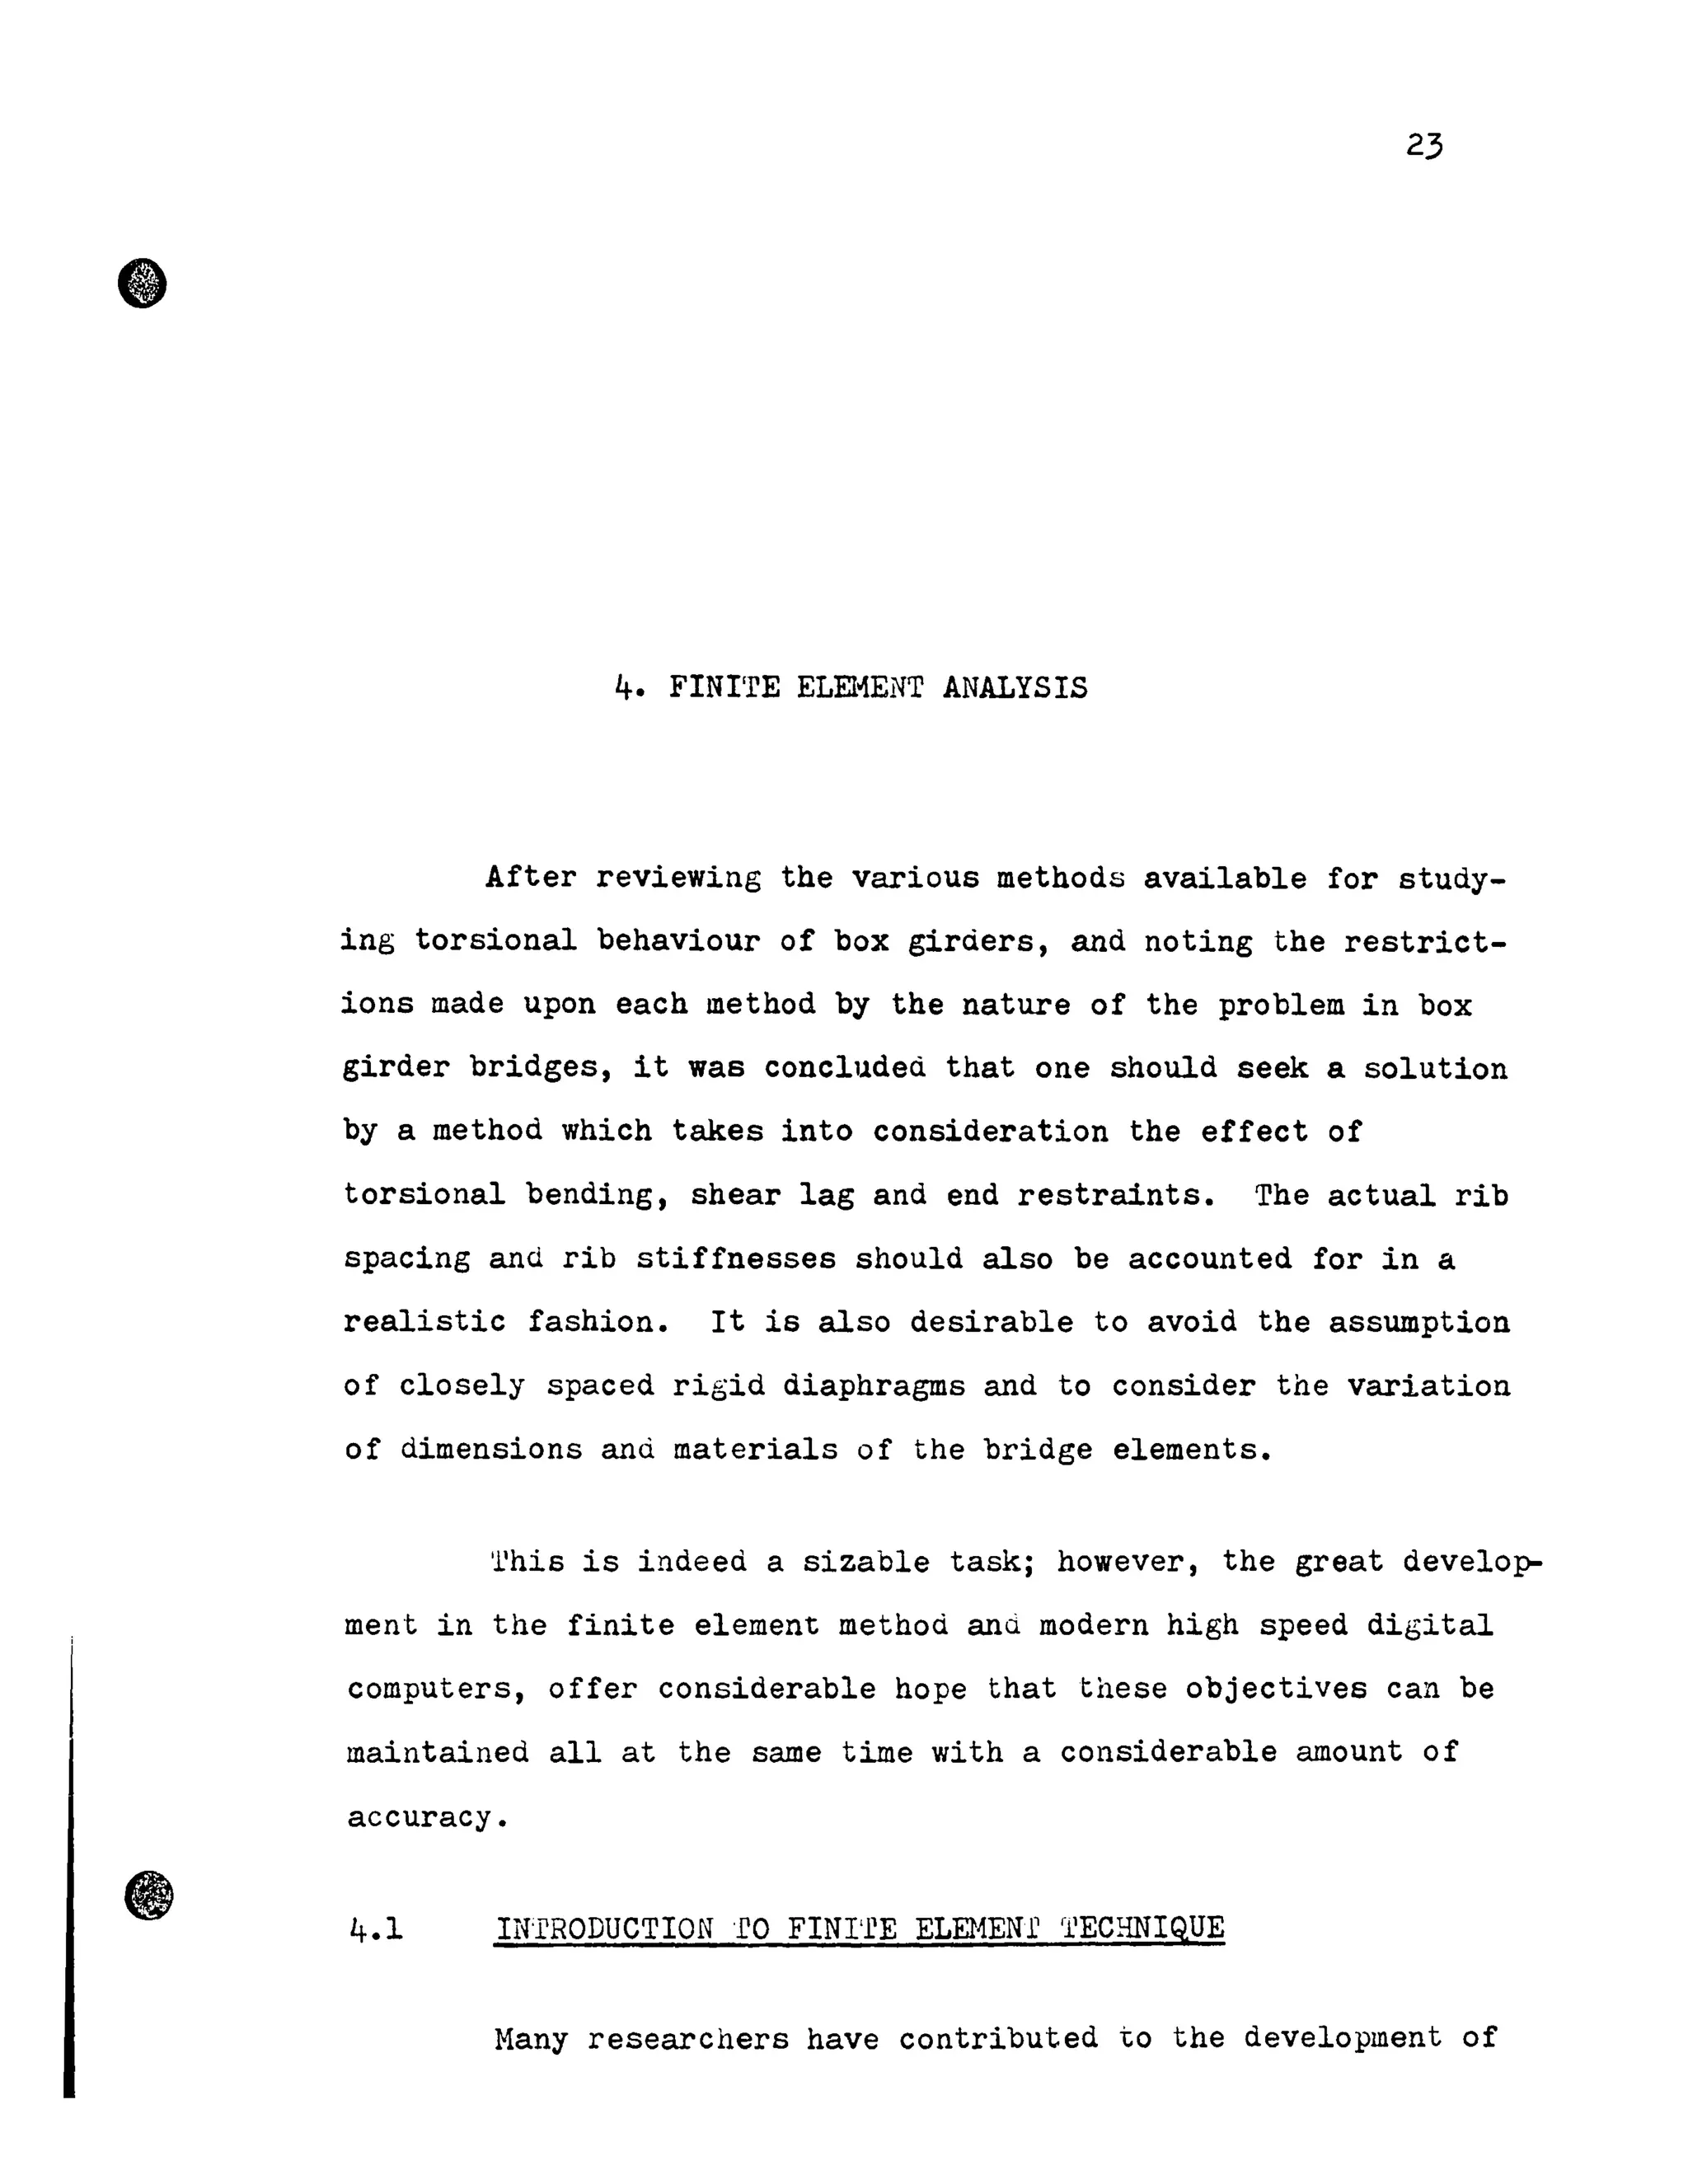
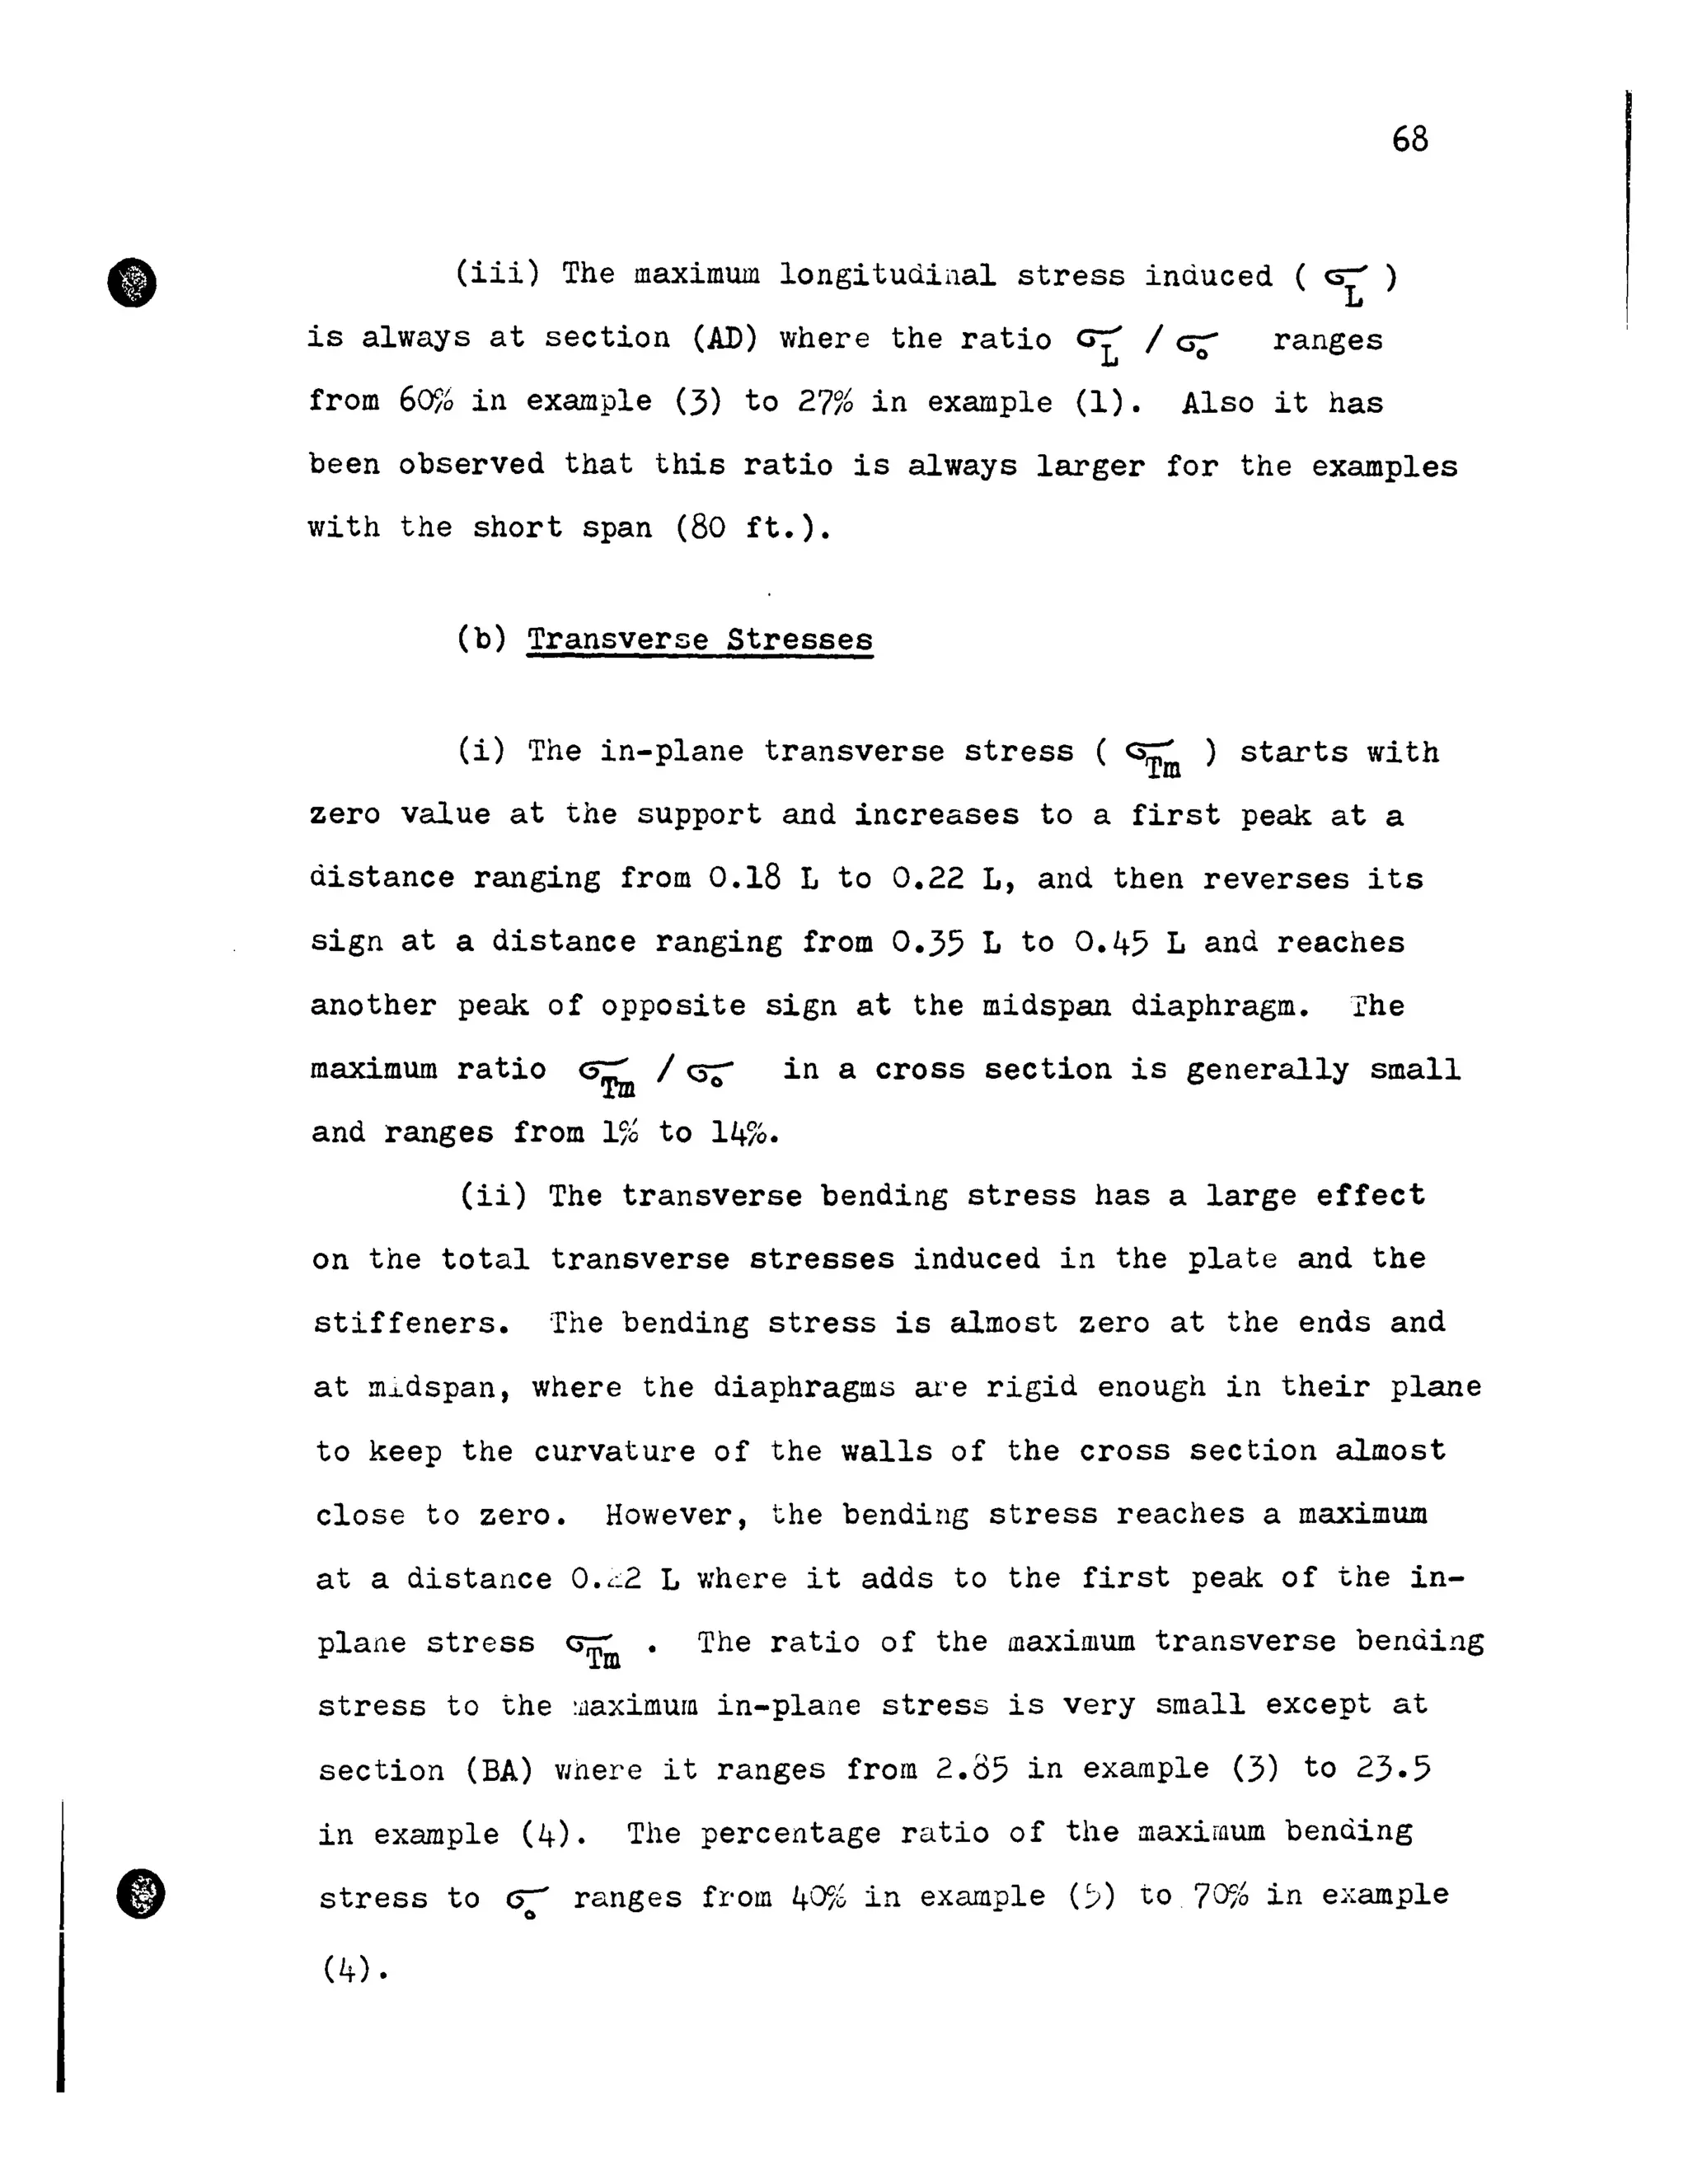
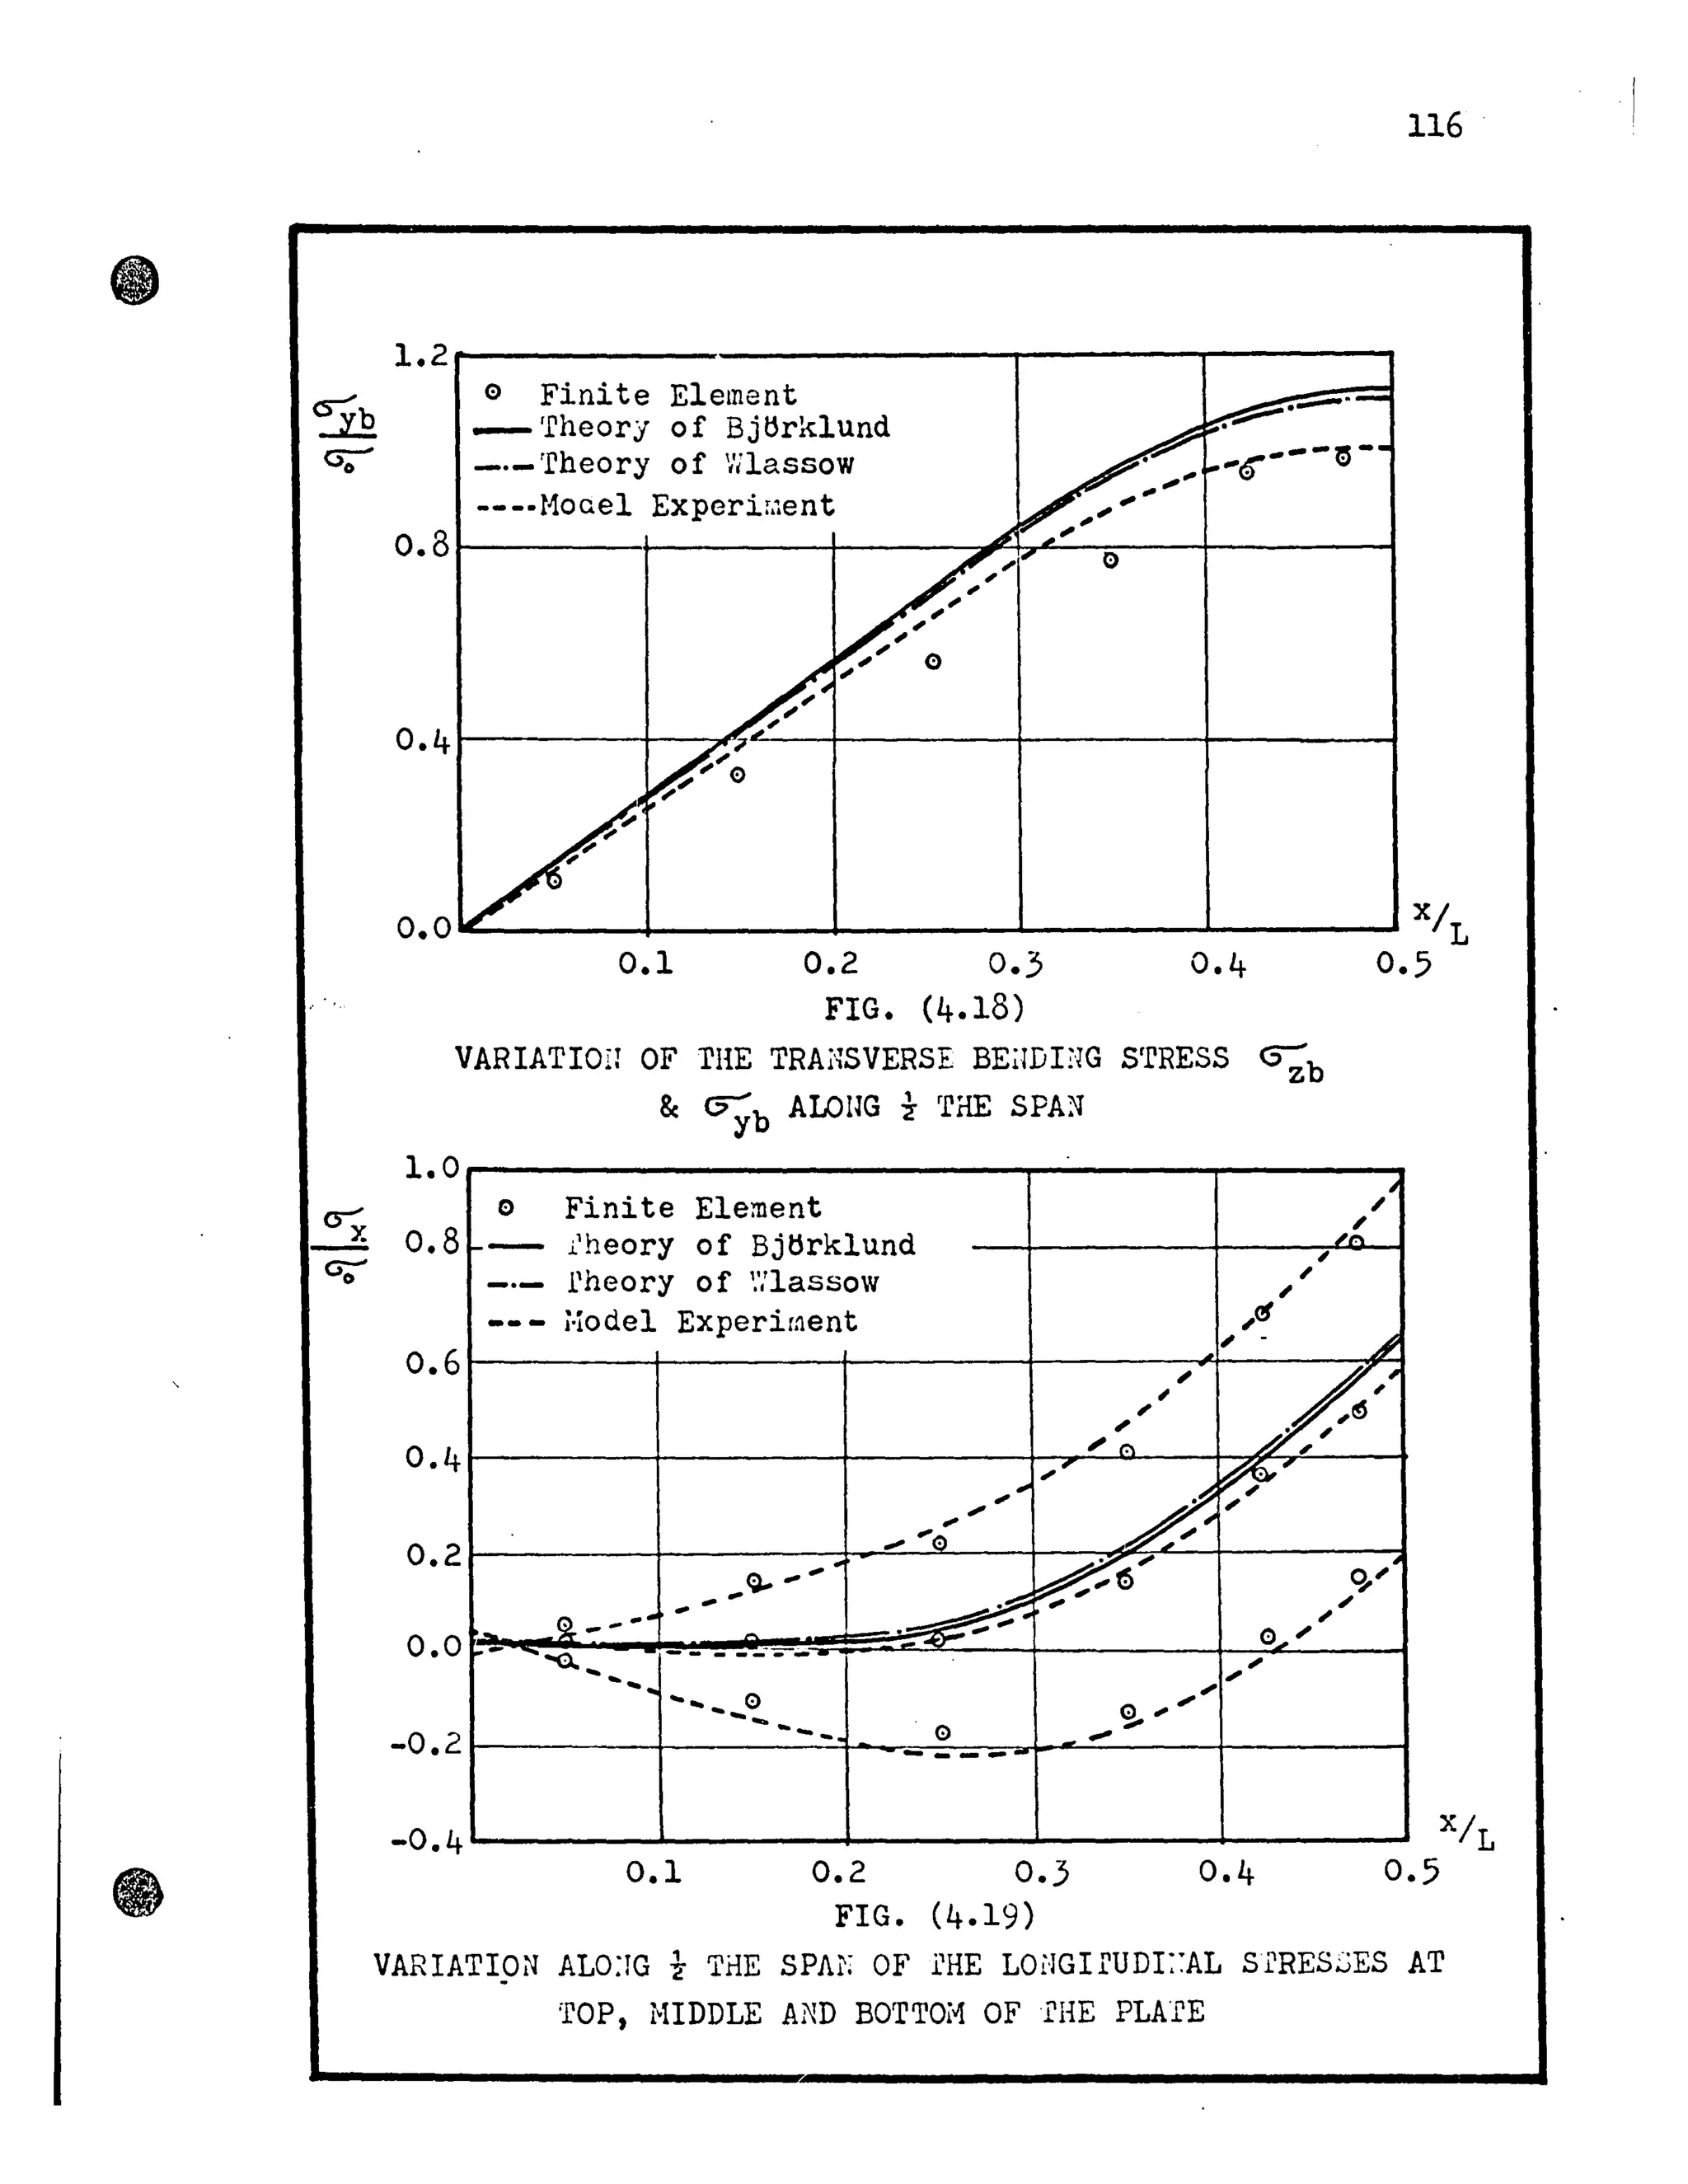
![c 0.8
Oz
byo
C:) Finite Element
- Theory 0 f Bjtlrk und
_._ Theory of '::lasl;:i W
----Mode1 Experimen
115
0.4~------+-------~~~~4-------~------~
0.0
_
~________~________~________~______________________ x/L
0.6
0.2
0.0
0.1 0.2 0.3 0.5
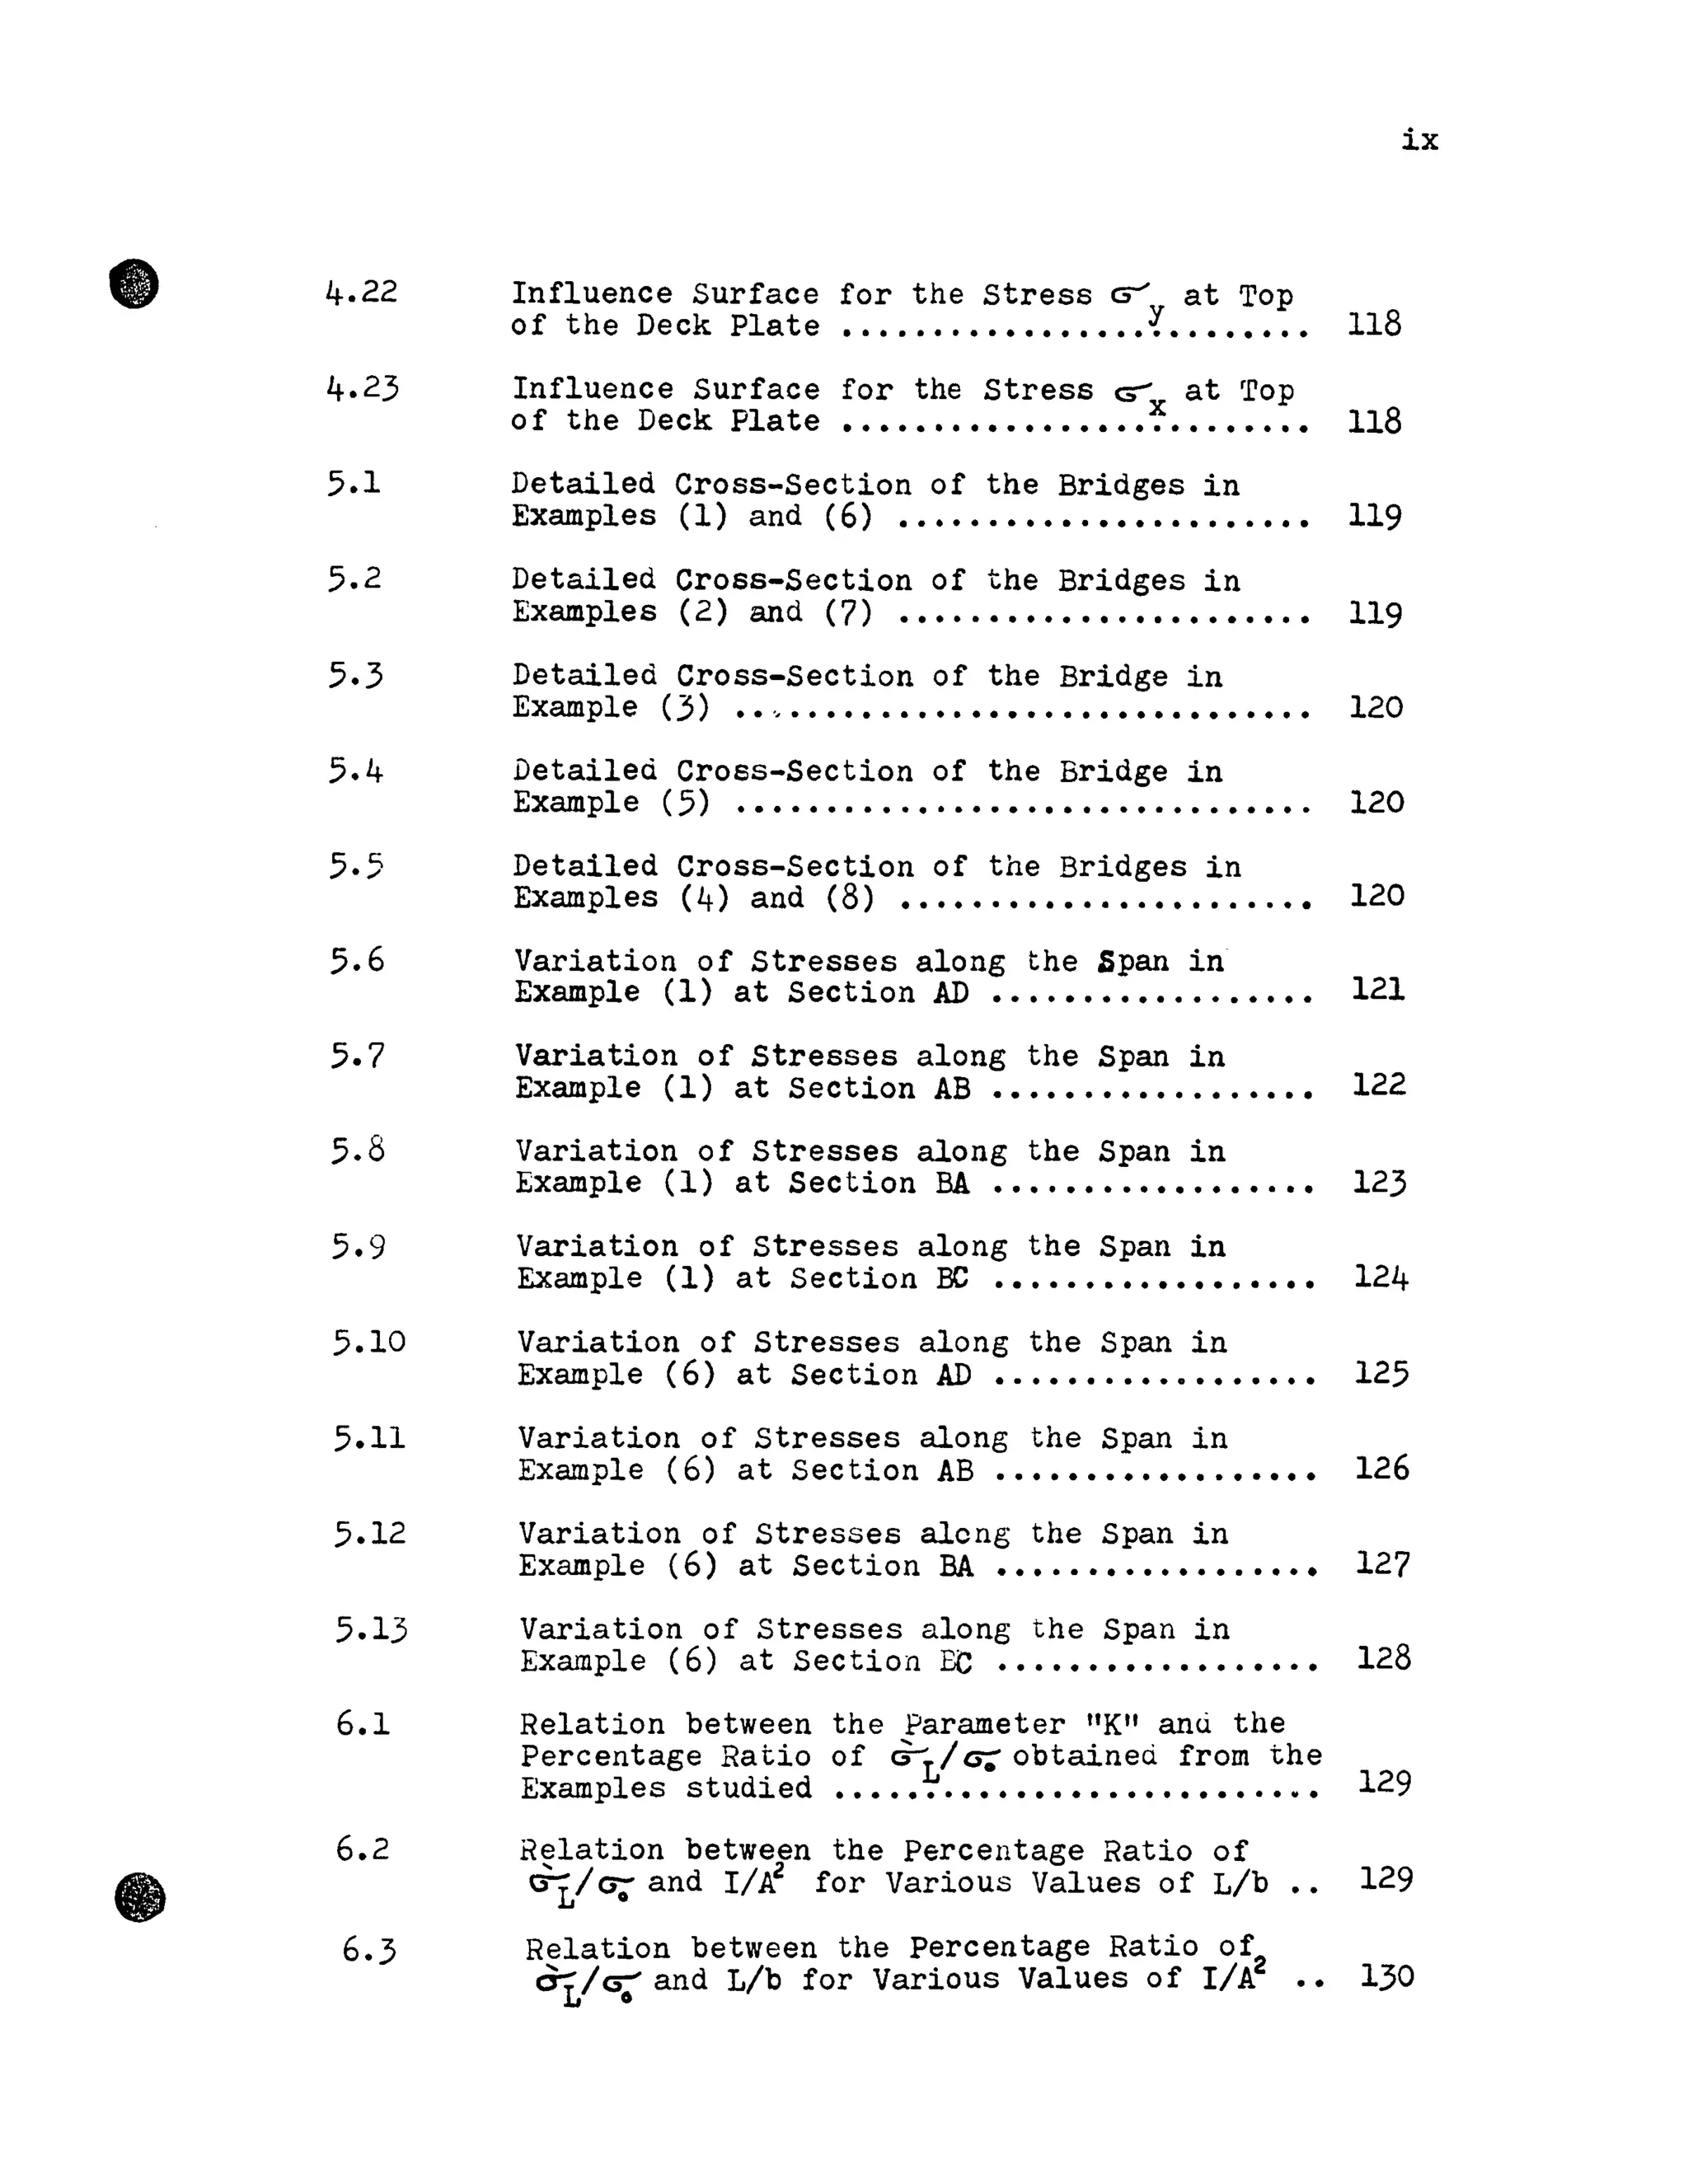
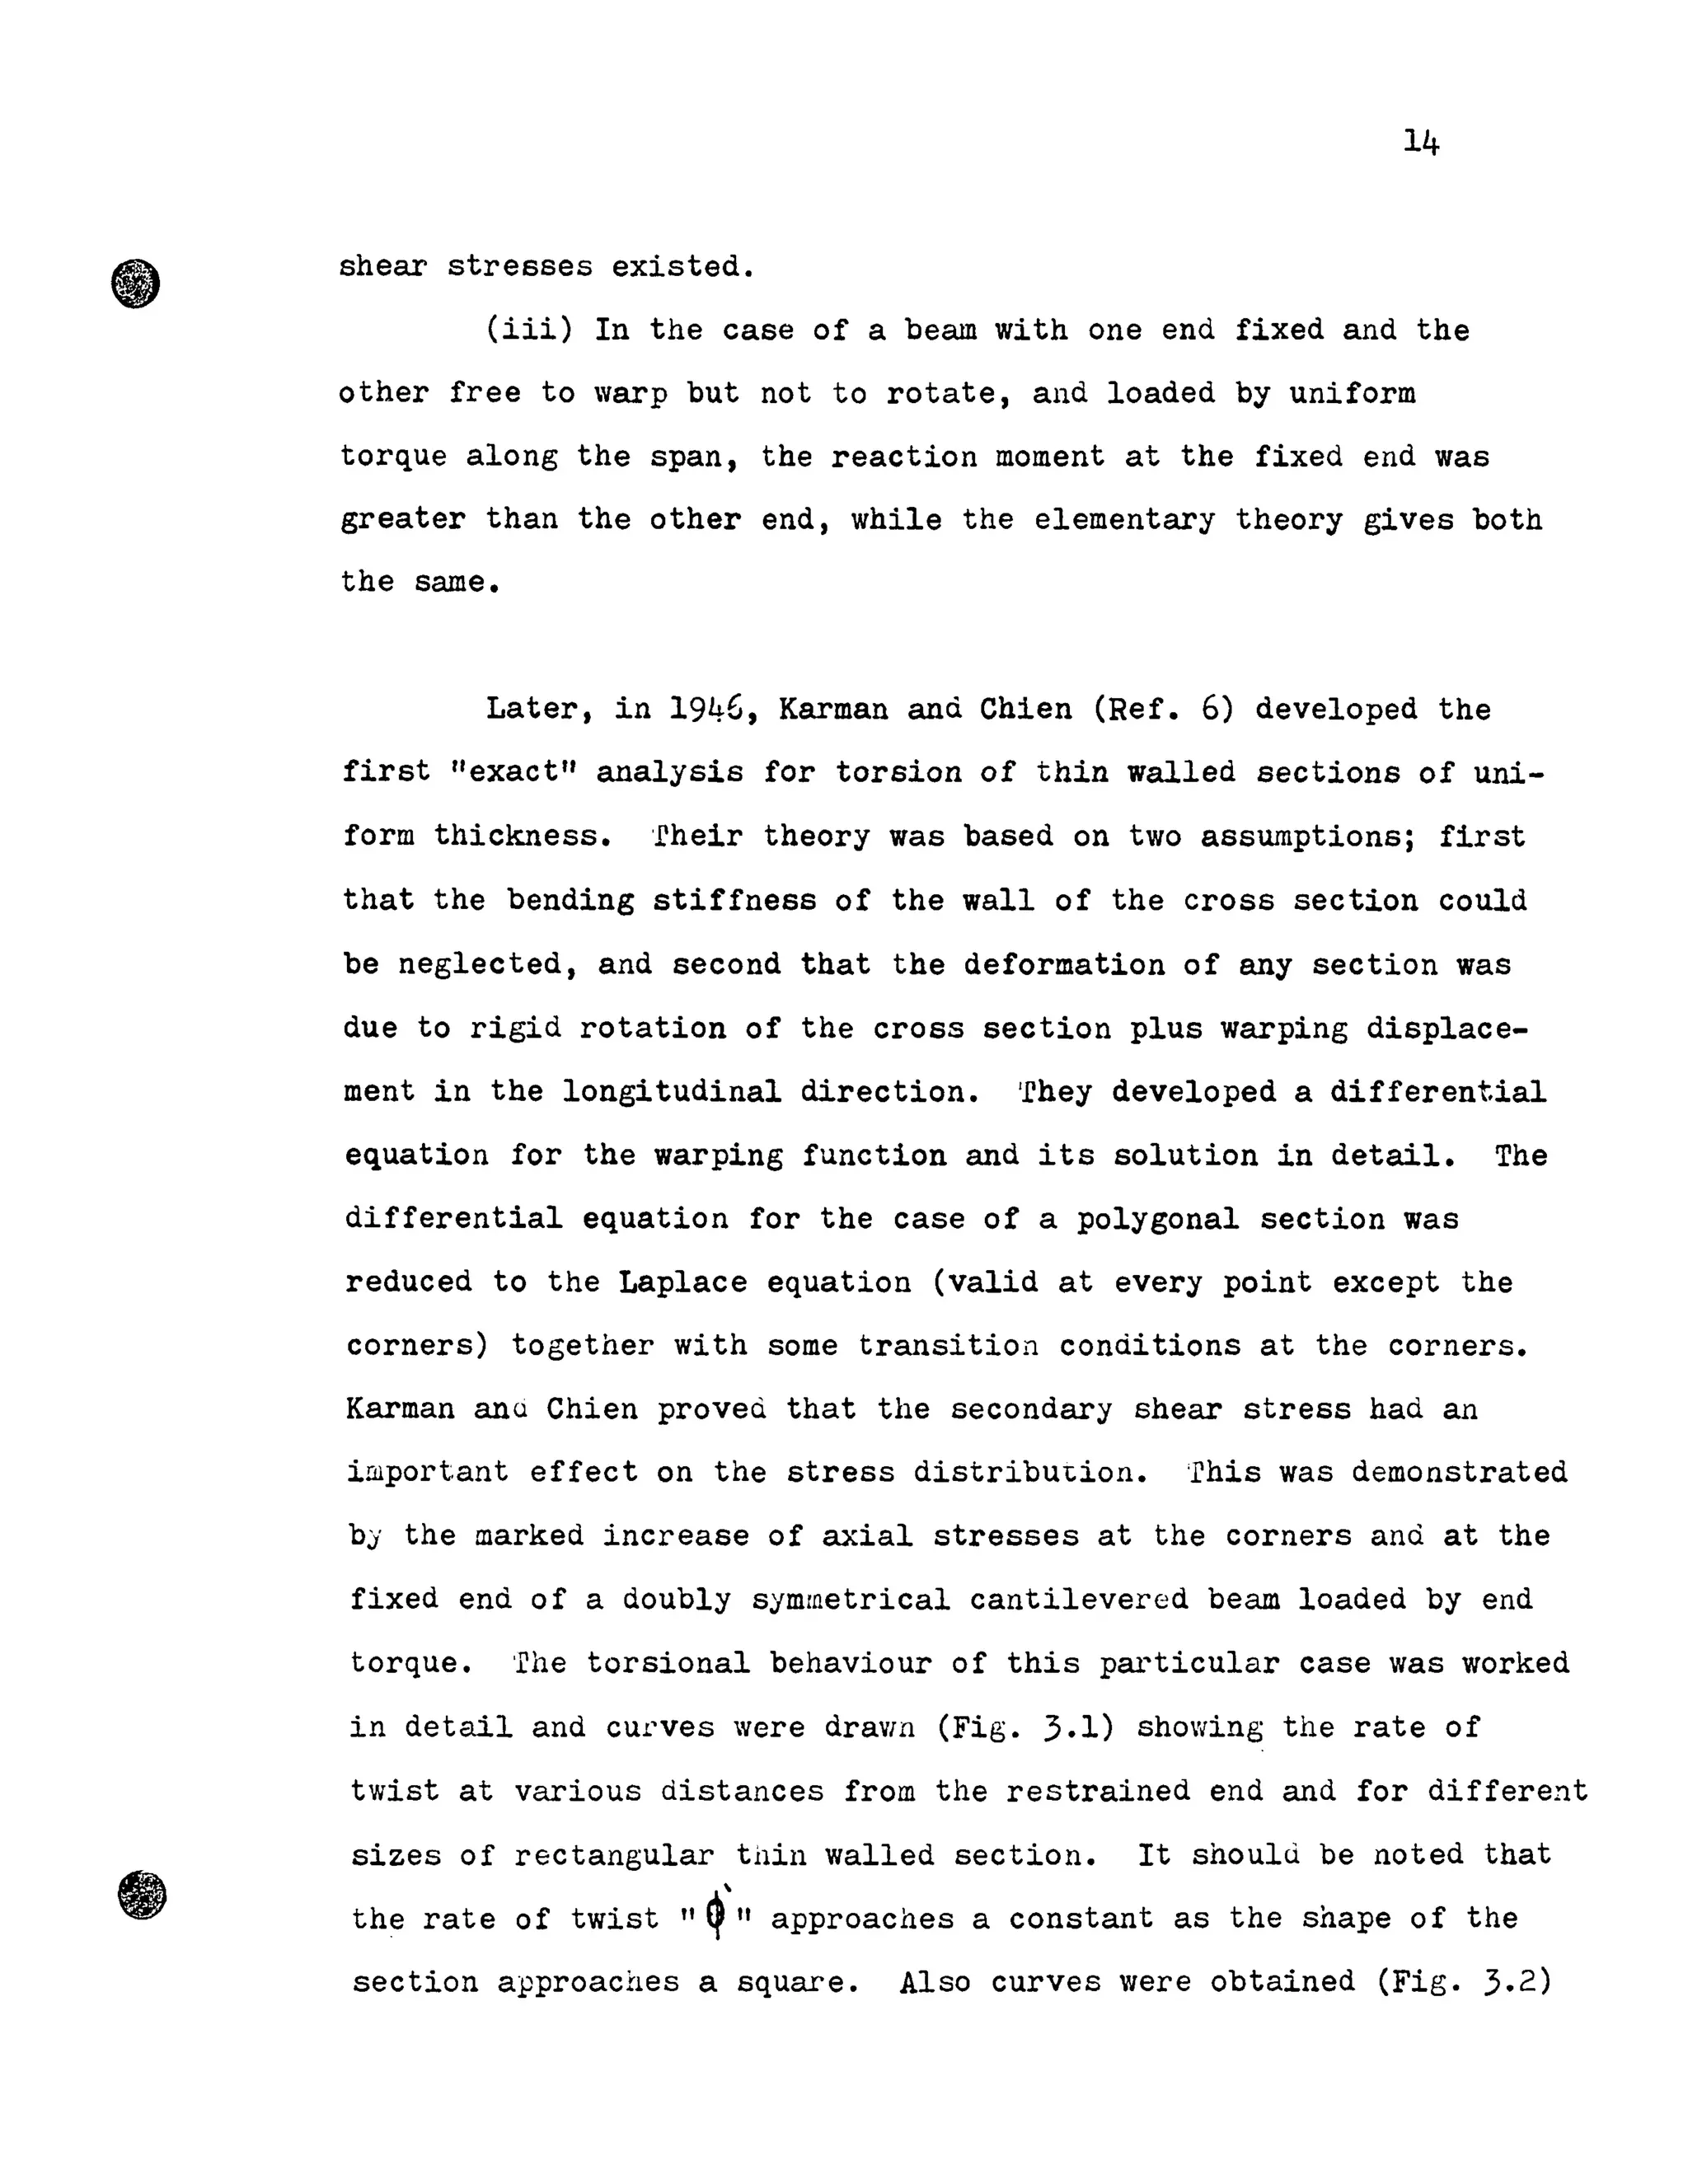
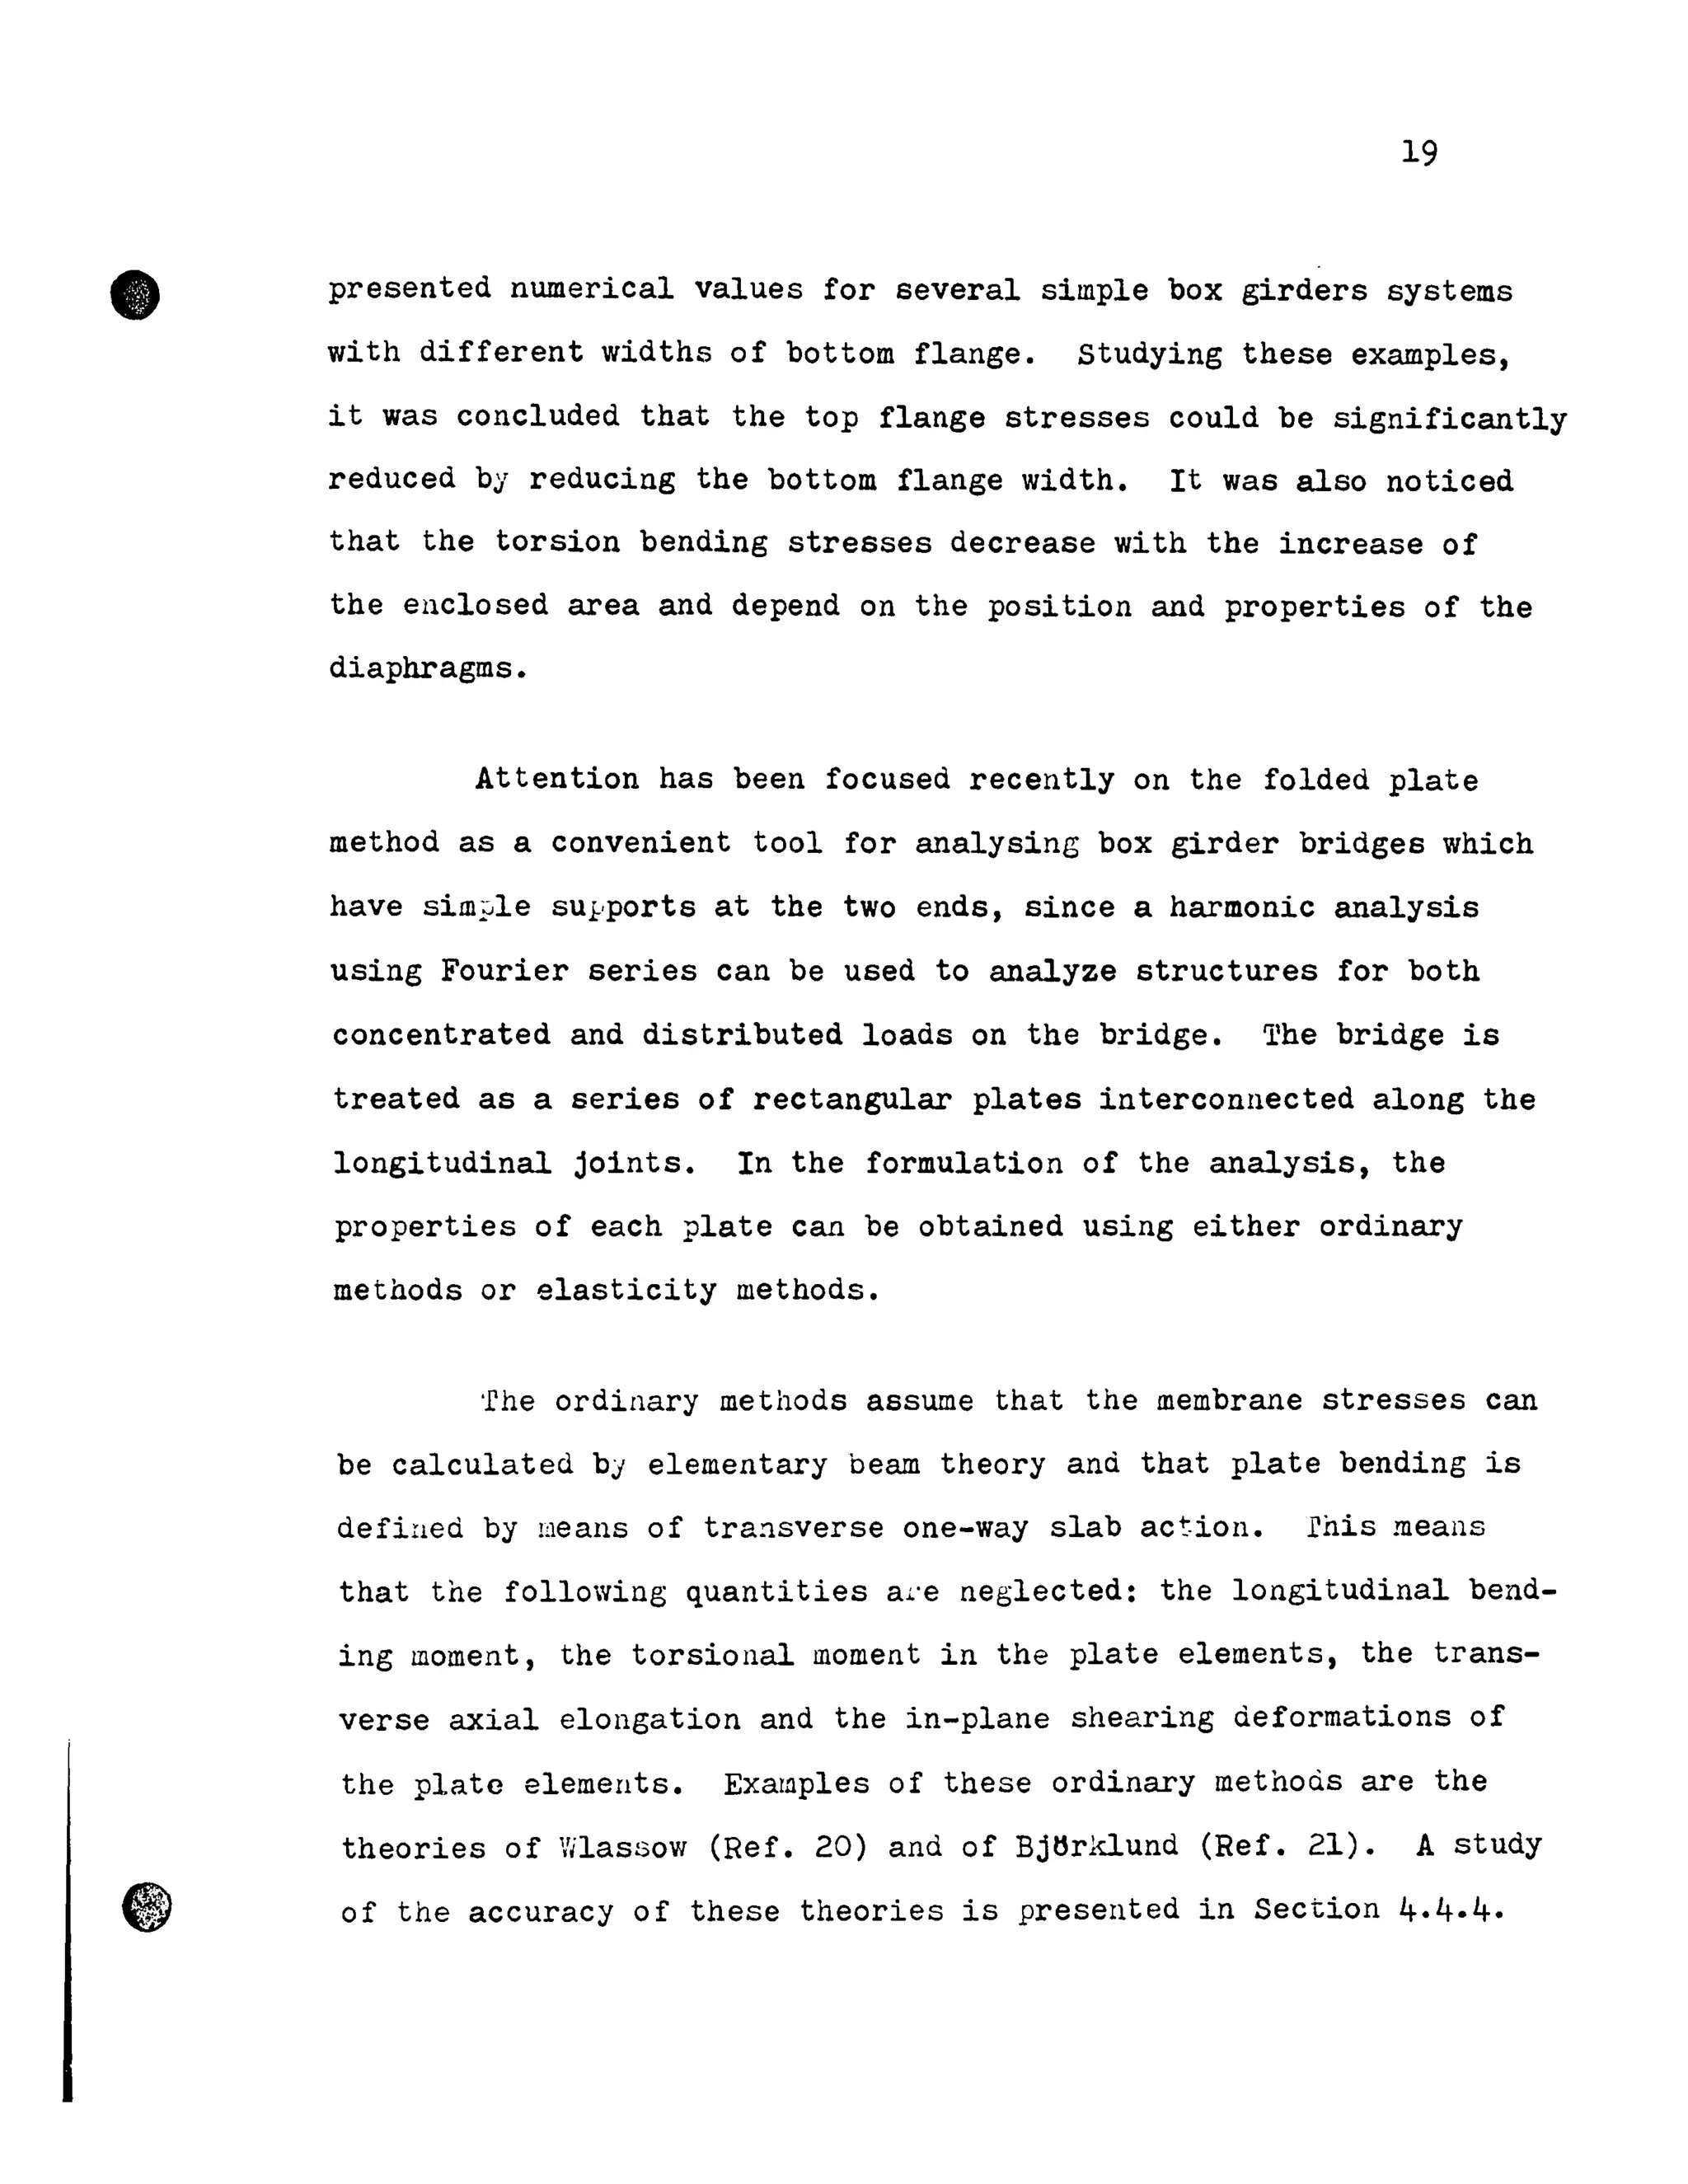
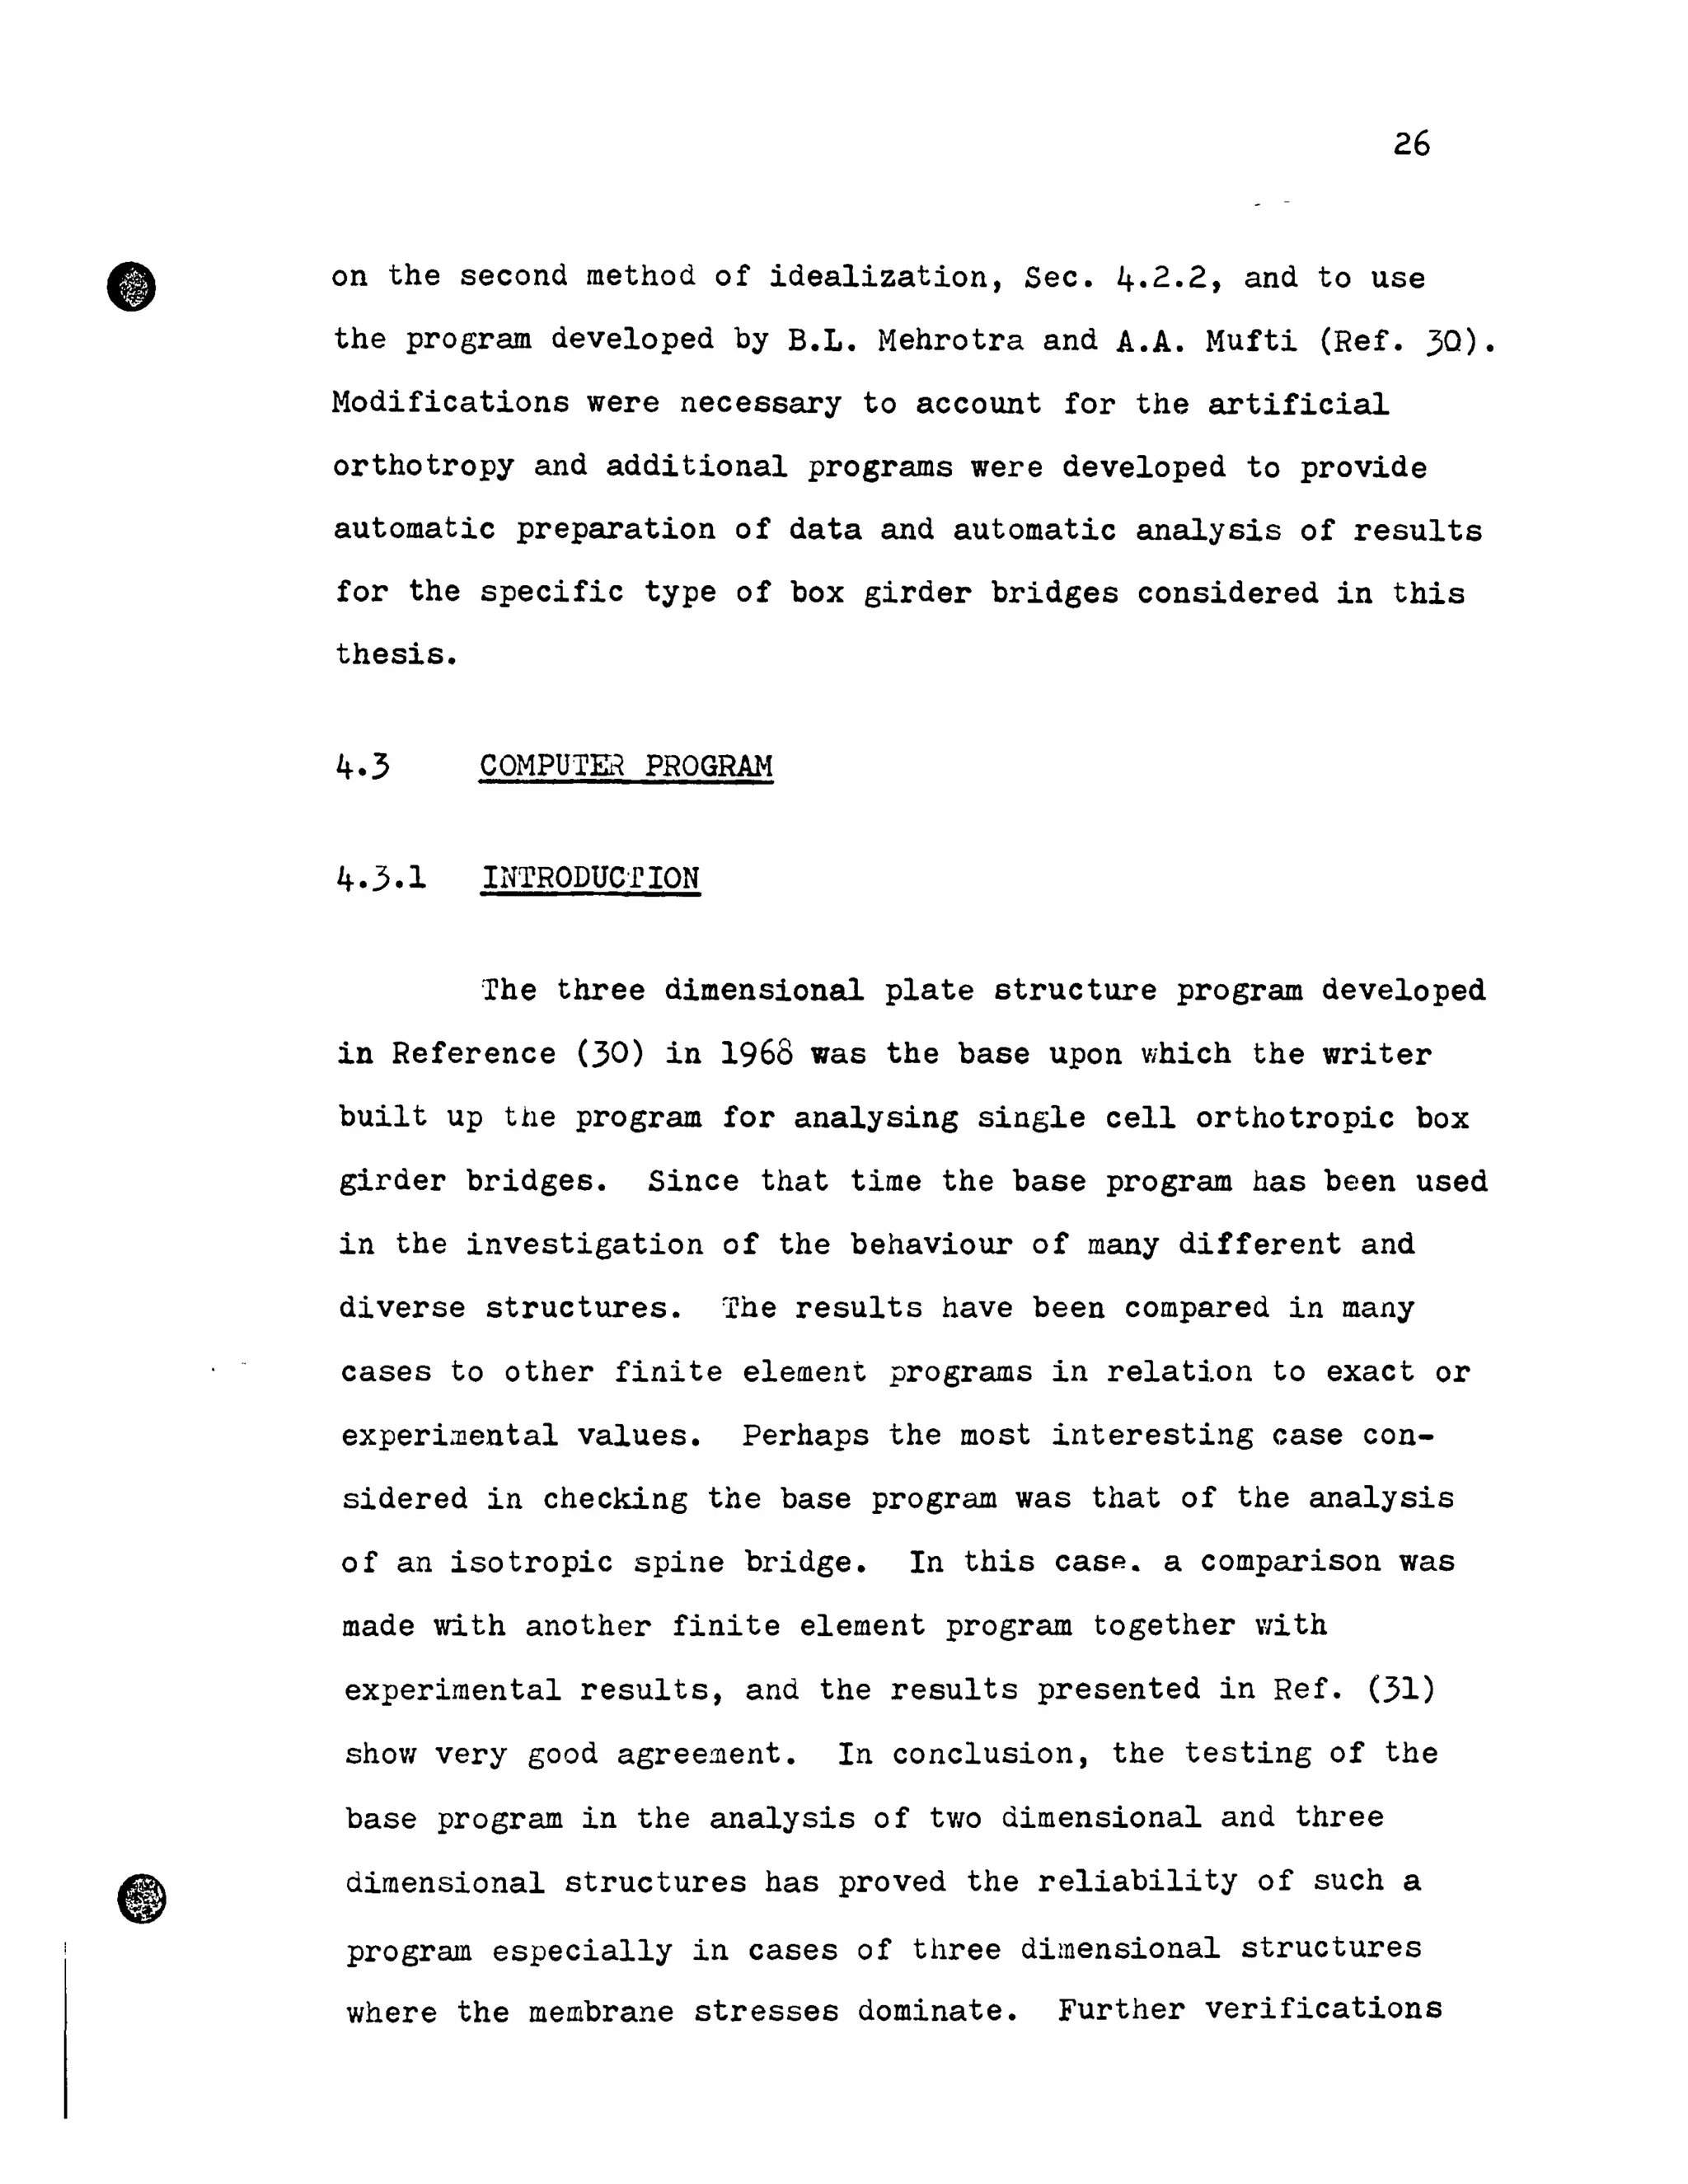
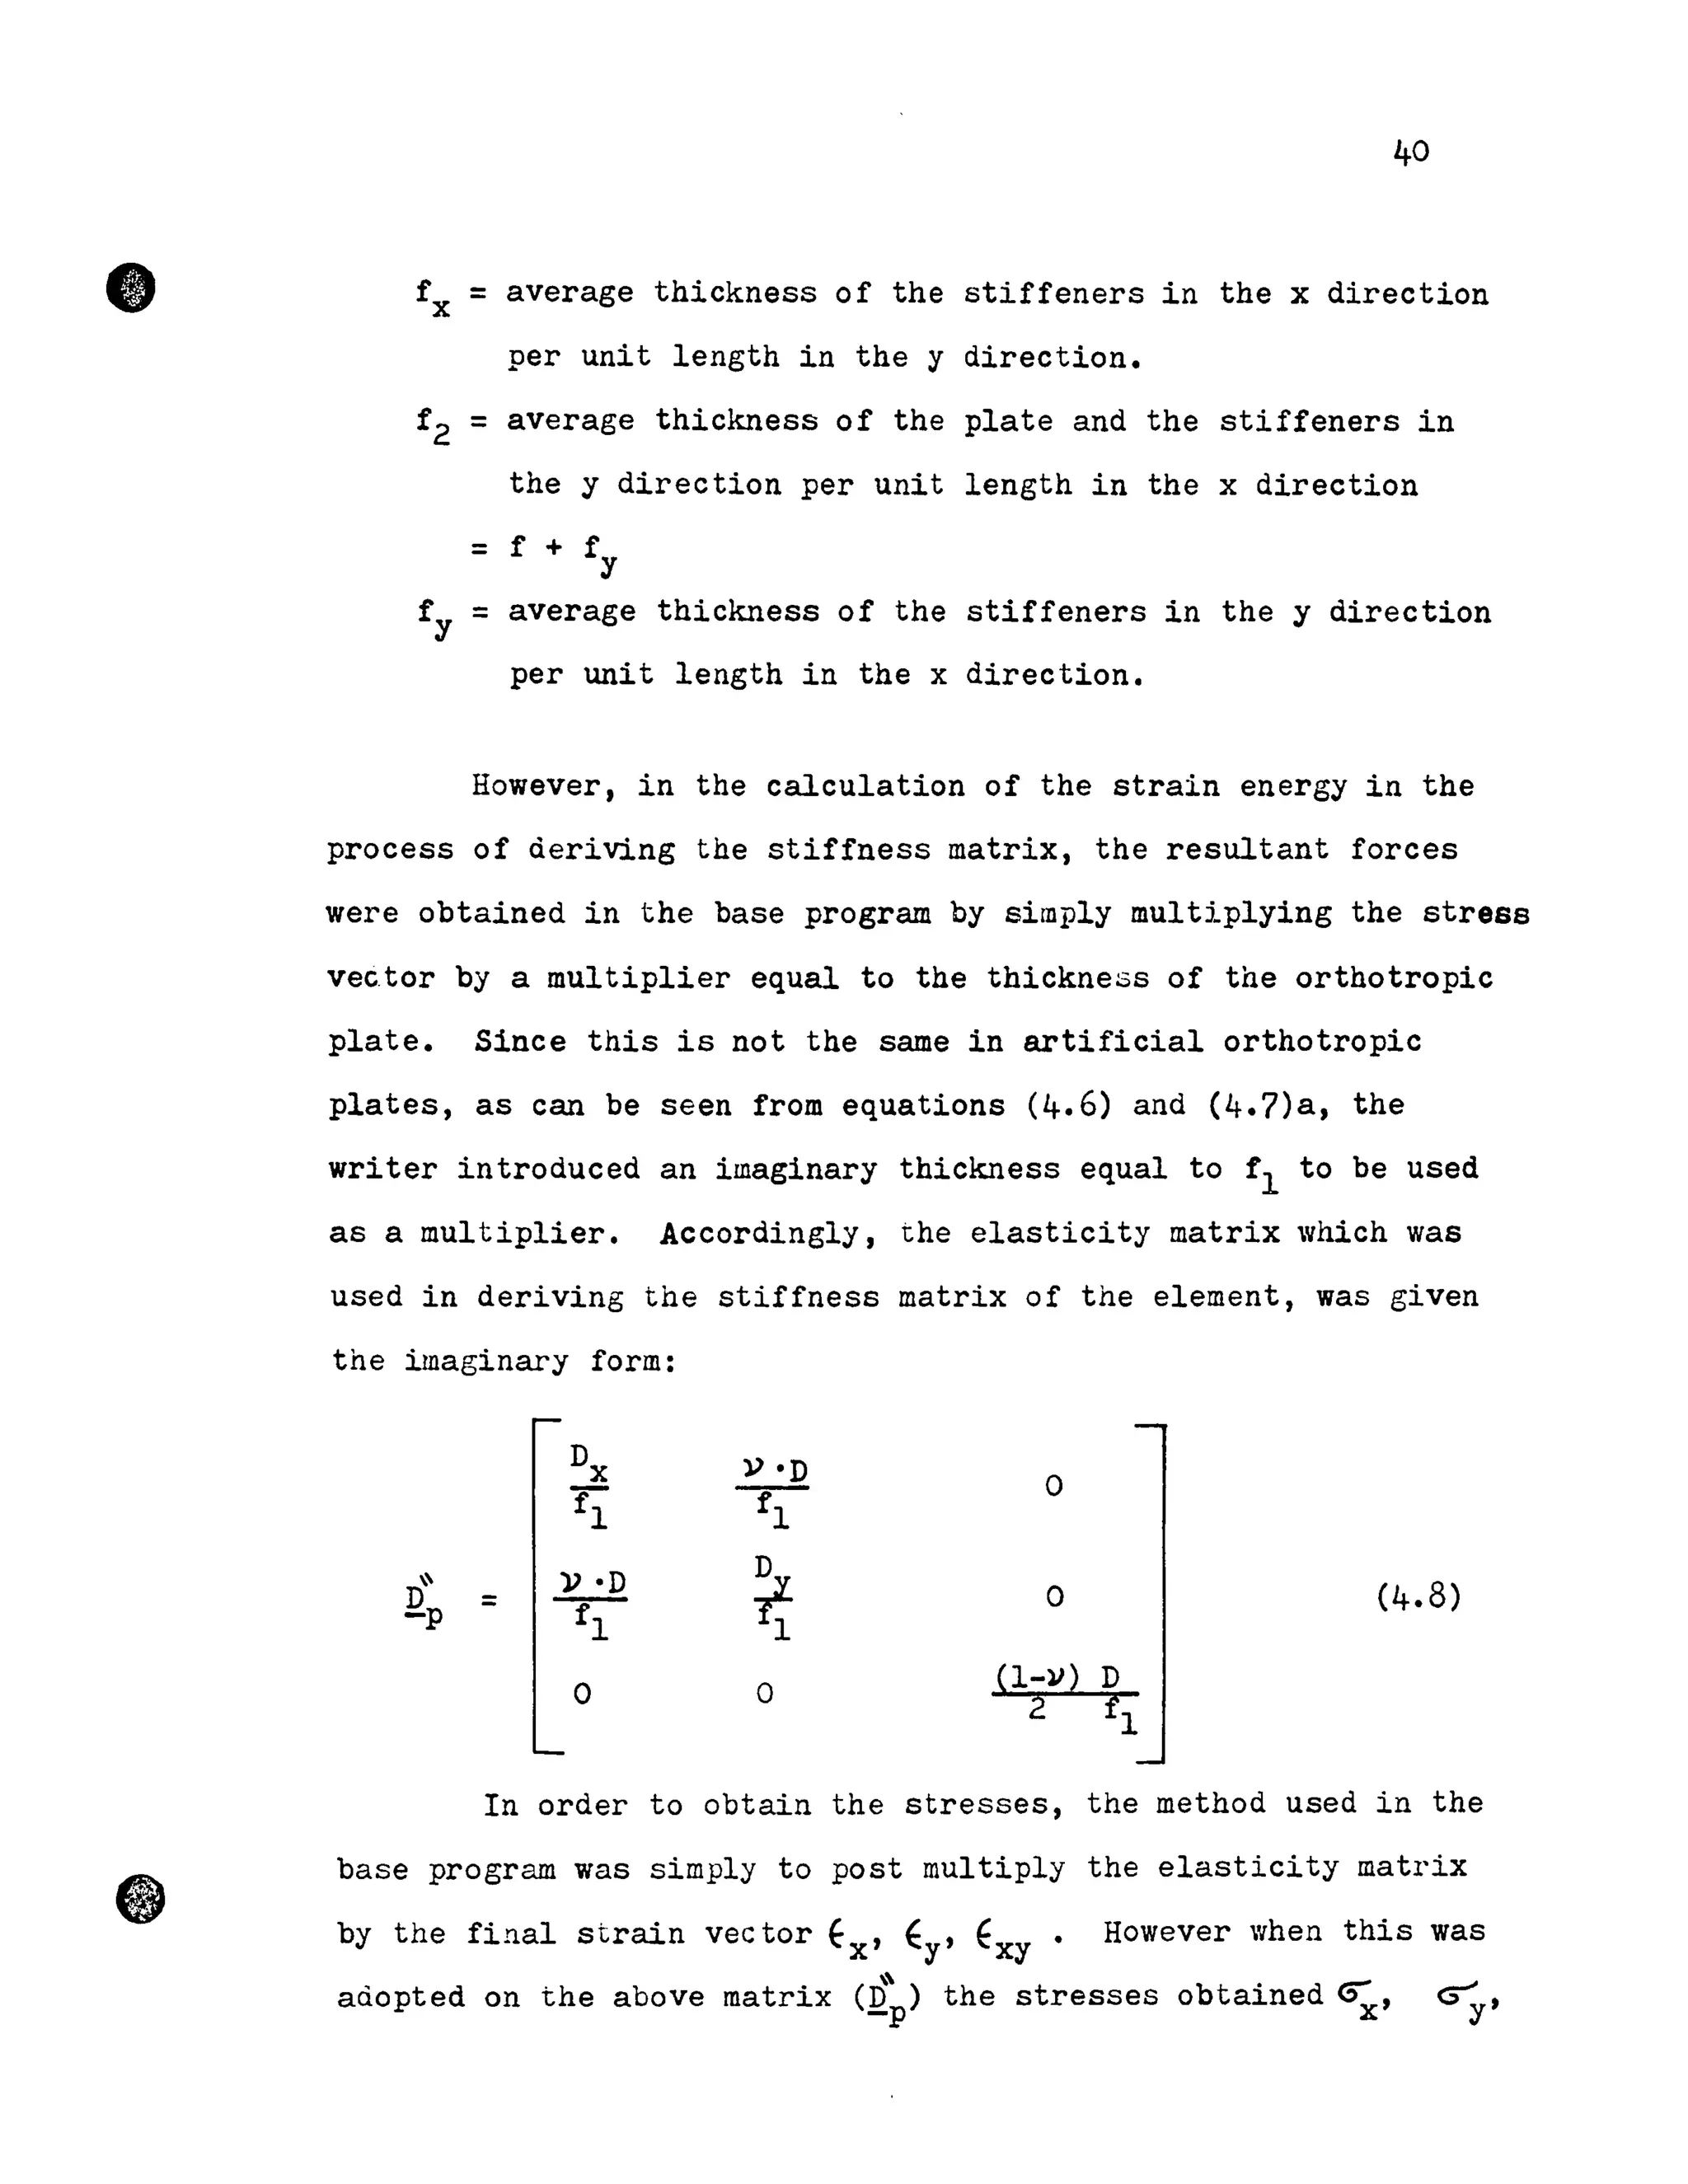
FIG. (4.16)
VARIATIO;'I OF DISrORTIO?lAL DEFOrt:·IATID:l ( bz) ALONG
t THE SPA]
-
0 Finite Element
t- - l ..--------- Hoae ExperimenL.
-- 0
--... - 0... ...,,
., ., (!)
.... "'0'".,
... .,. -t:;)-
--0.1 0.2 0.3
FIG. (4.17)
VARIATIOlT OF L03GITUDnrAL BE:mnm STHESS ~b
ALOnG t rrHE SPAN
0
XIL
0.5](https://image.slidesharecdn.com/torsionalbehaviourofsinglecellboxgirderbridges-140613171733-phpapp01/75/Torsional-behaviour-of-single-cell-box-girder-bridges-132-2048.jpg)

![•
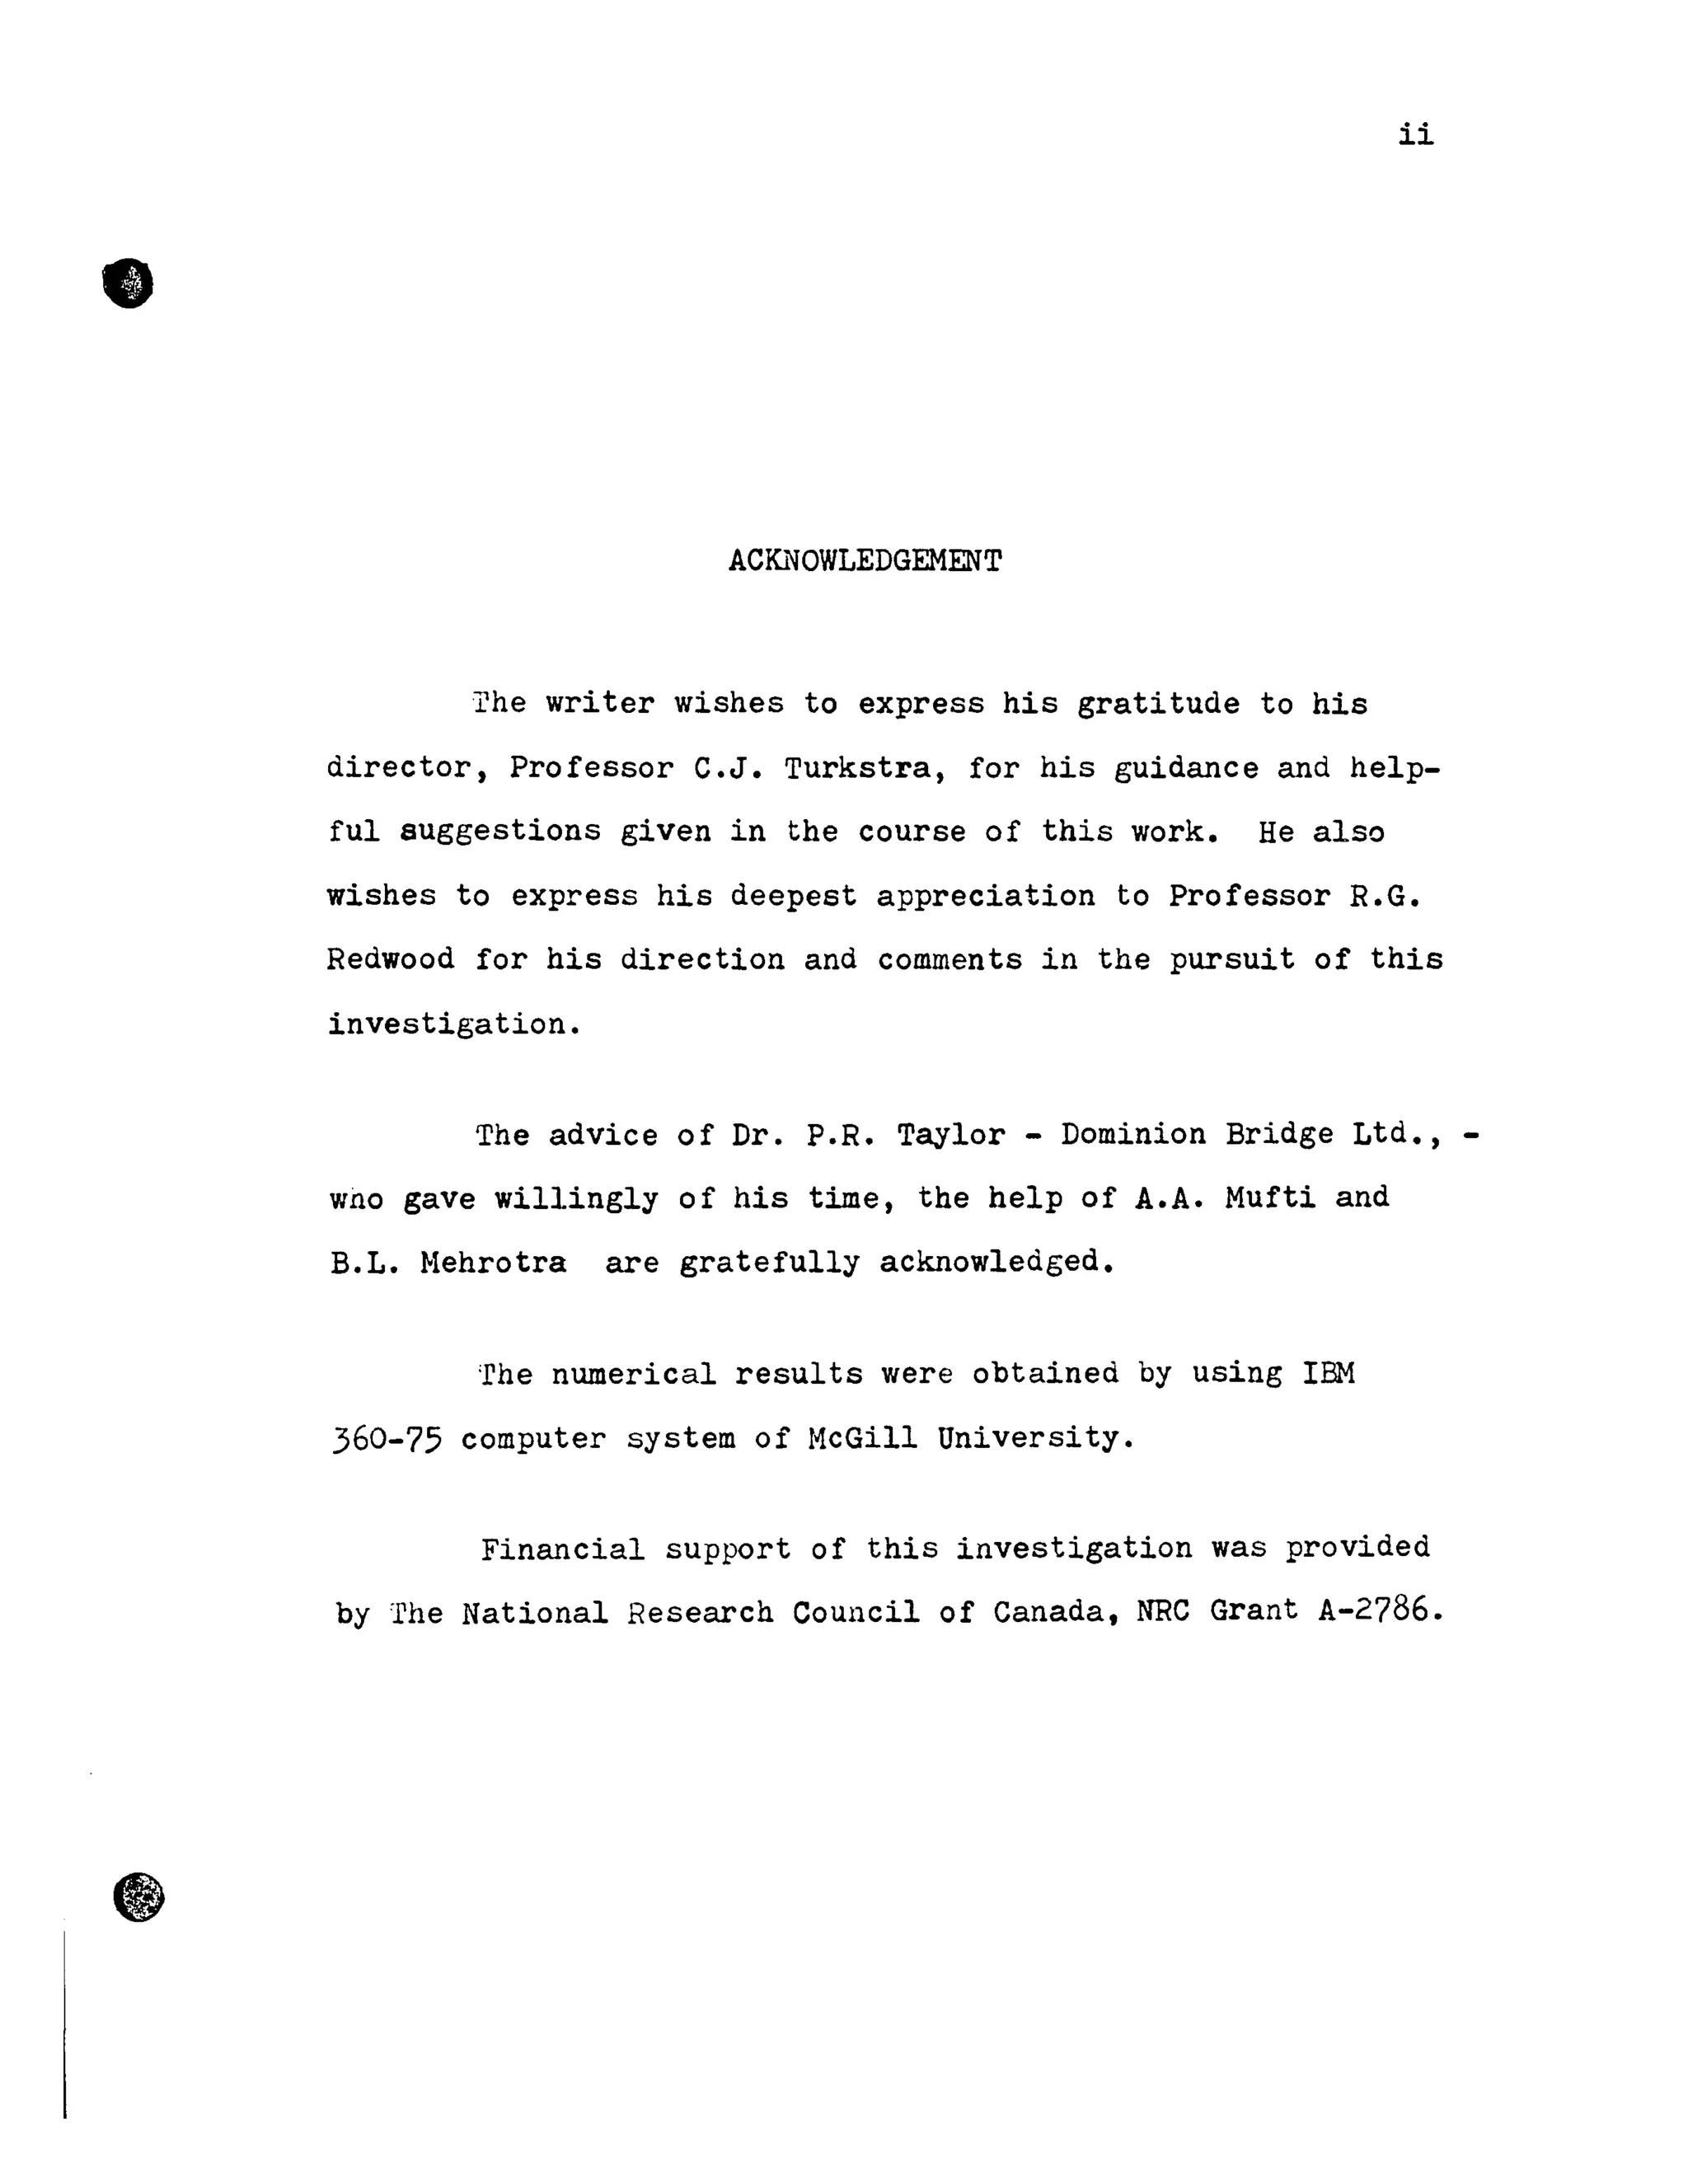
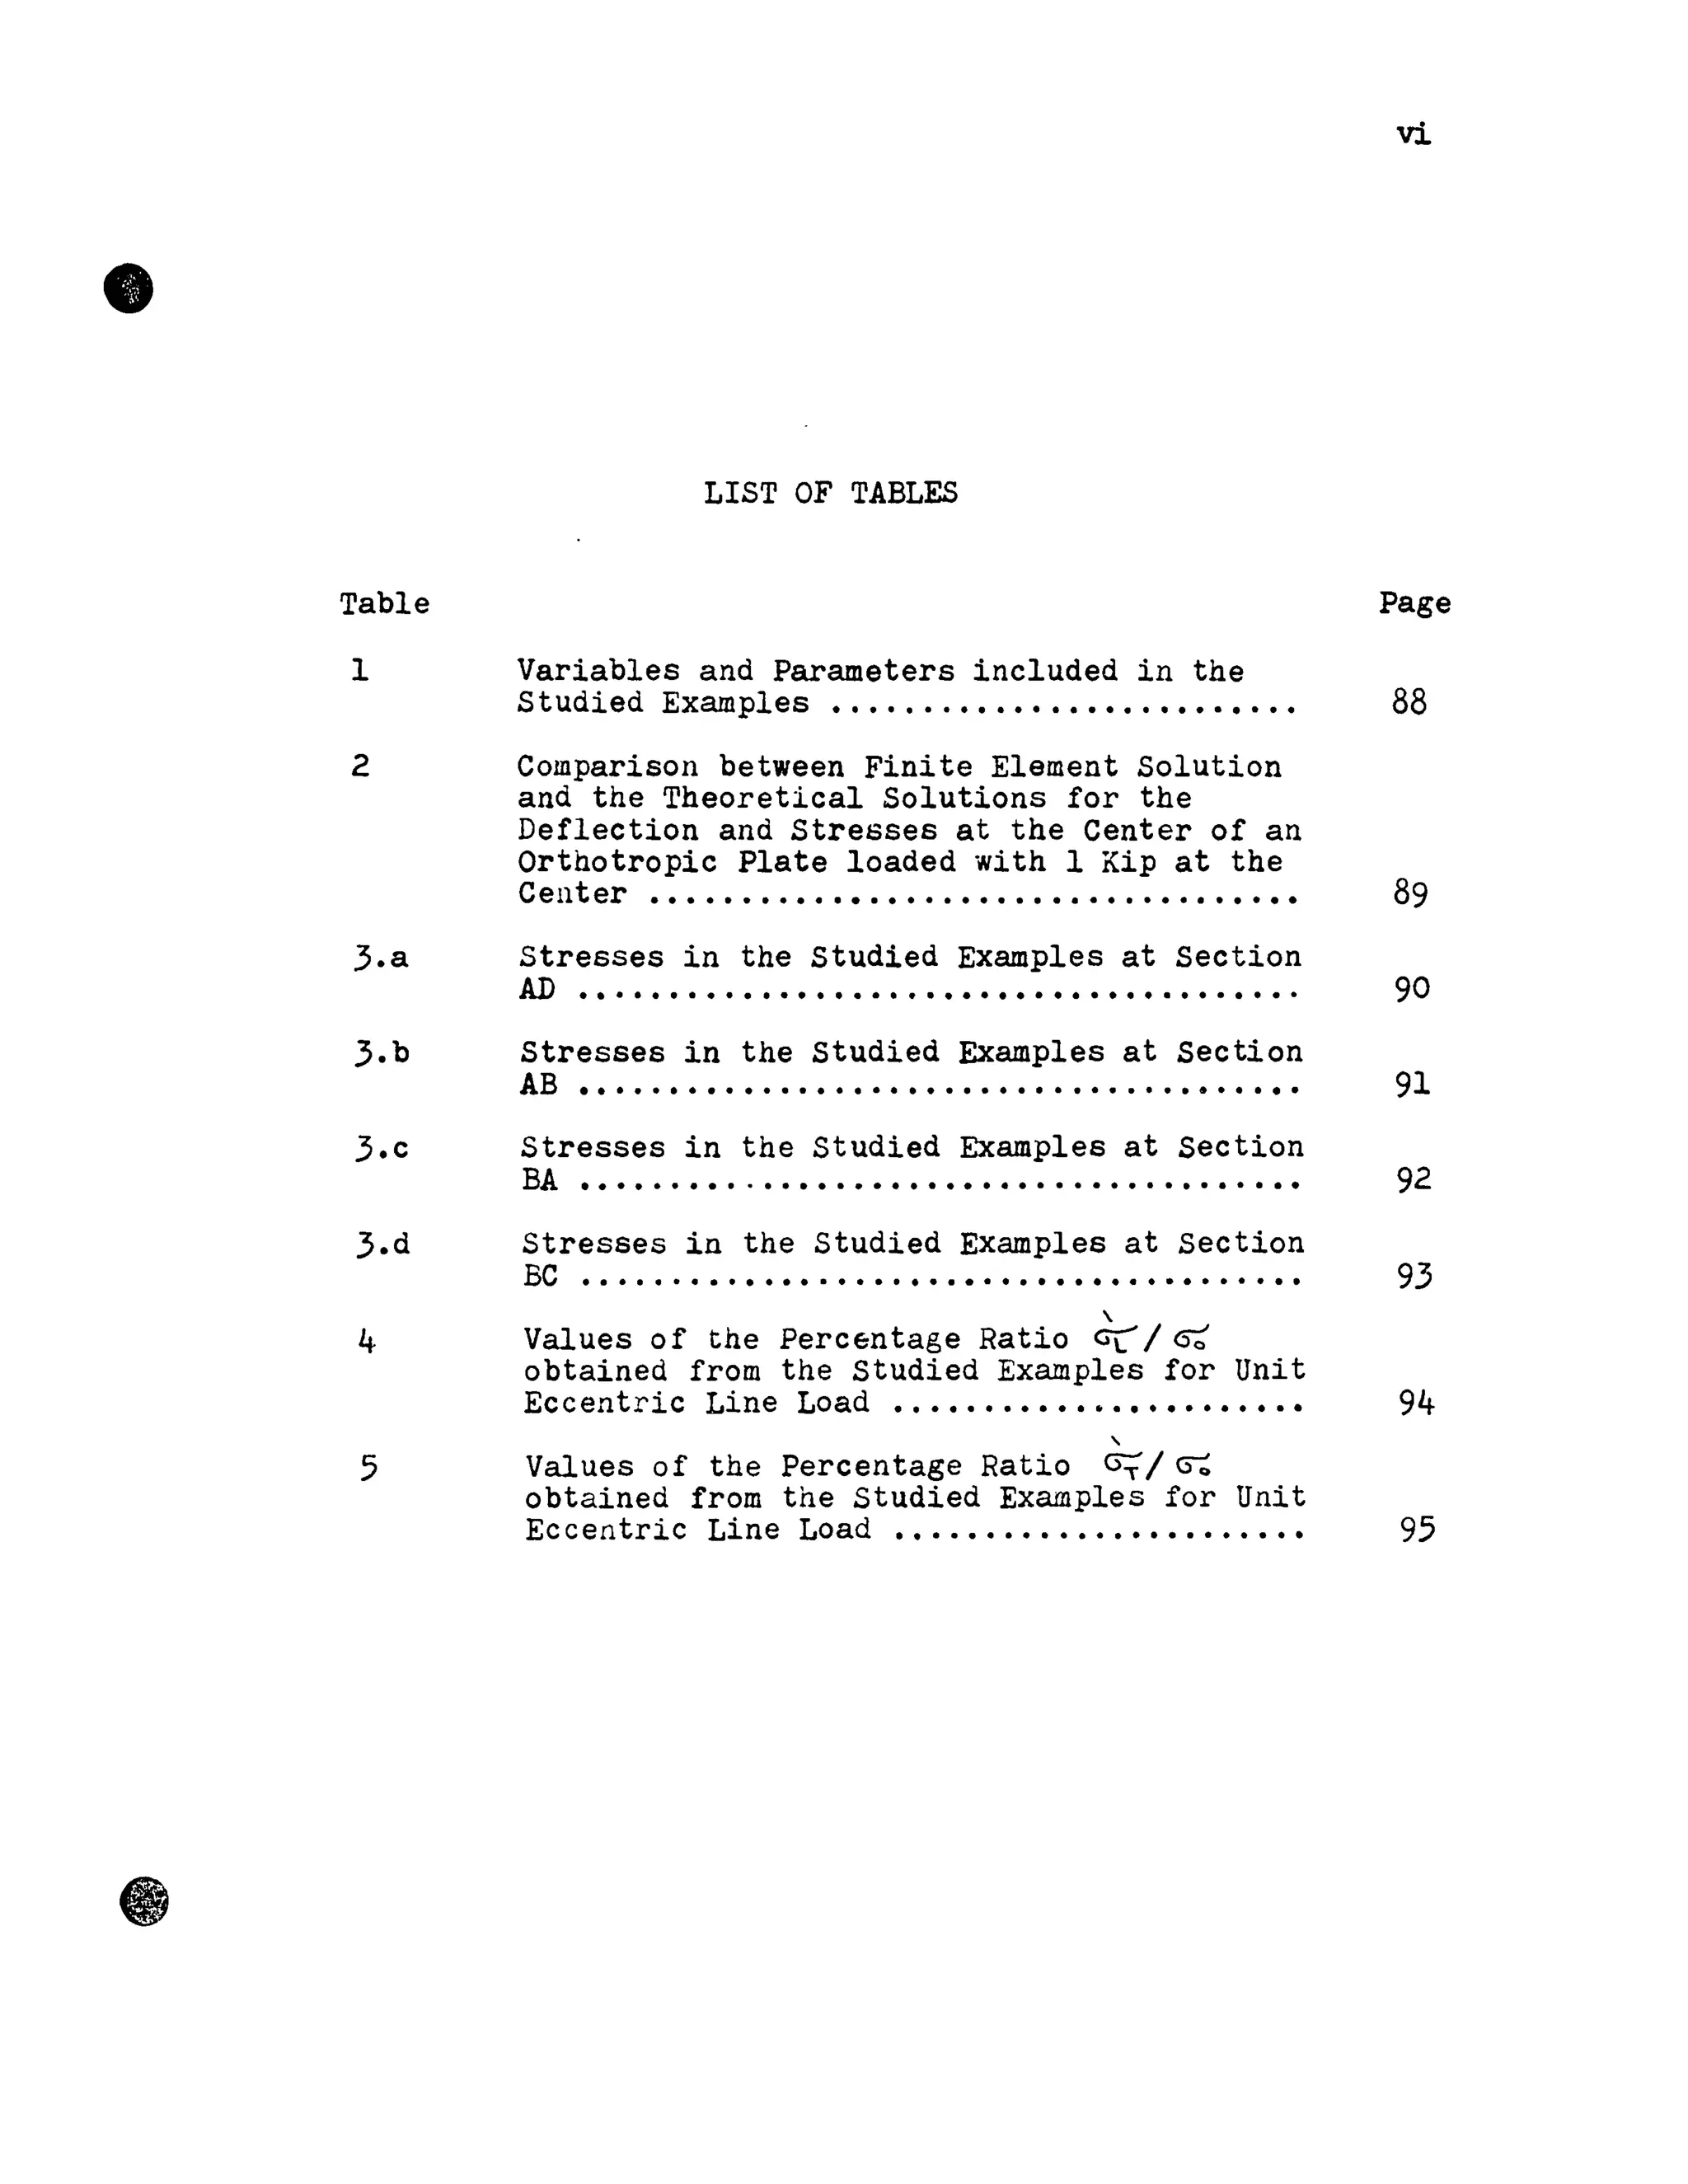
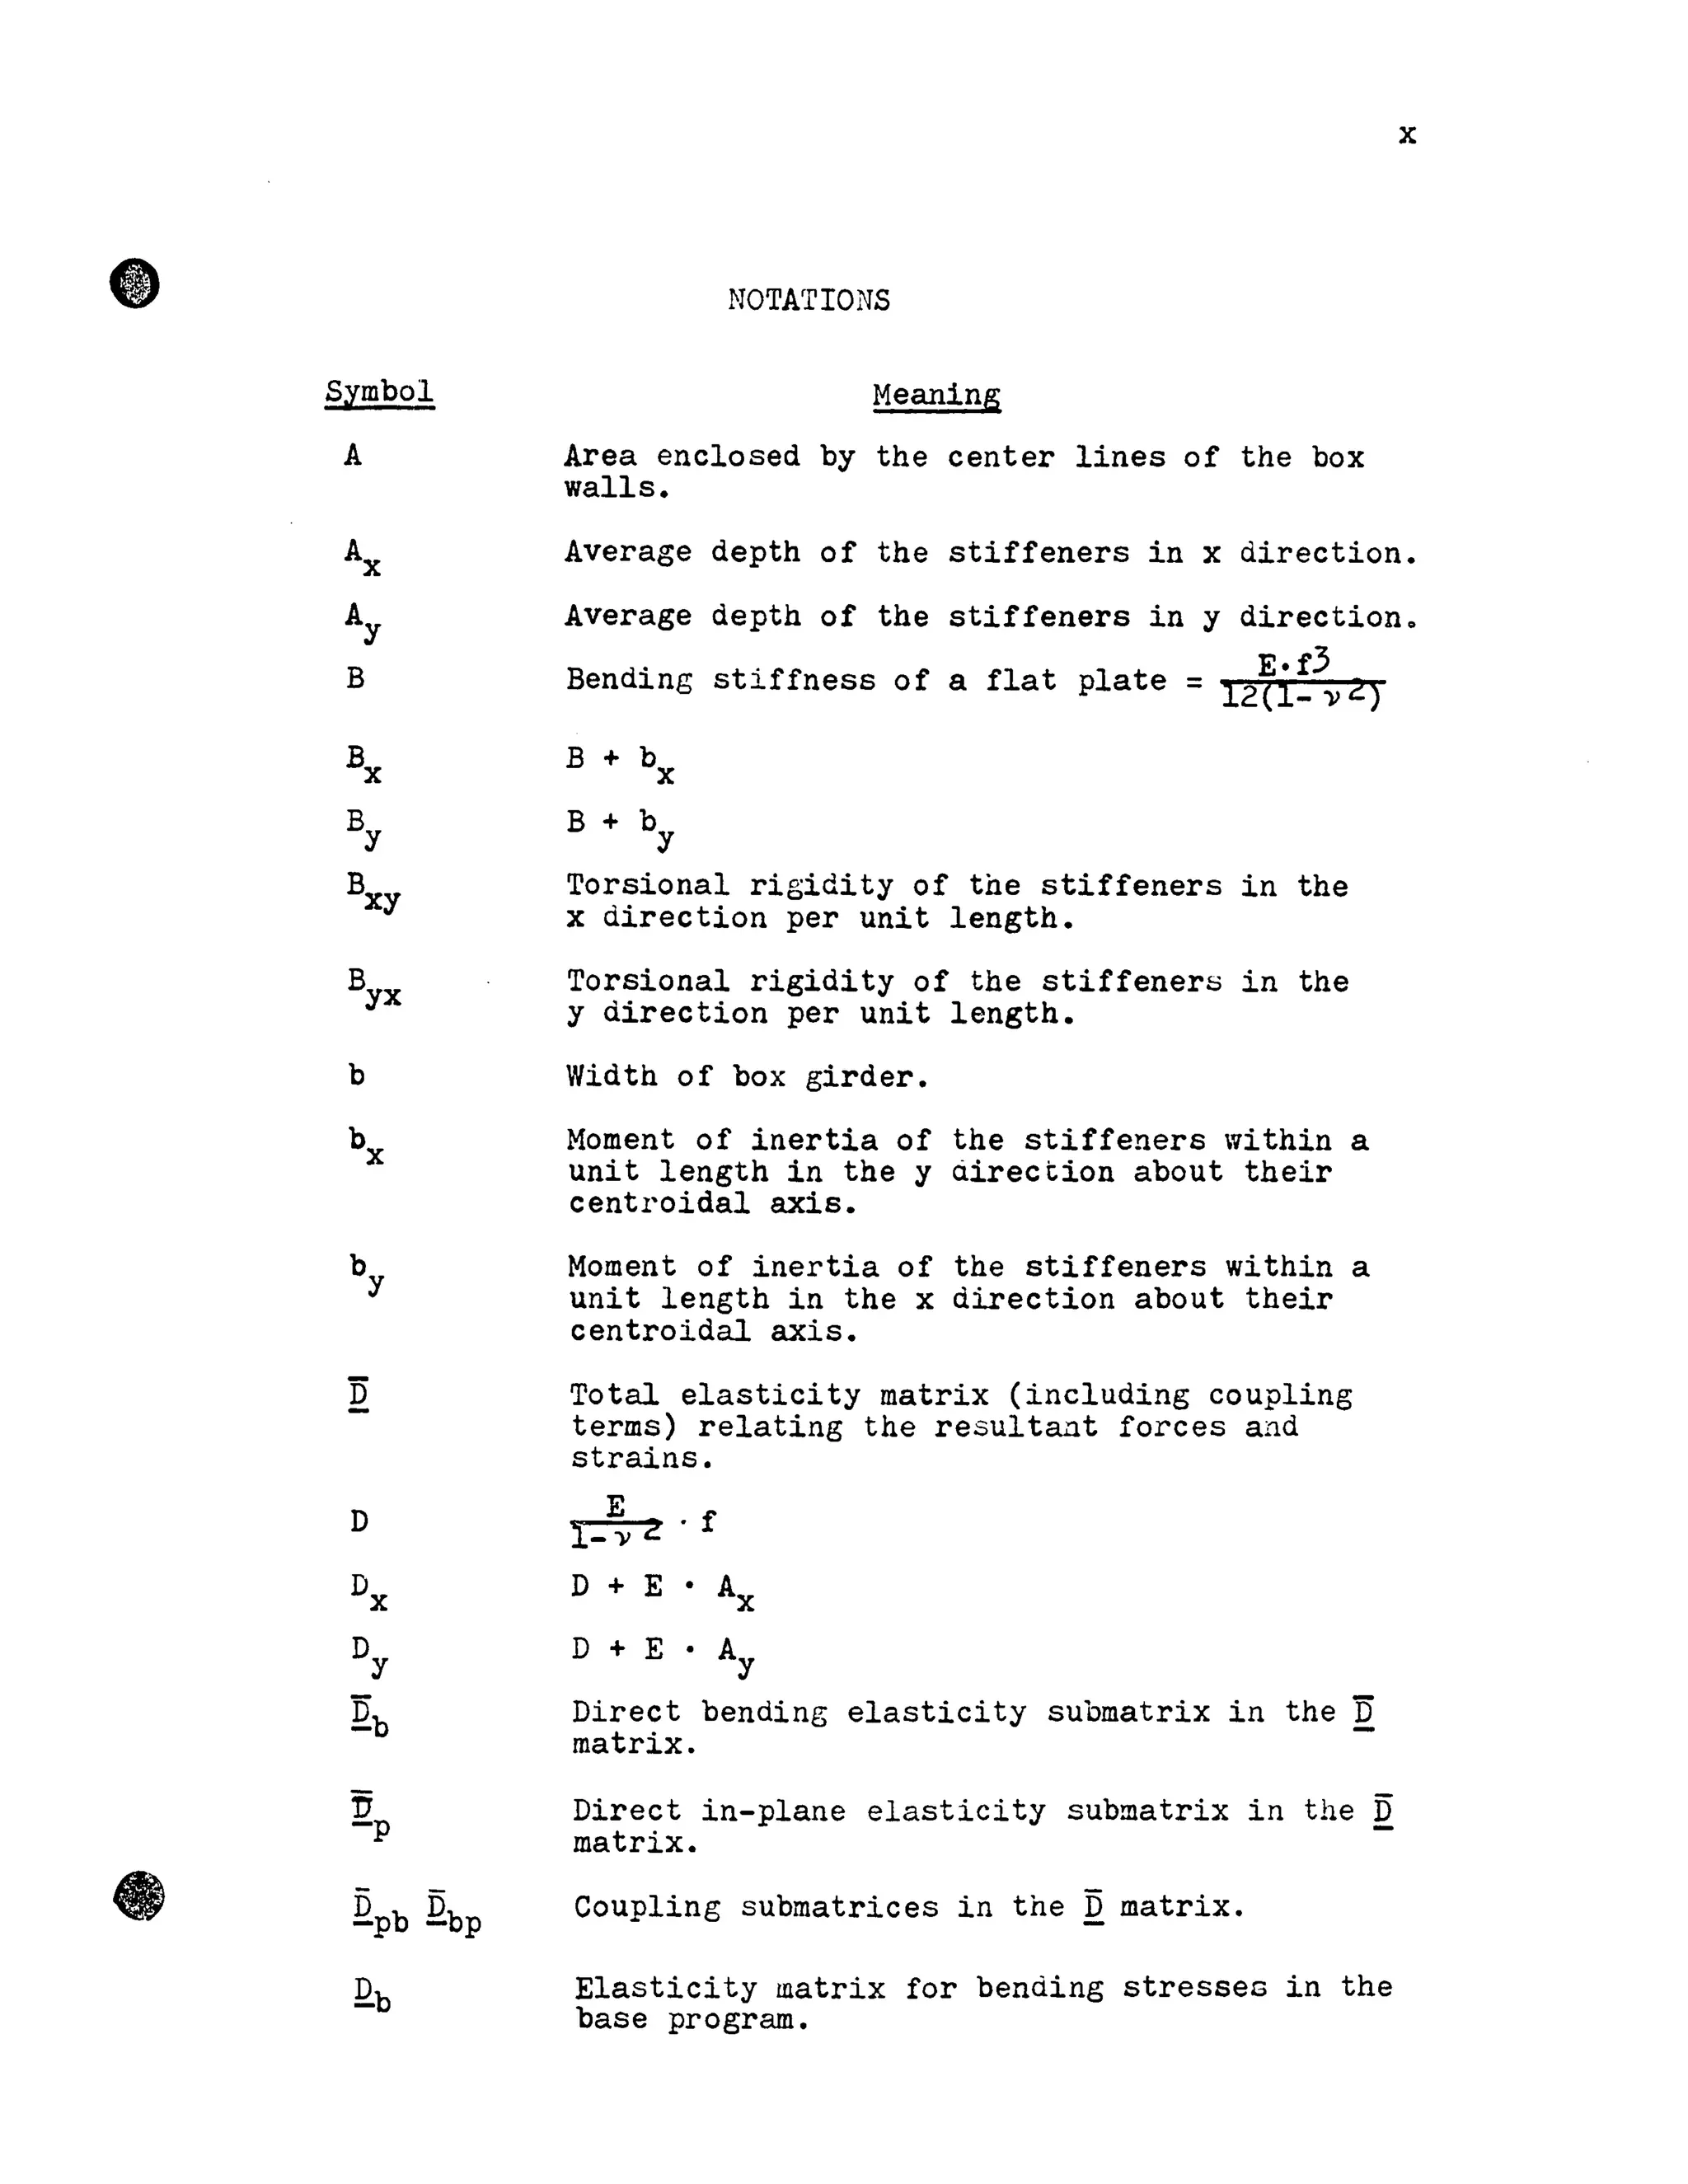
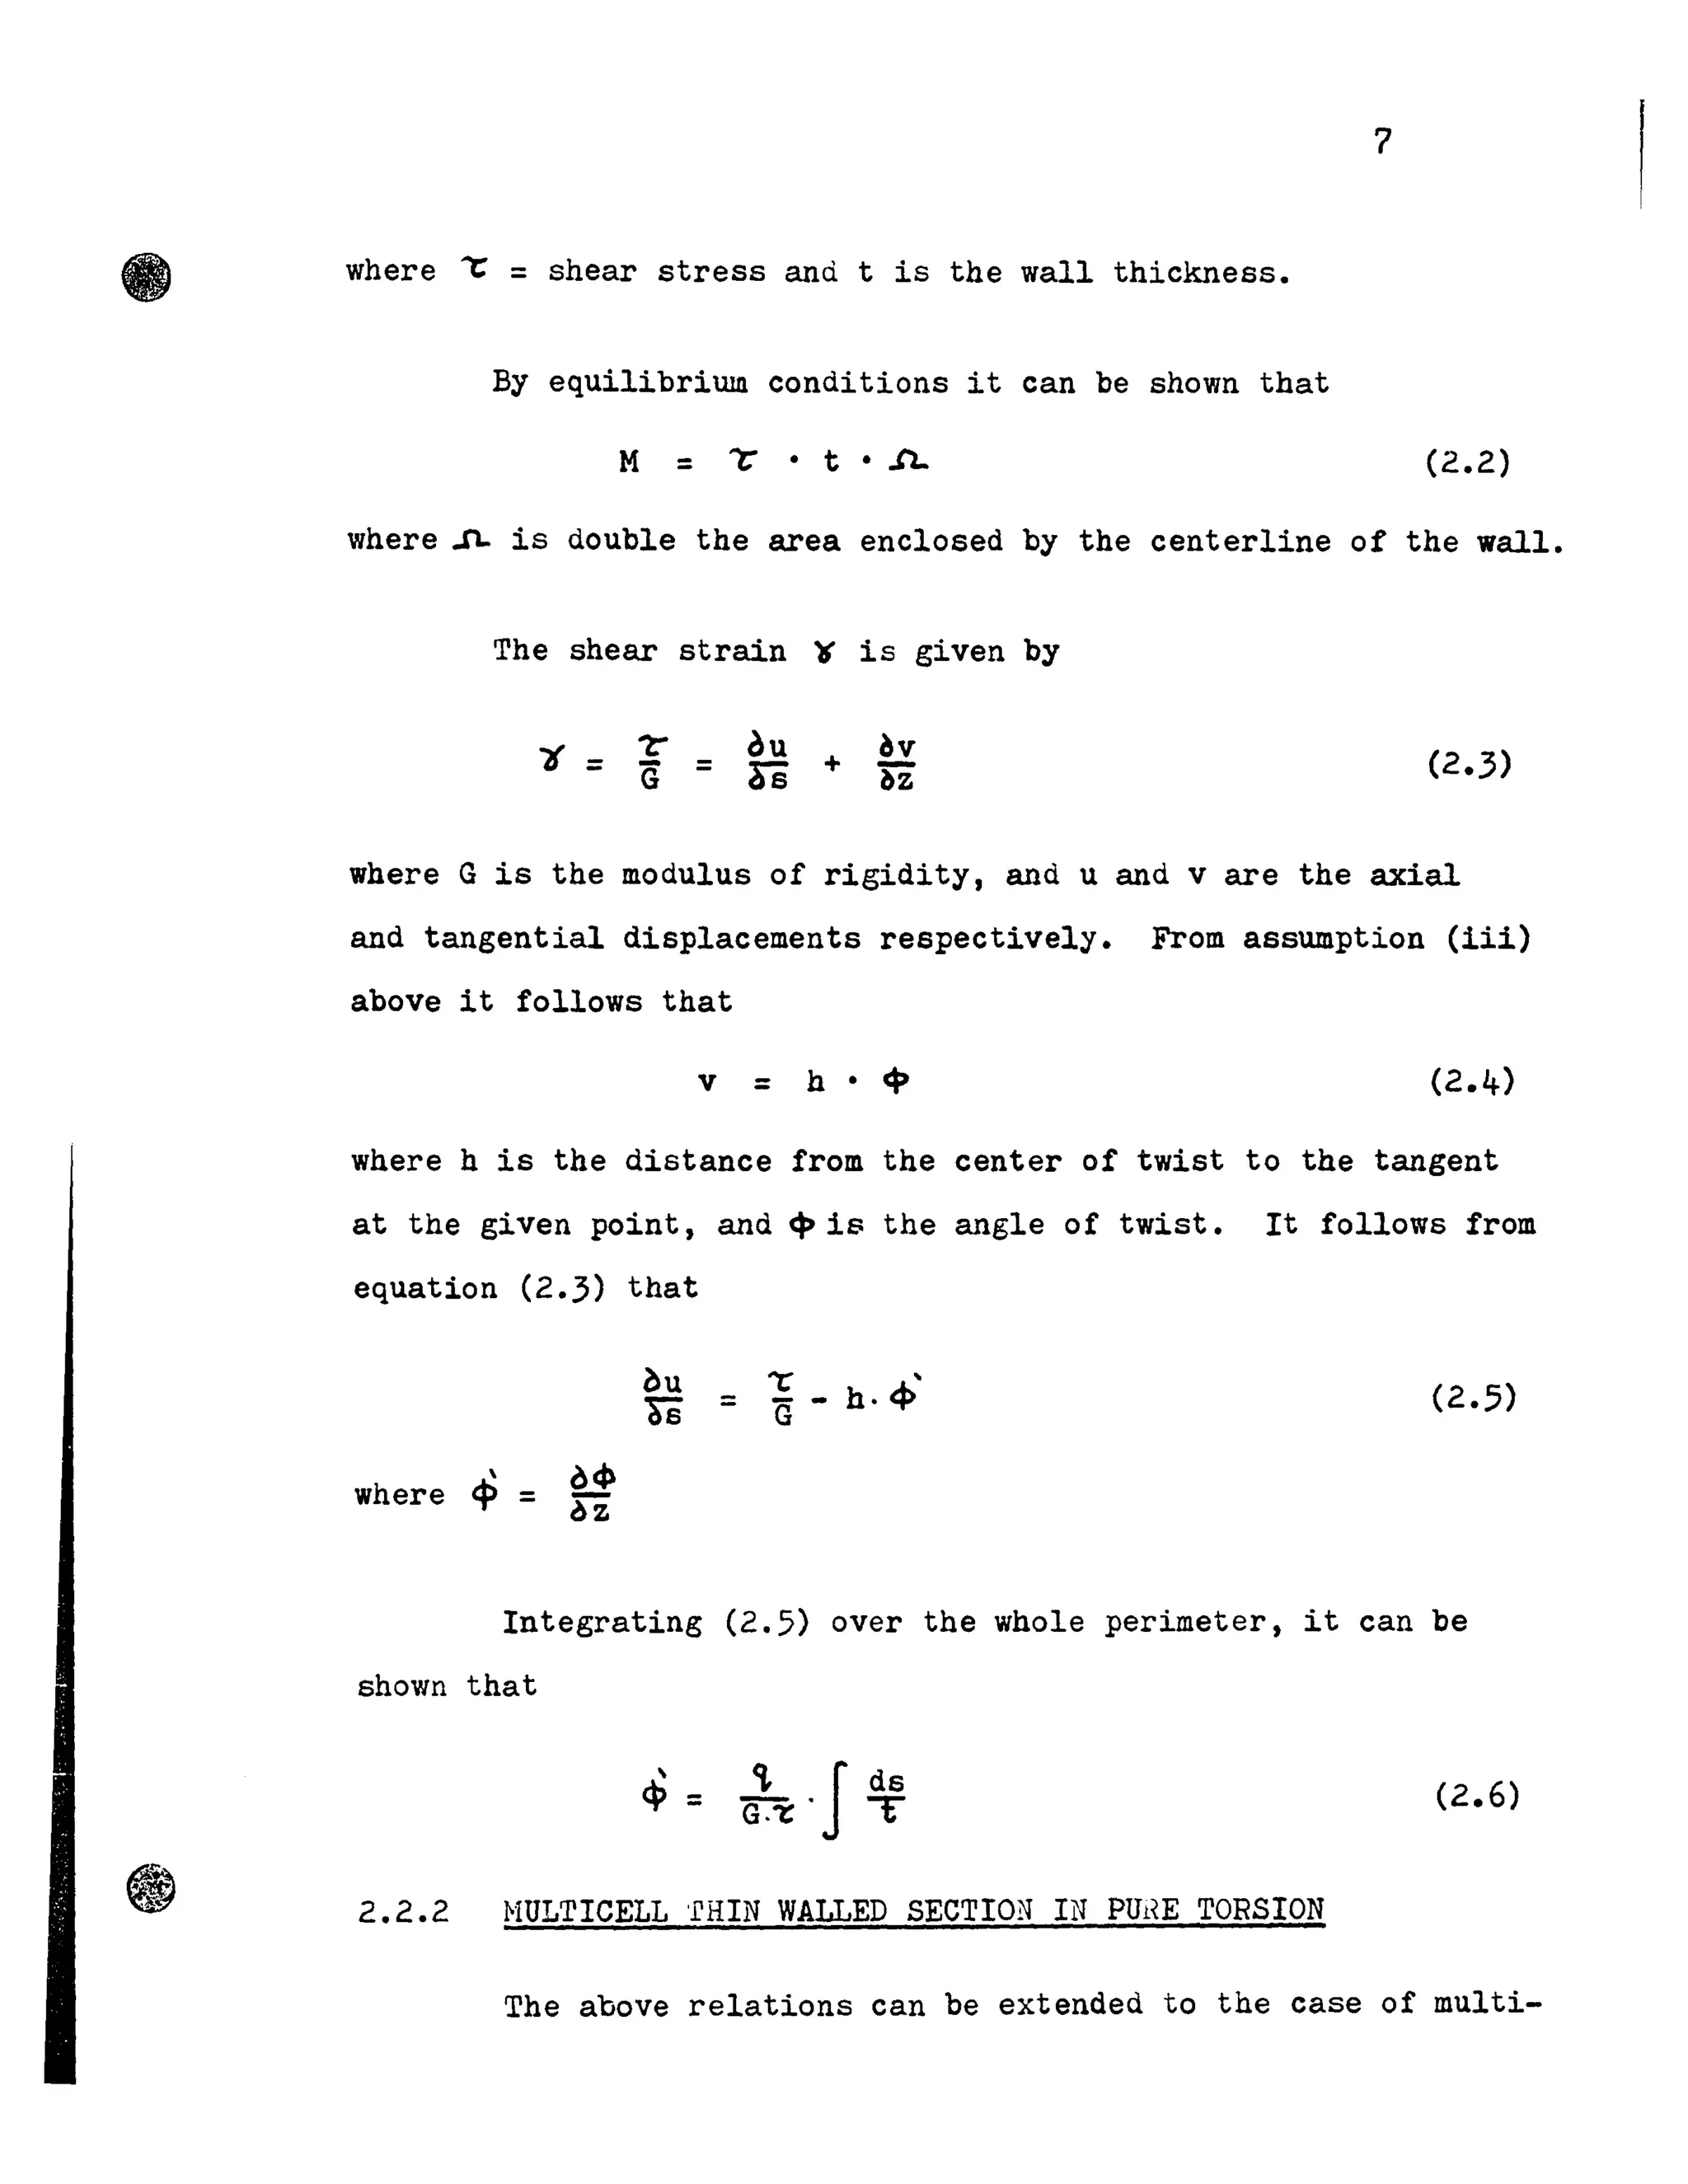
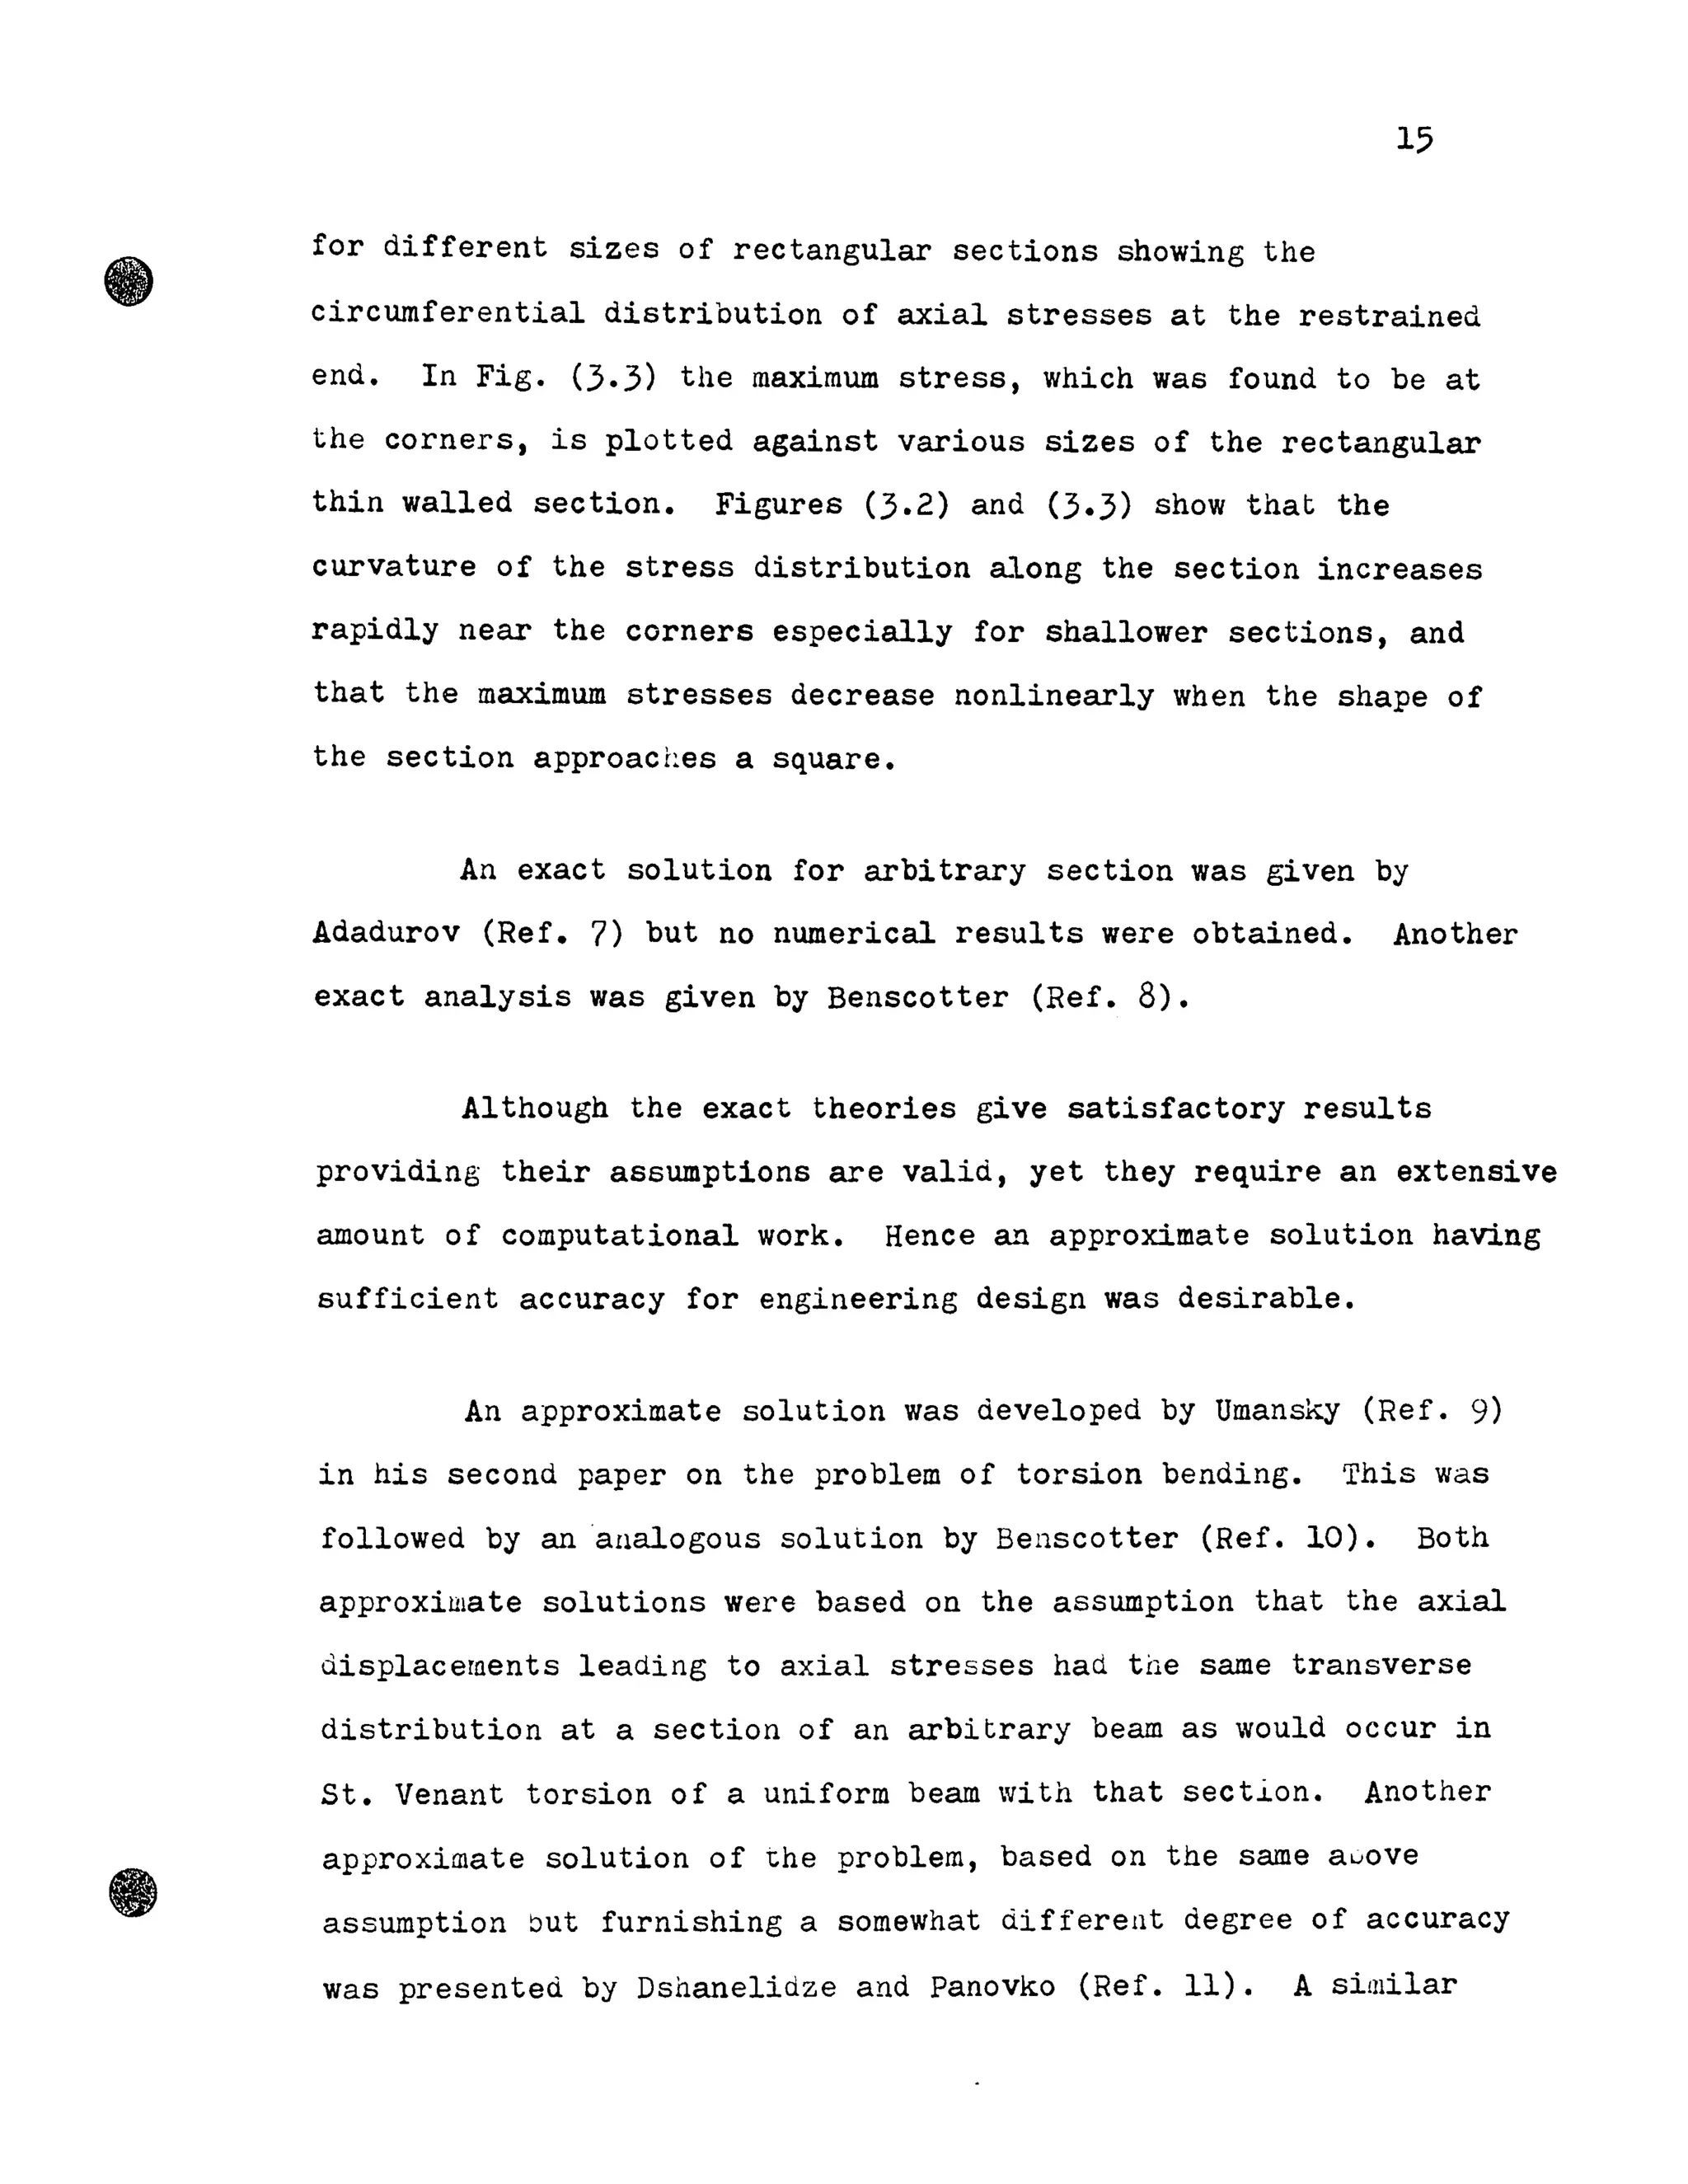
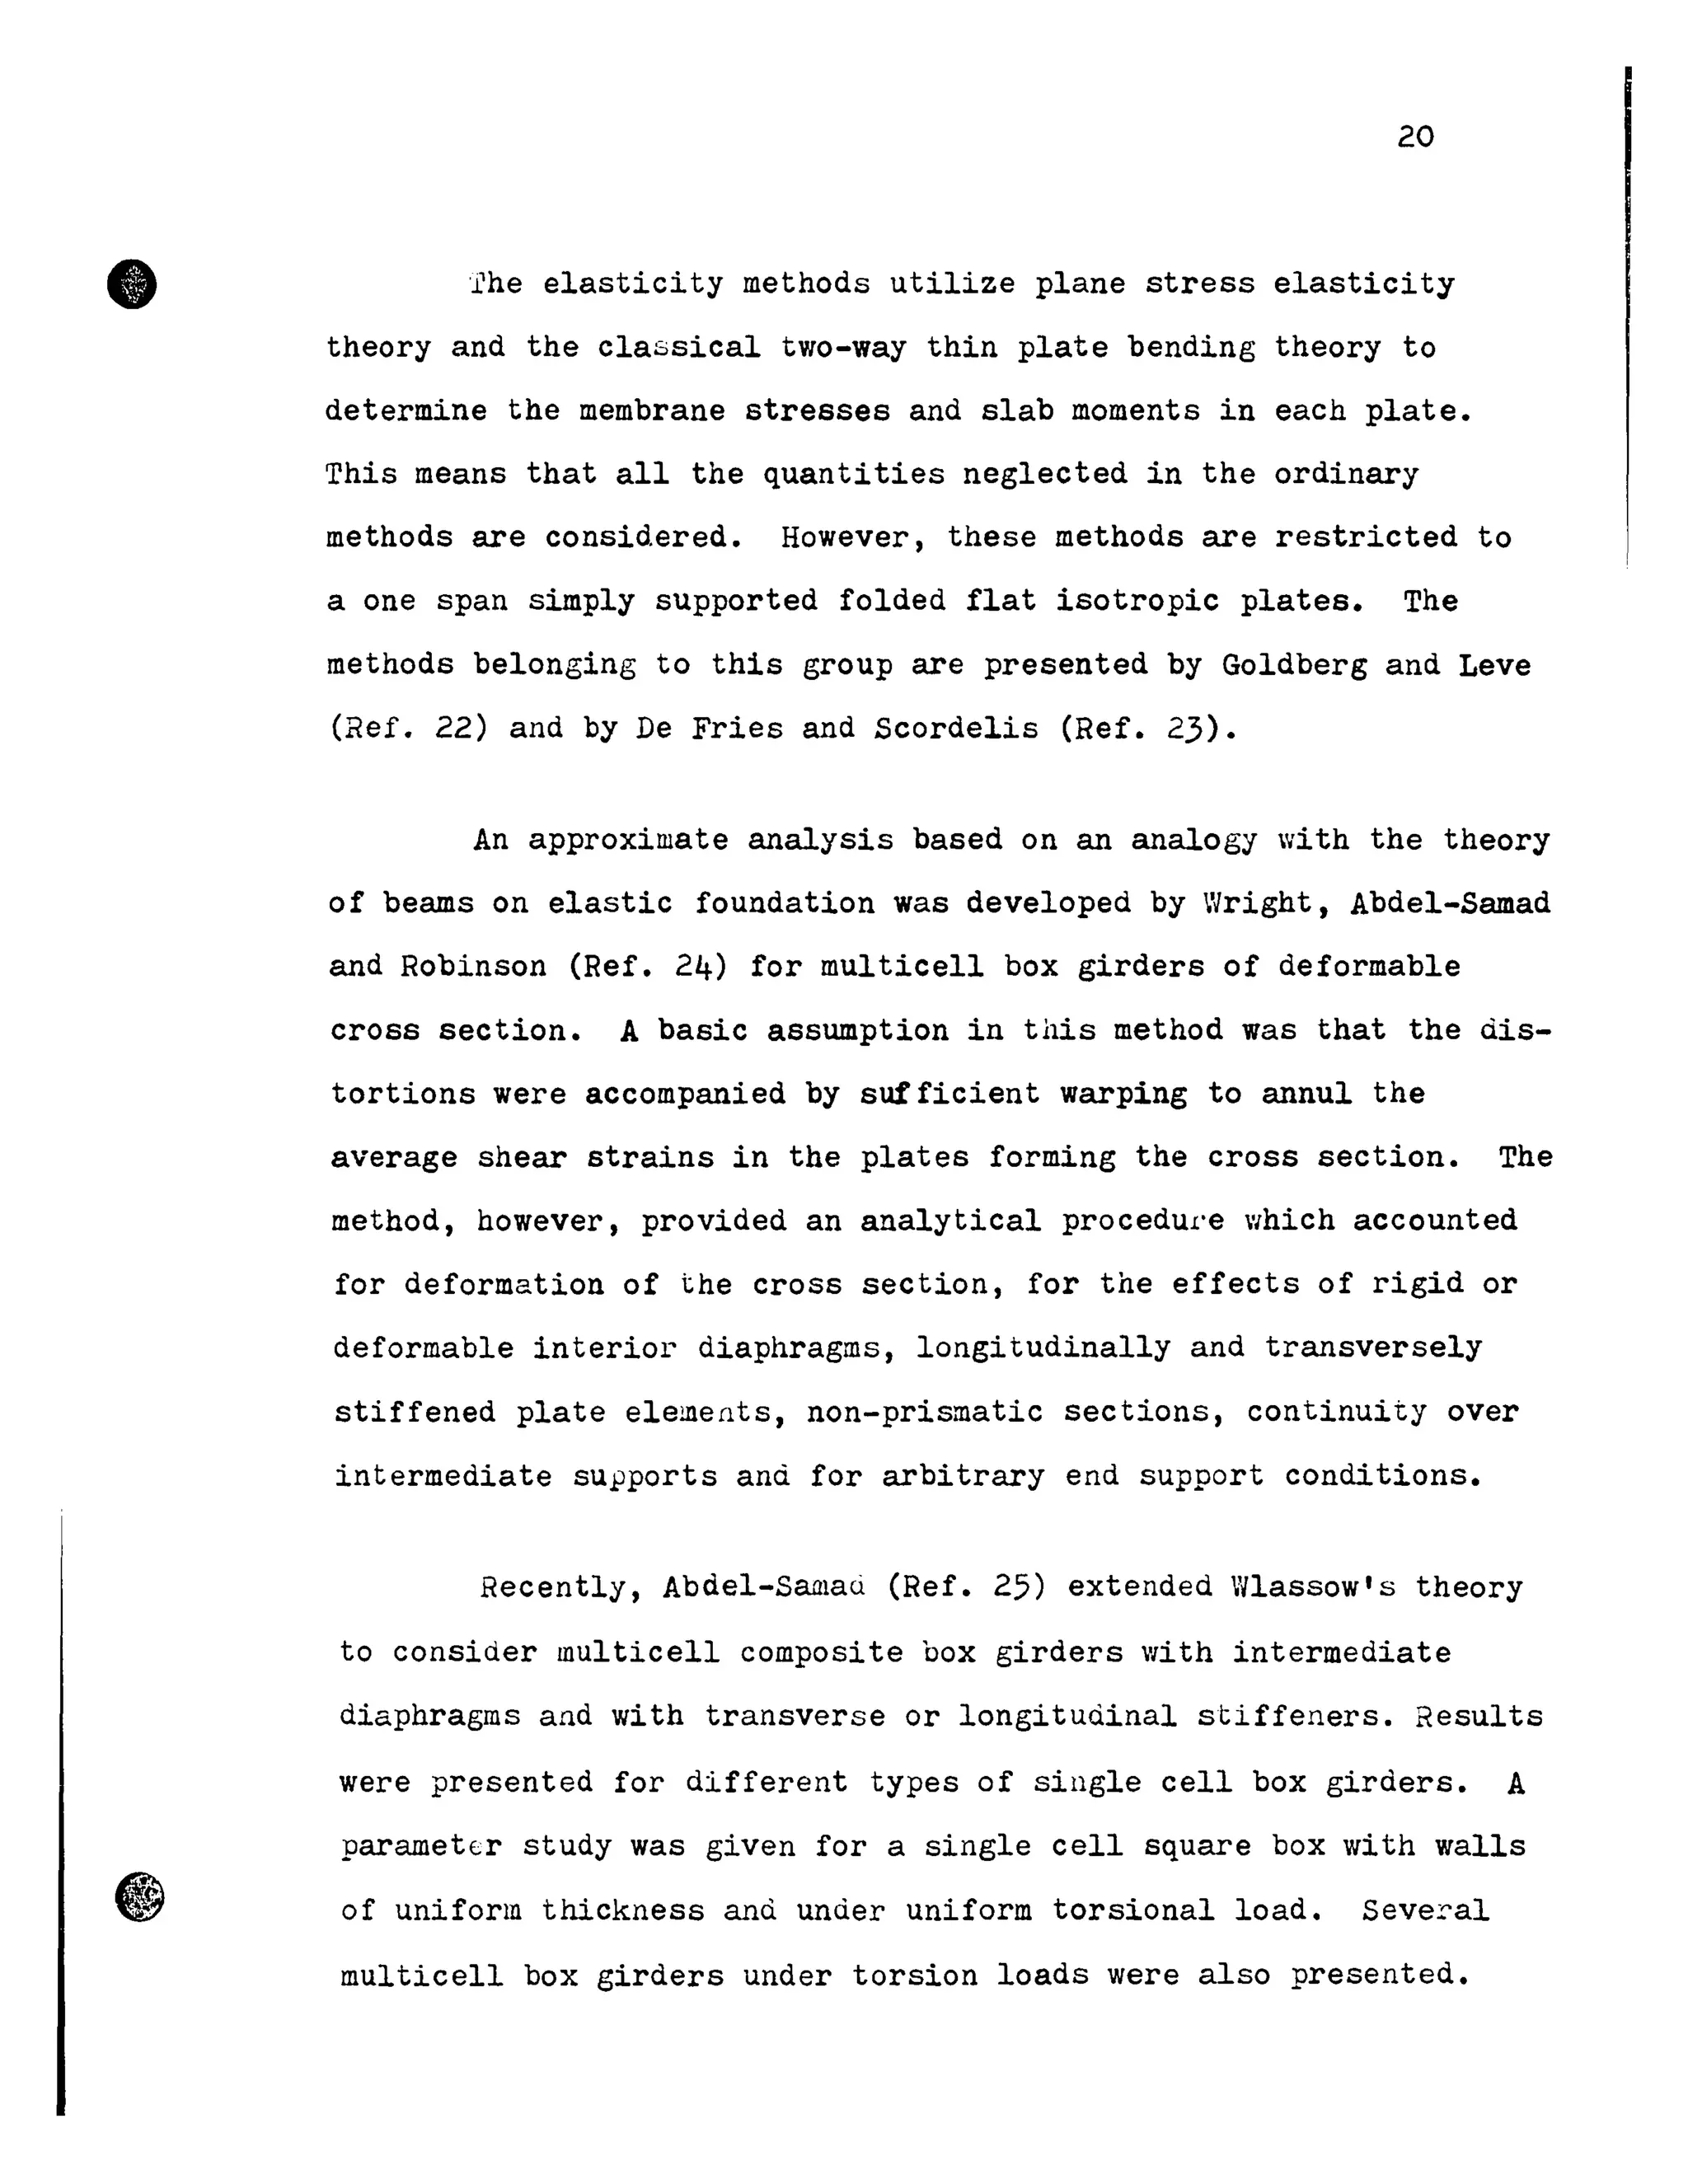
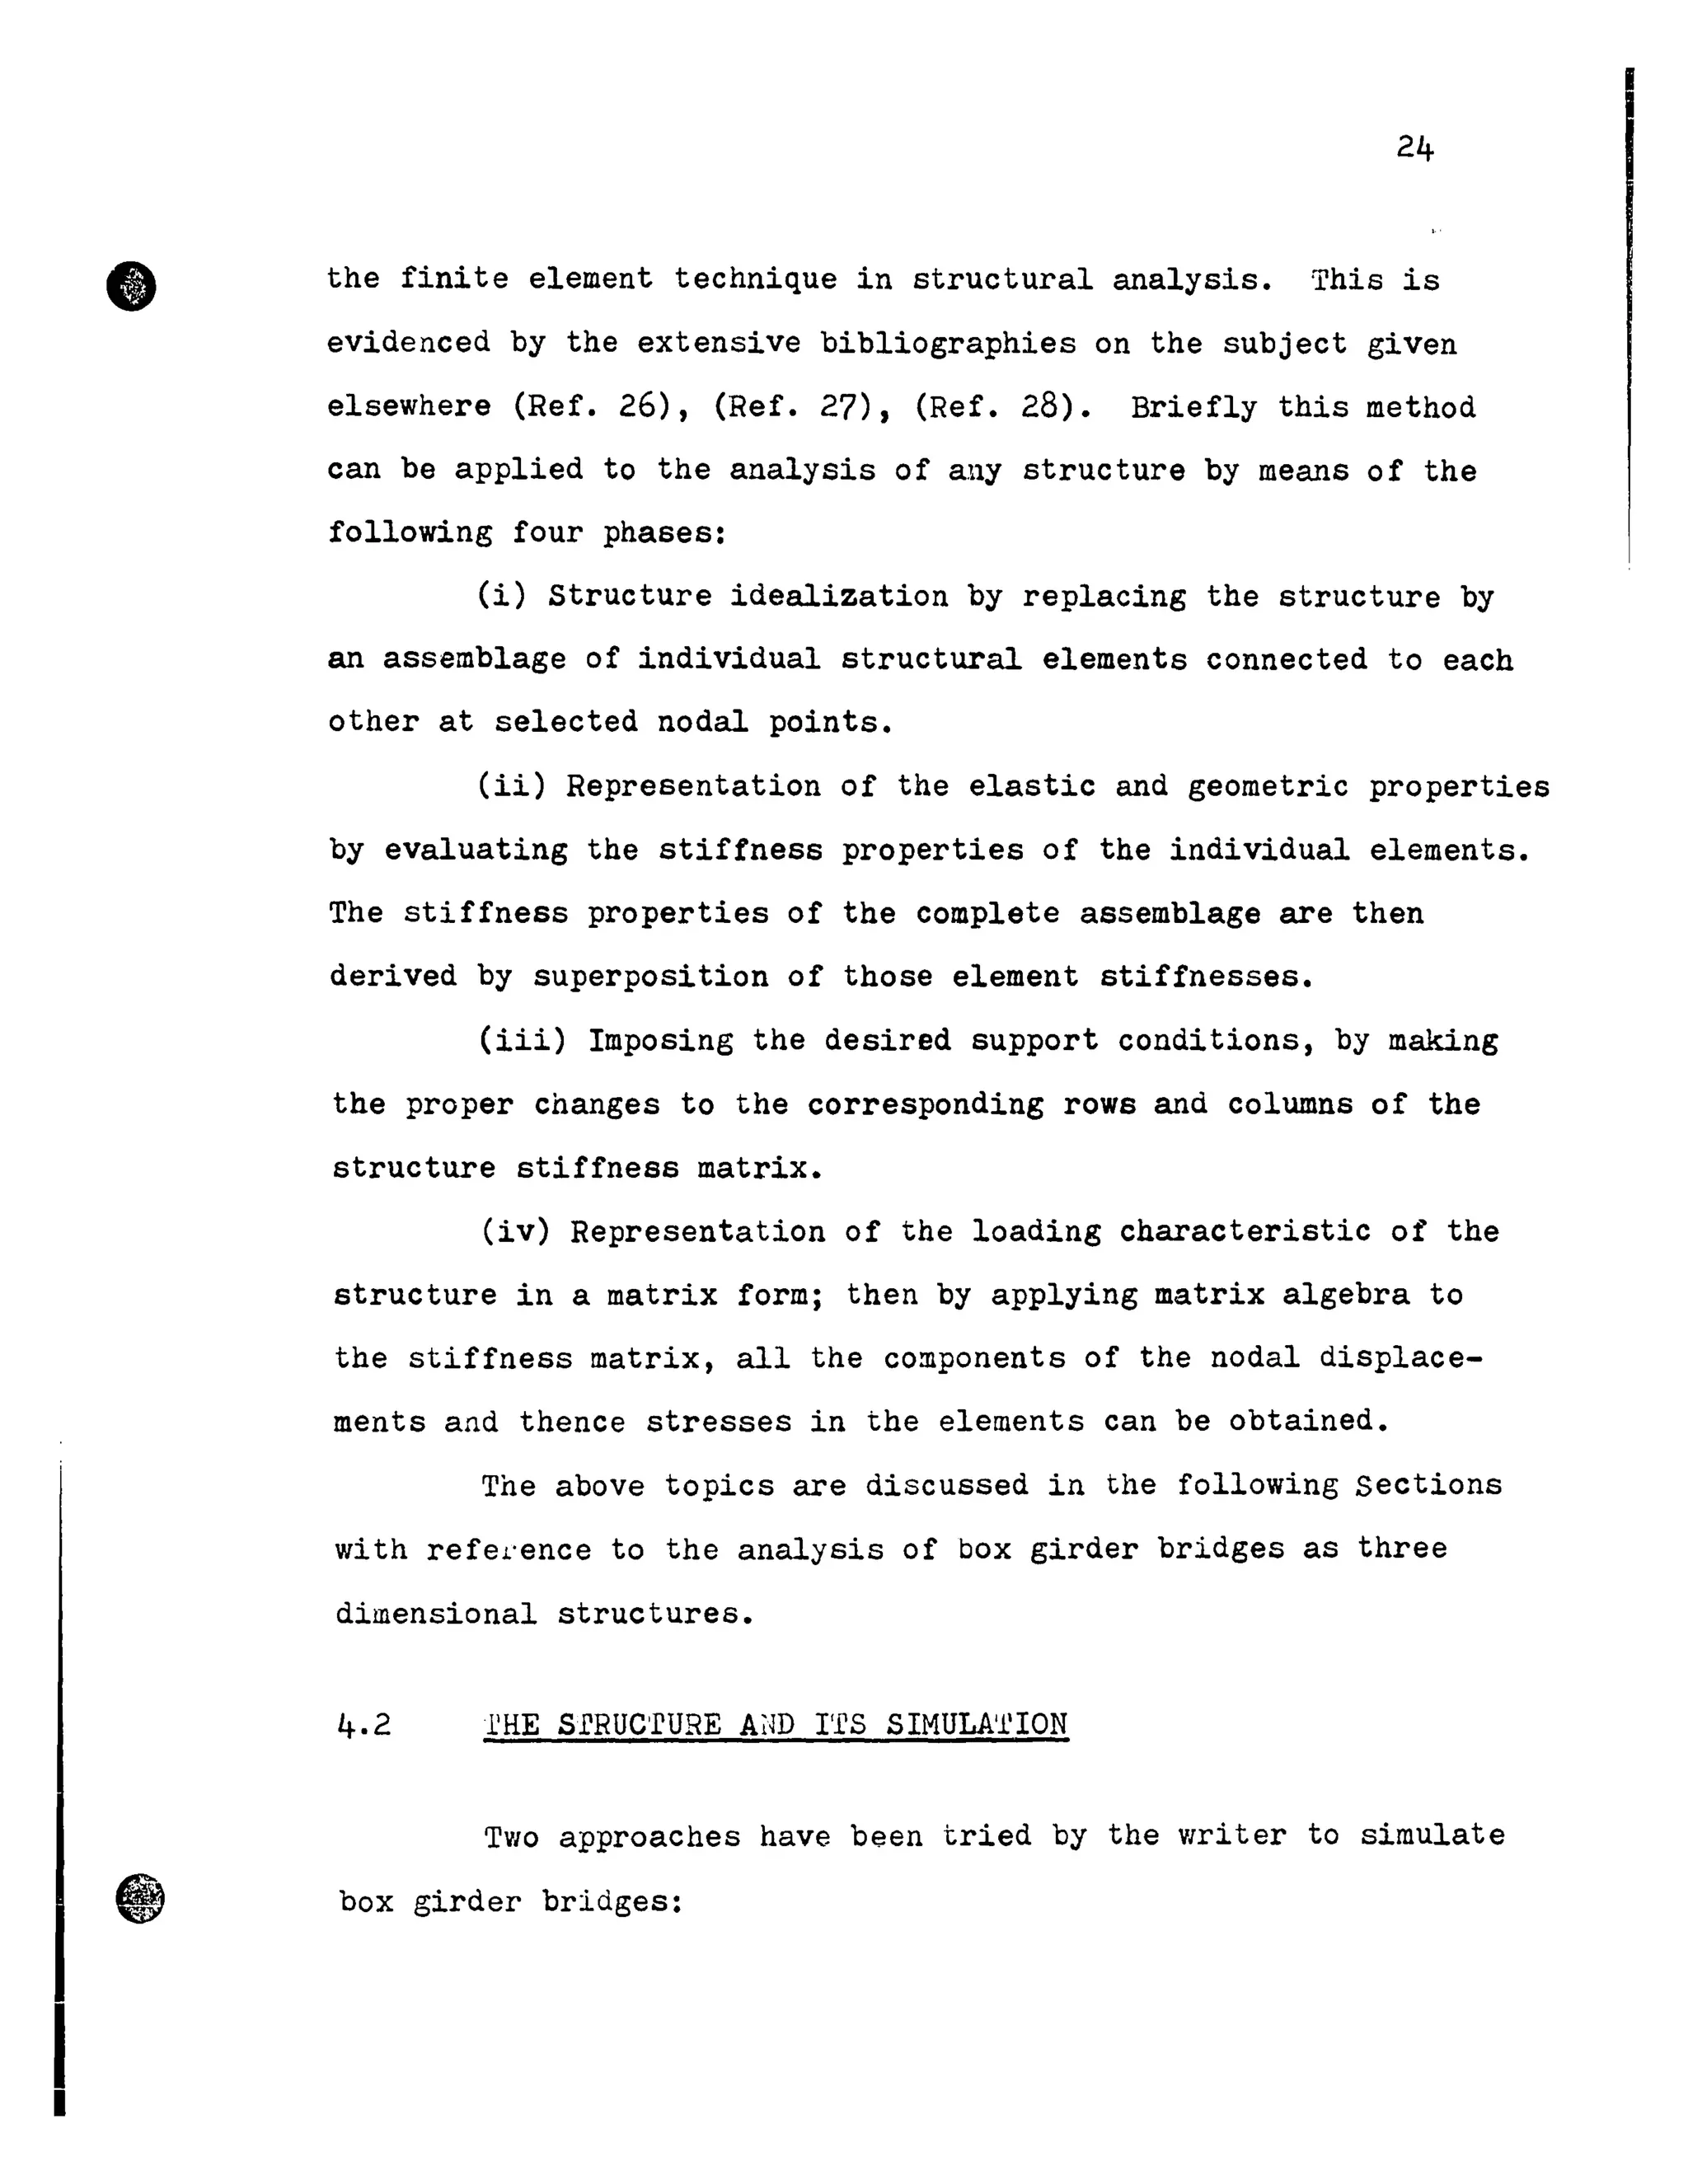
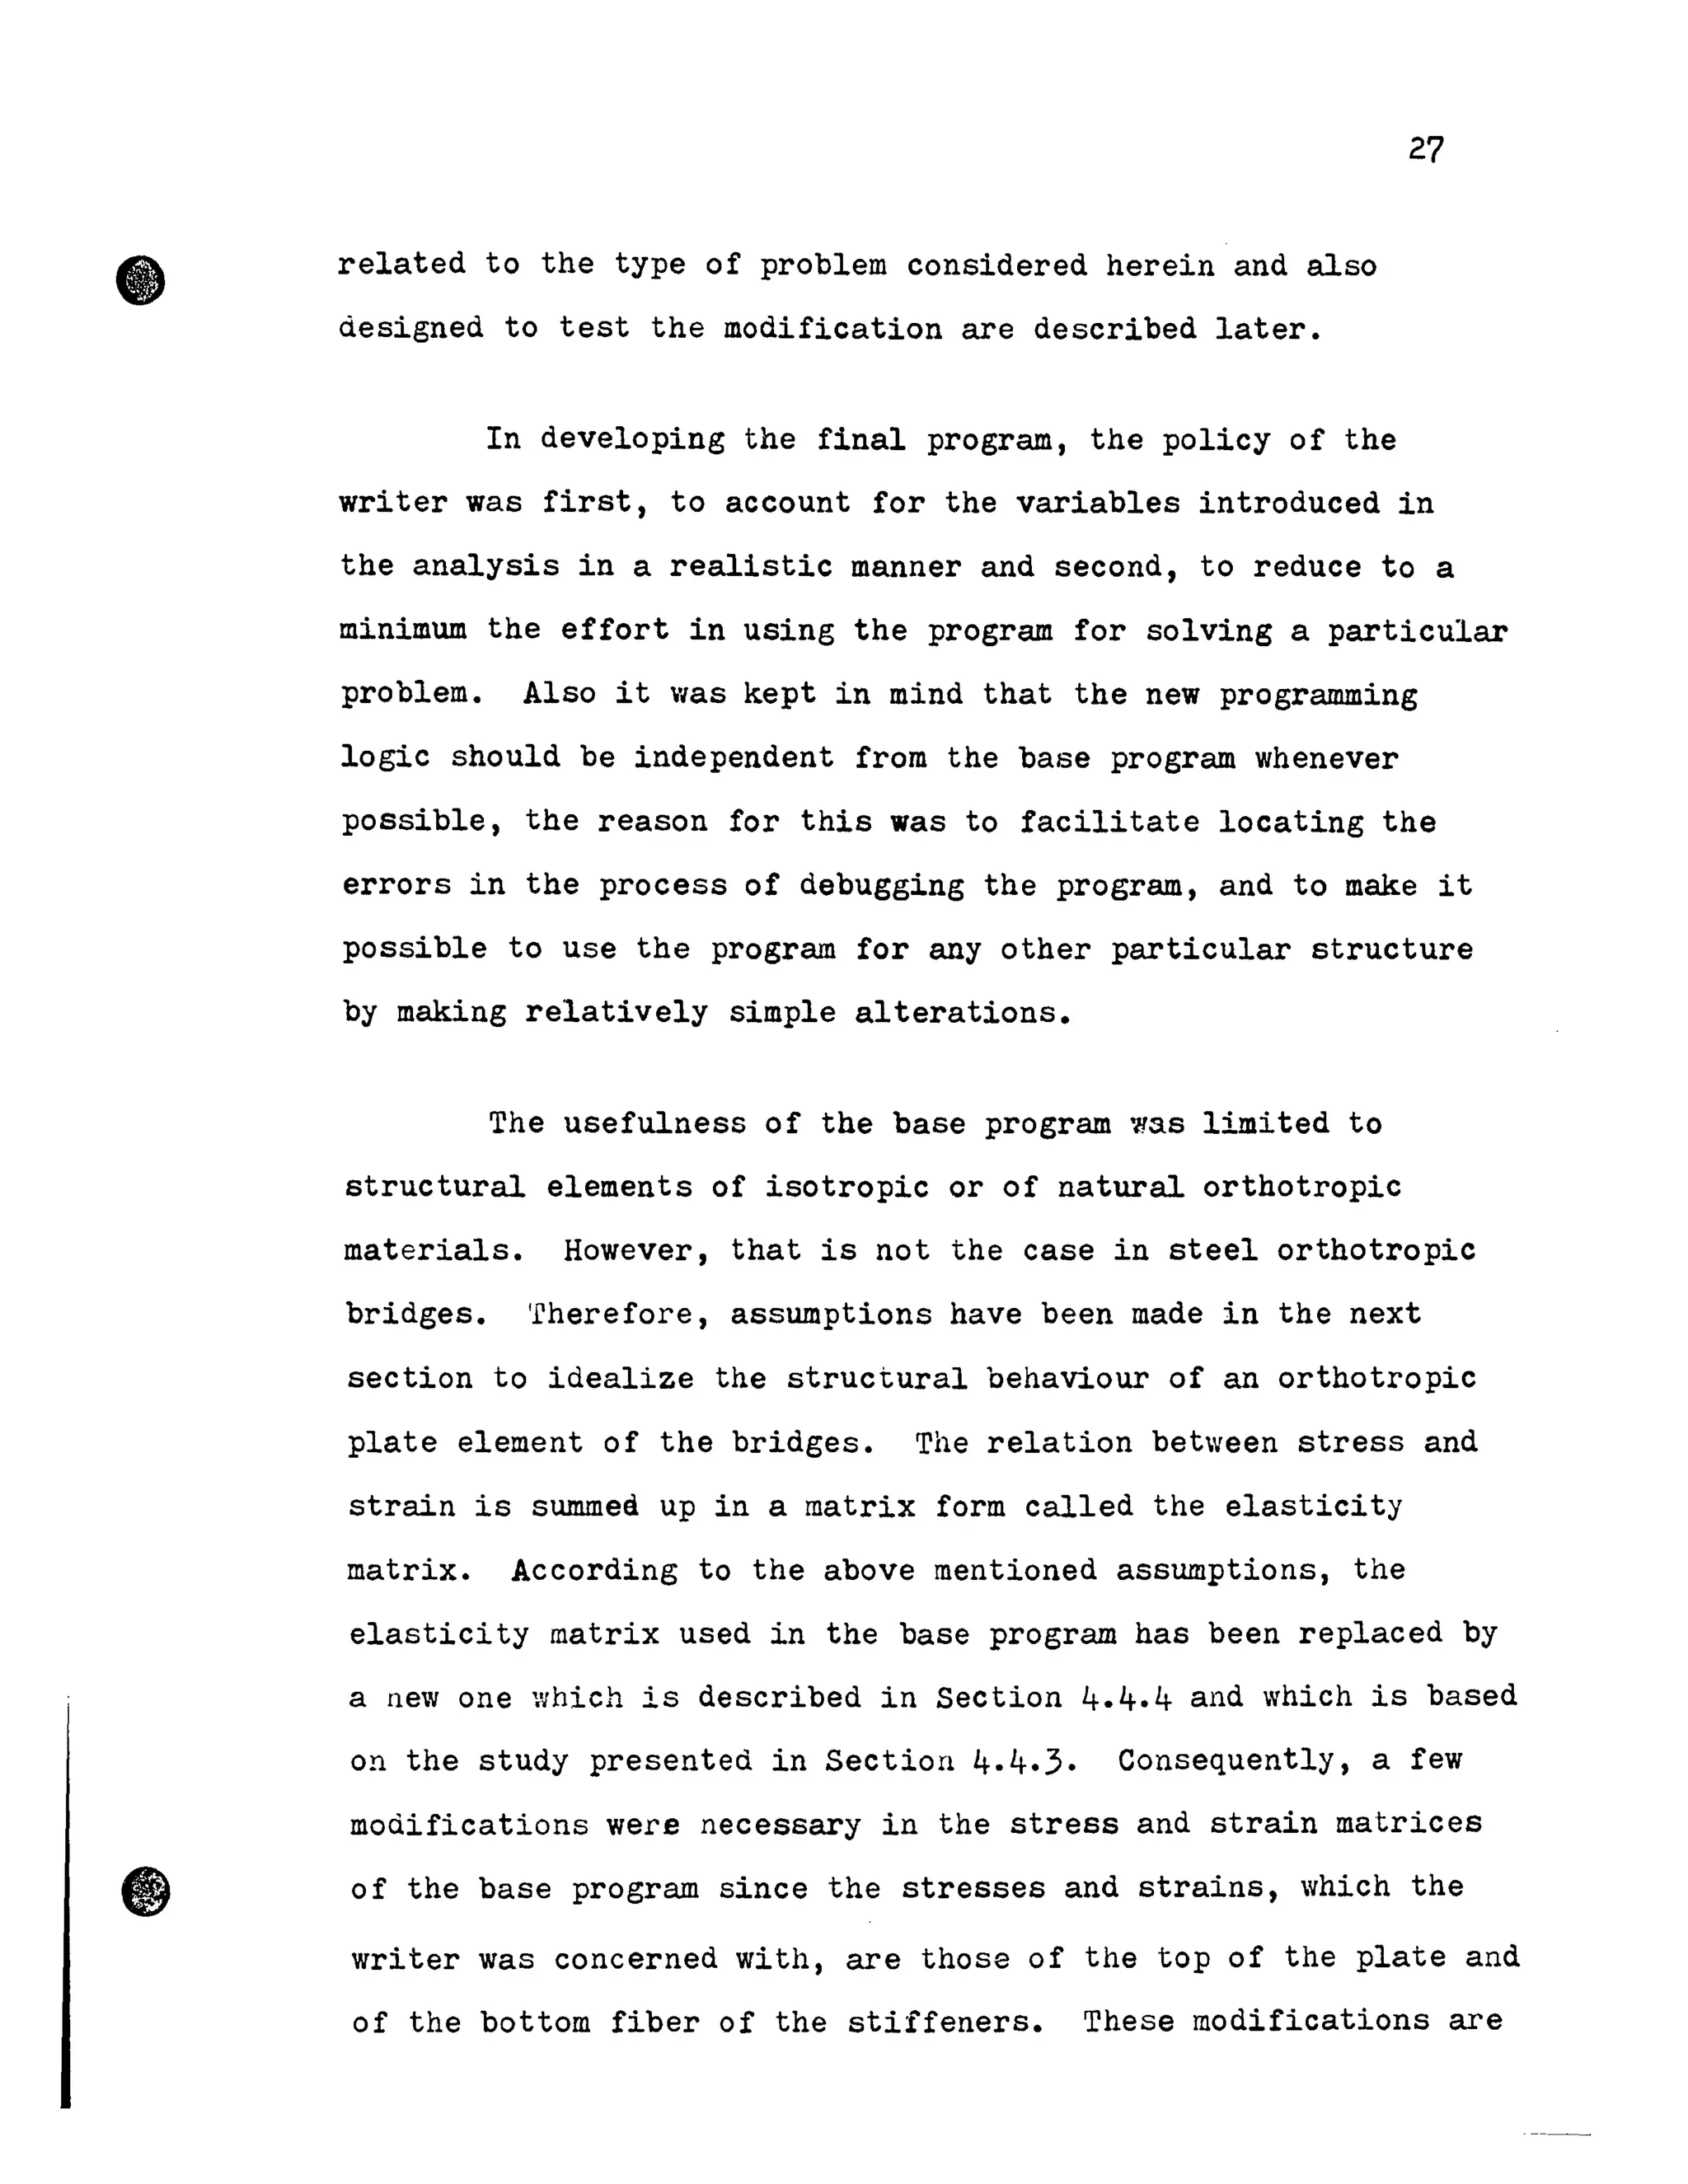
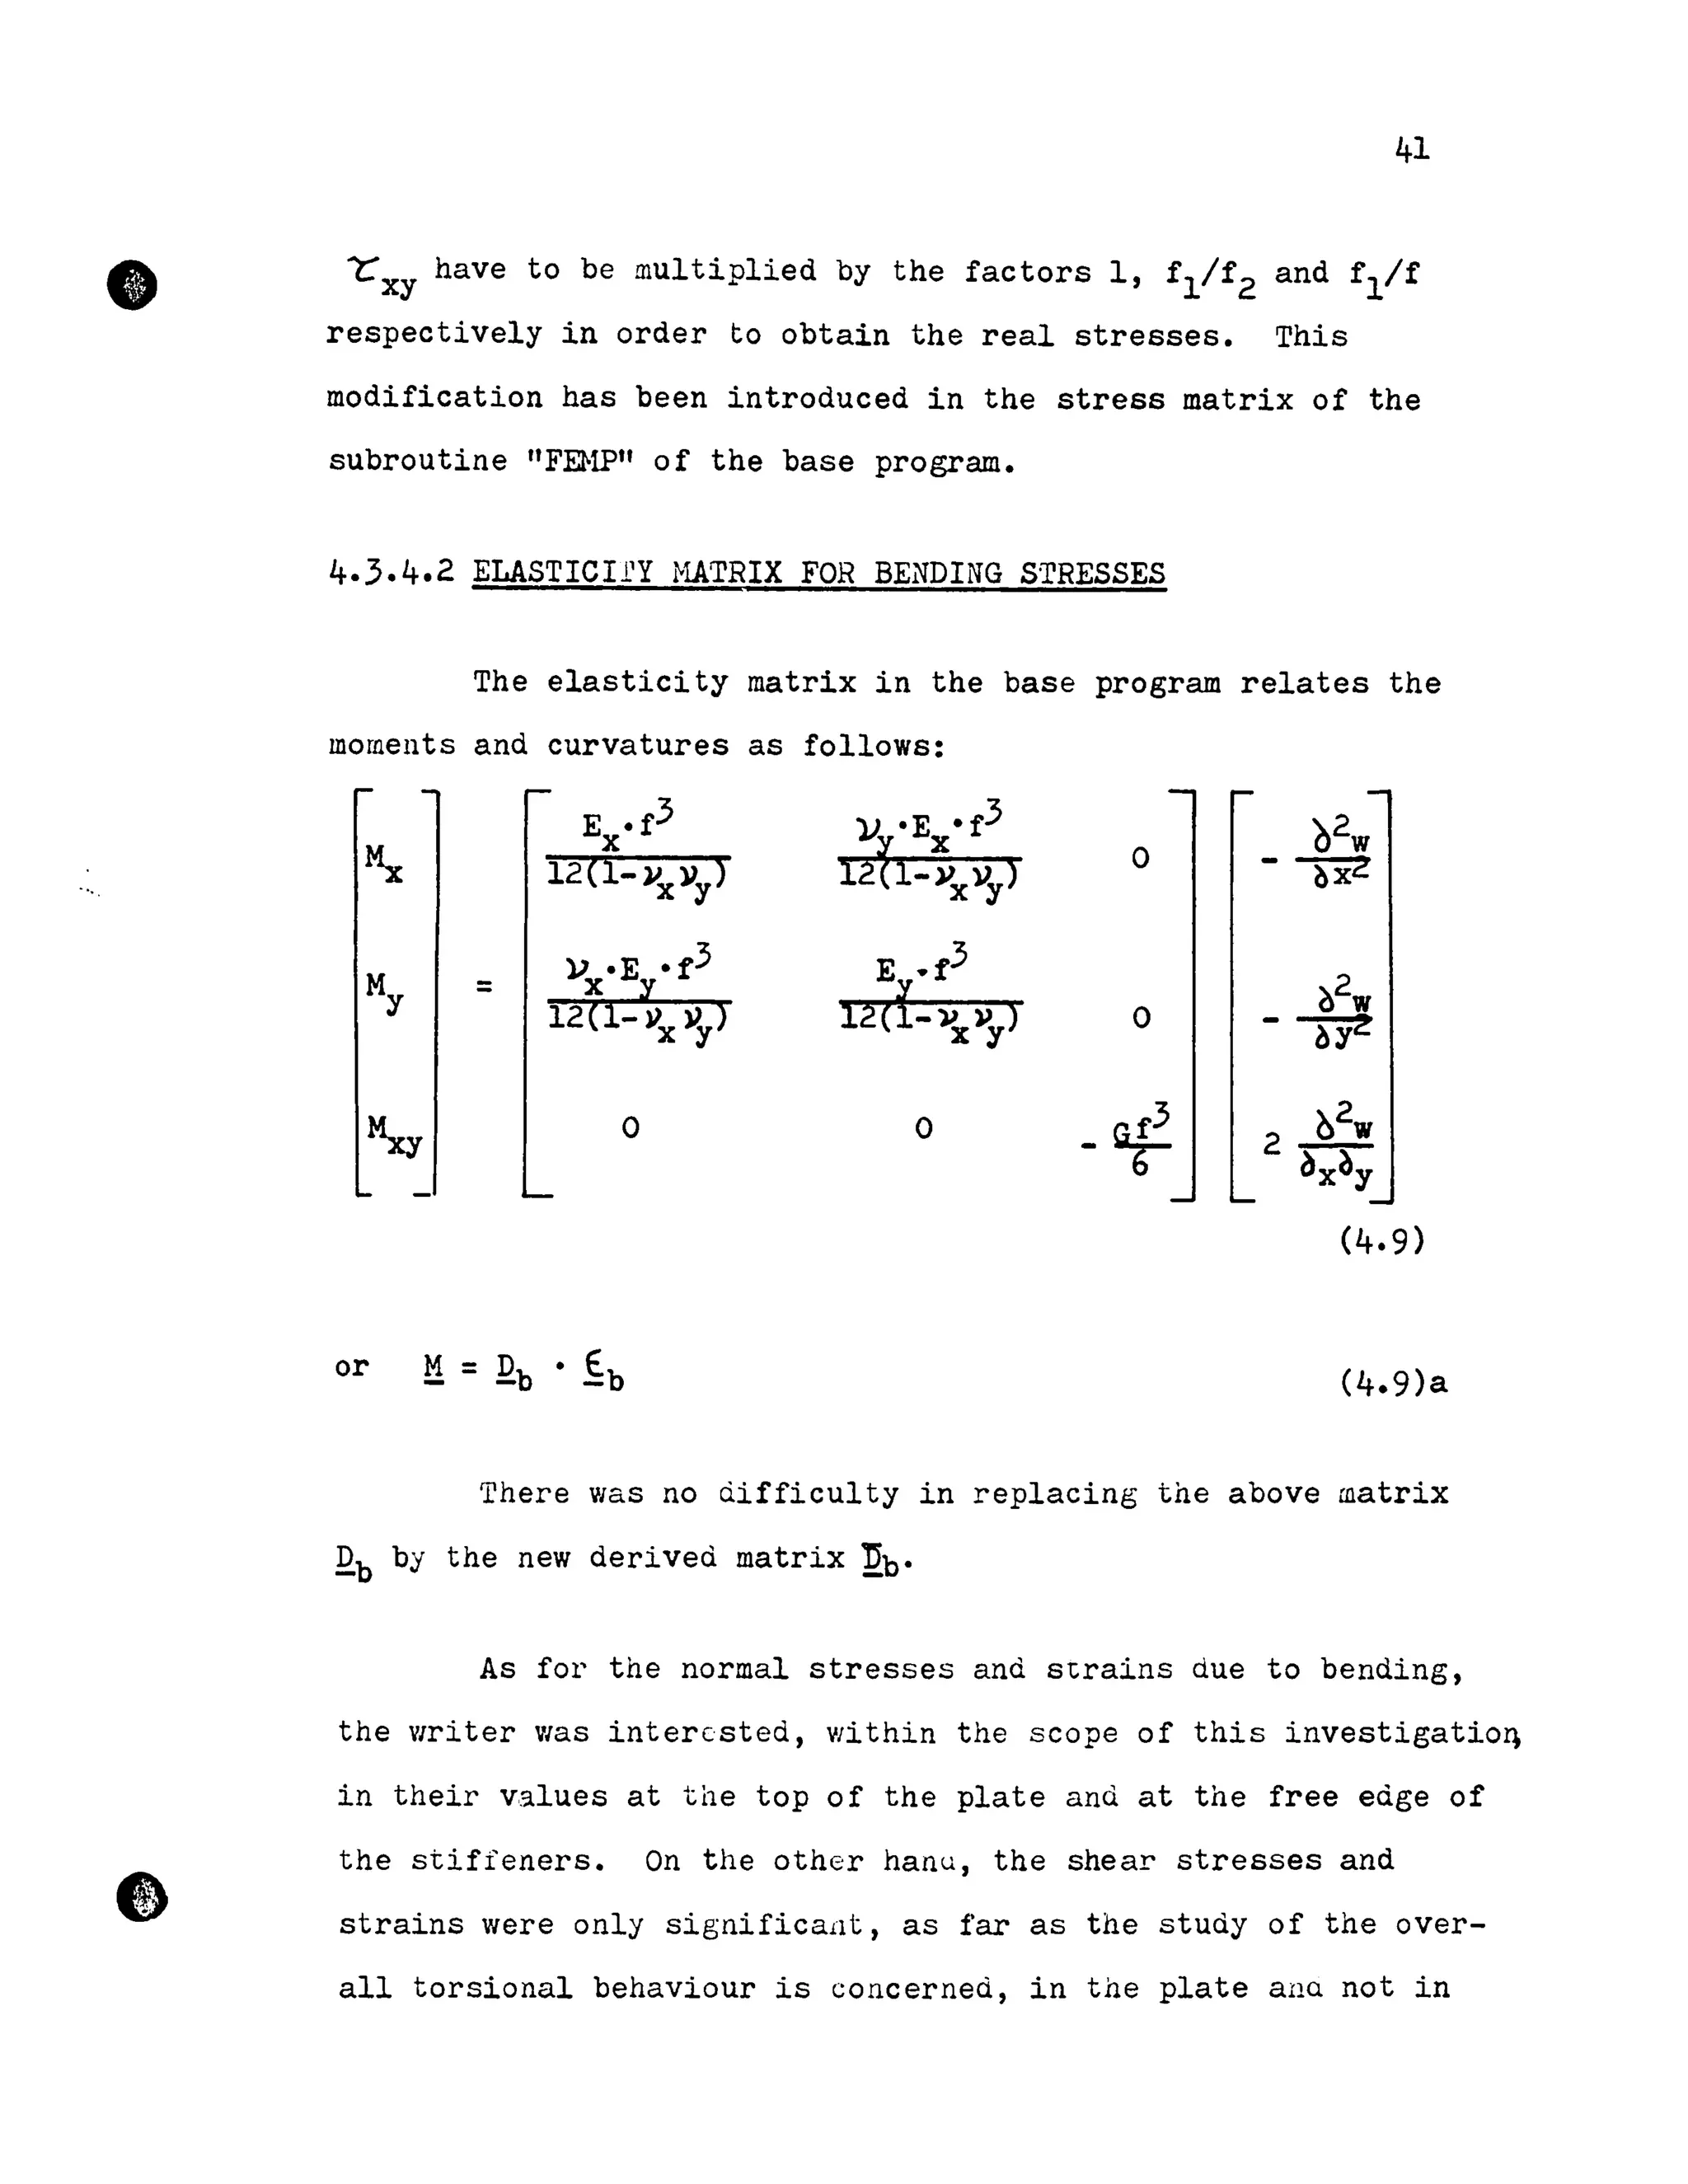
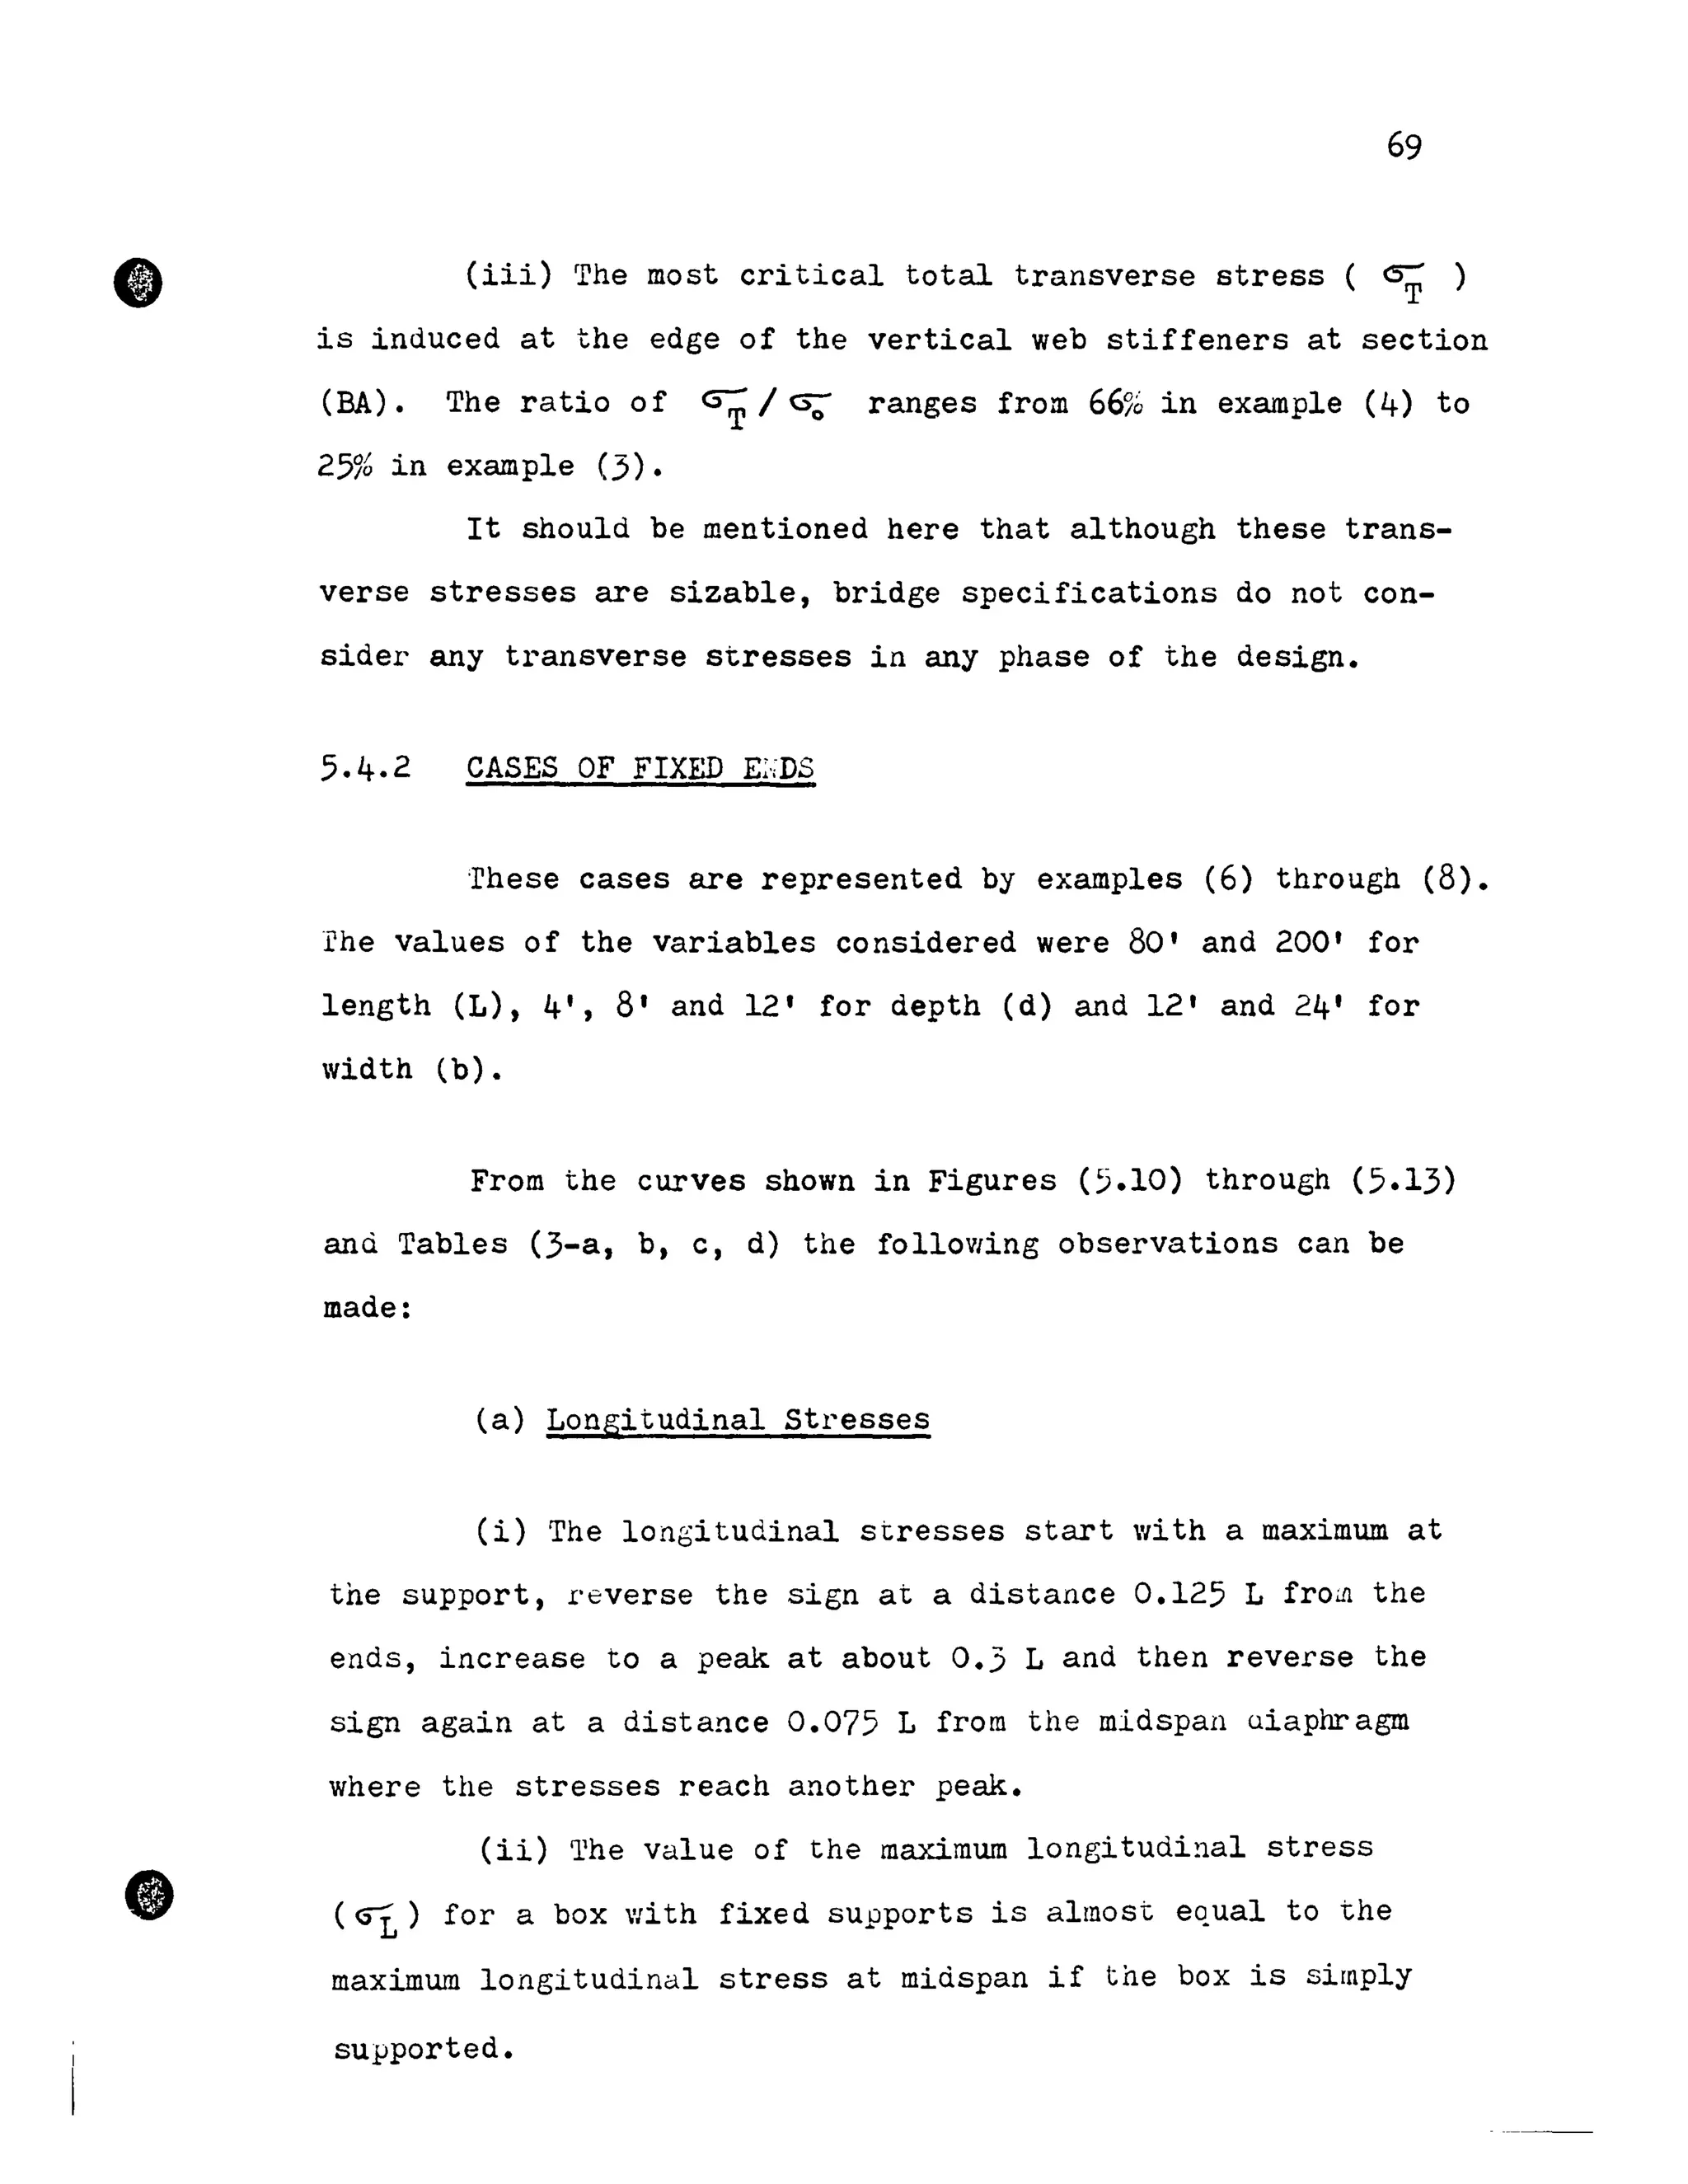
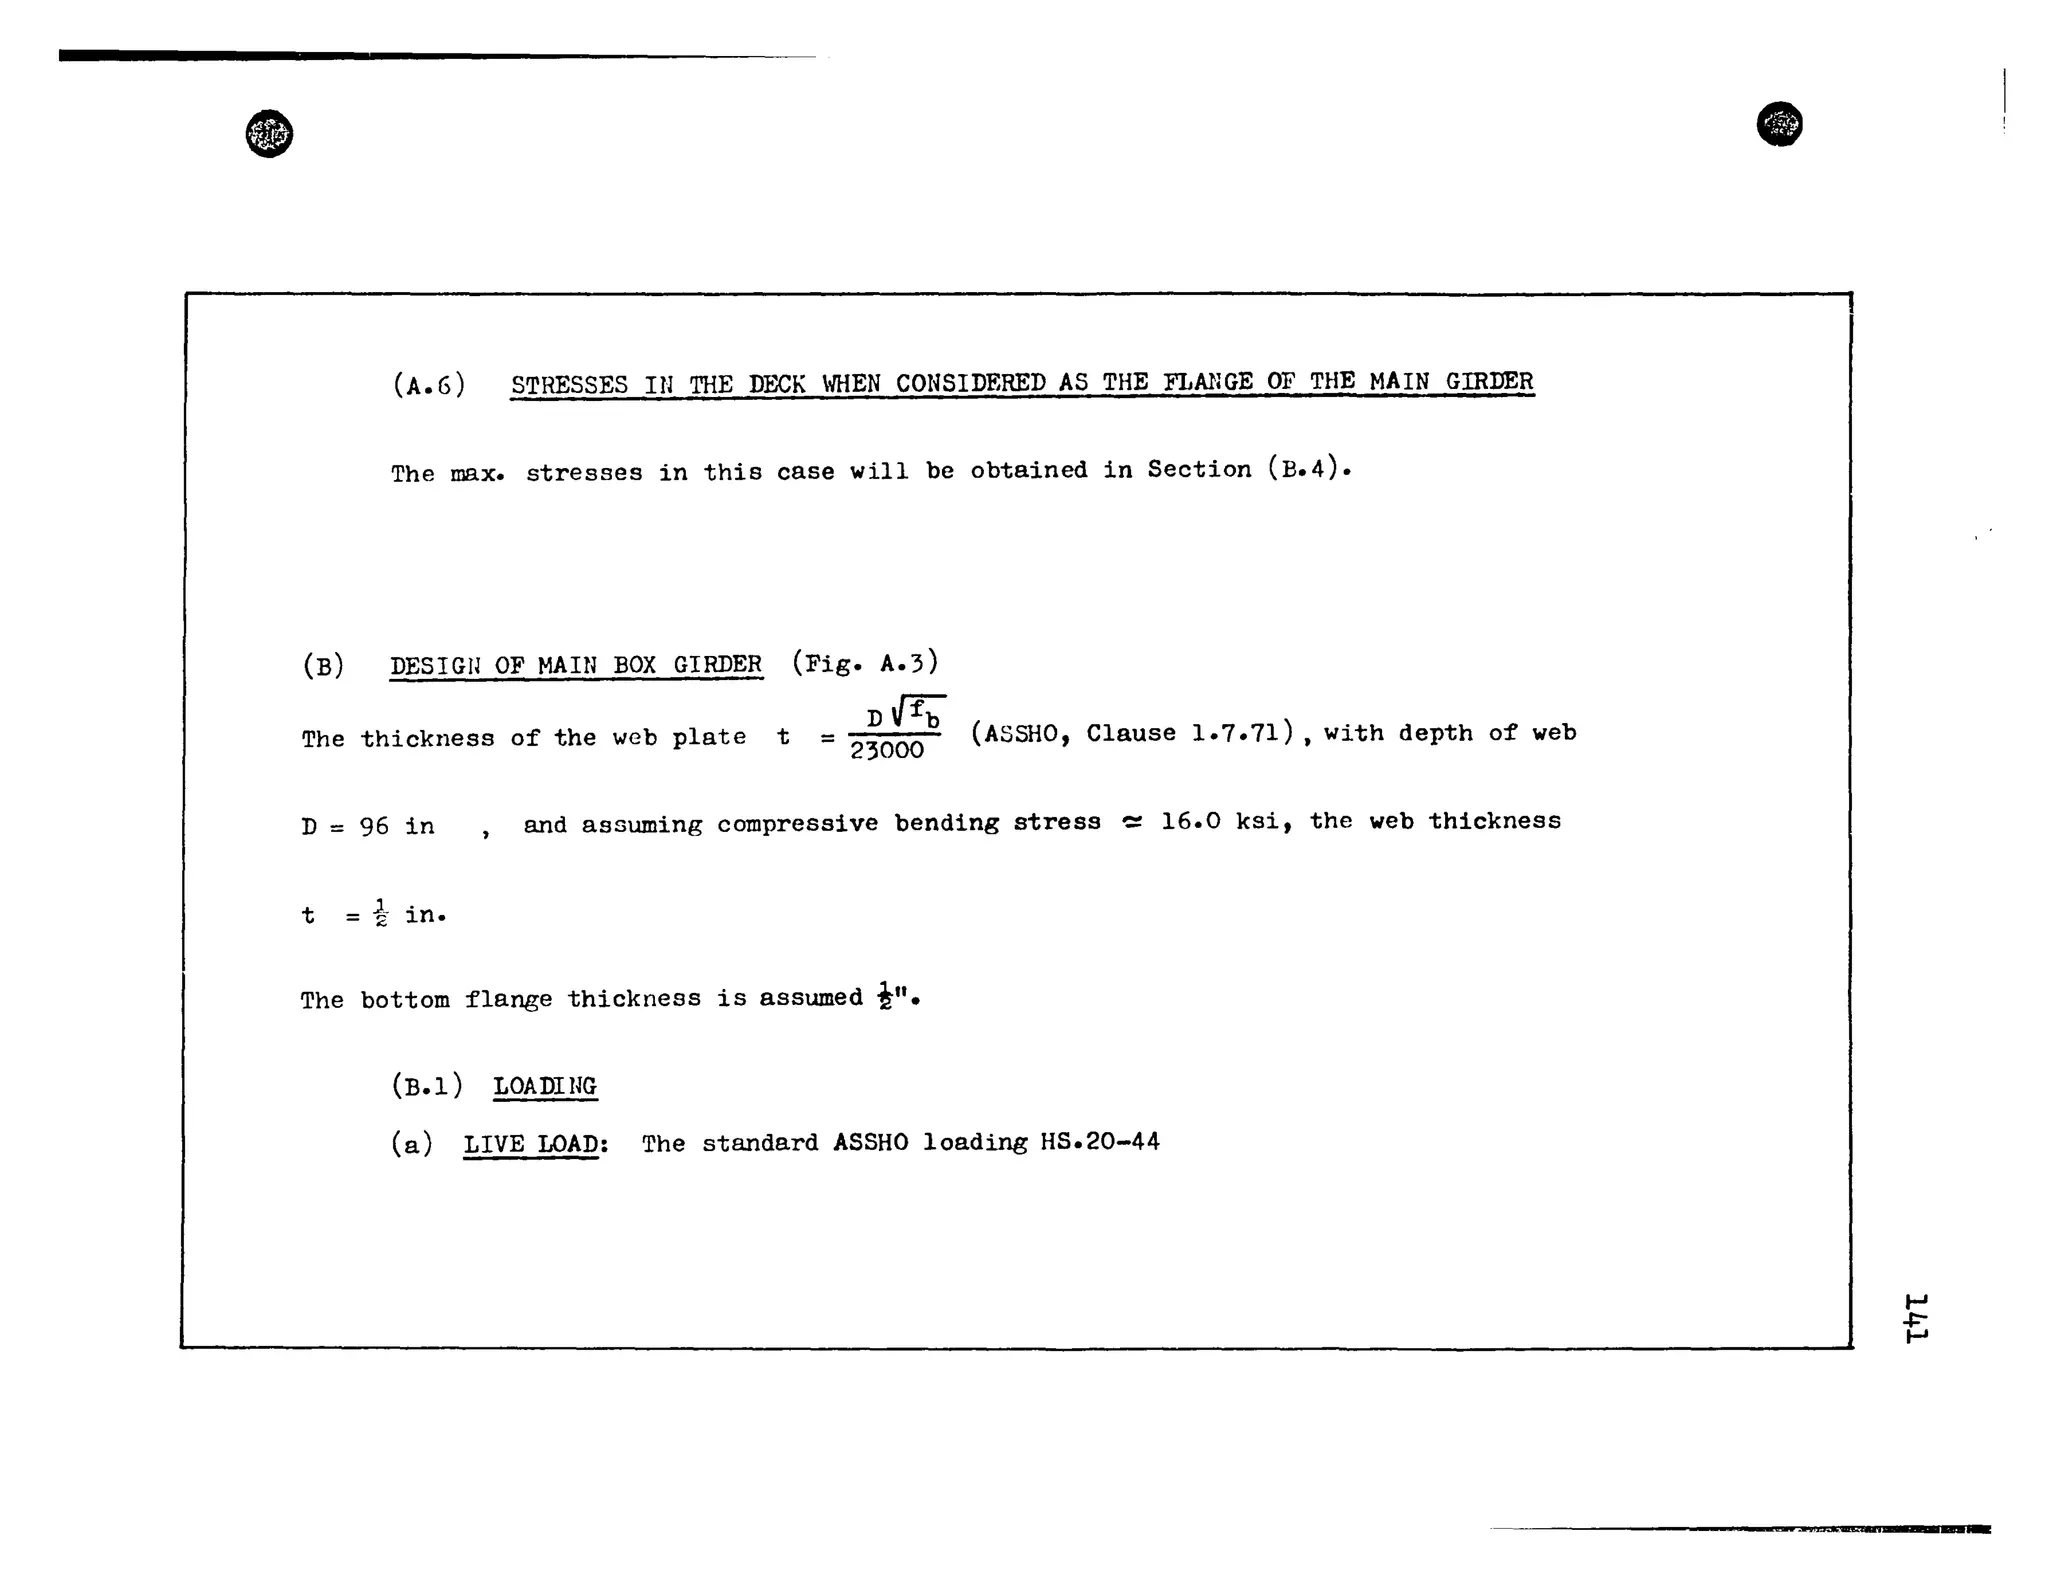
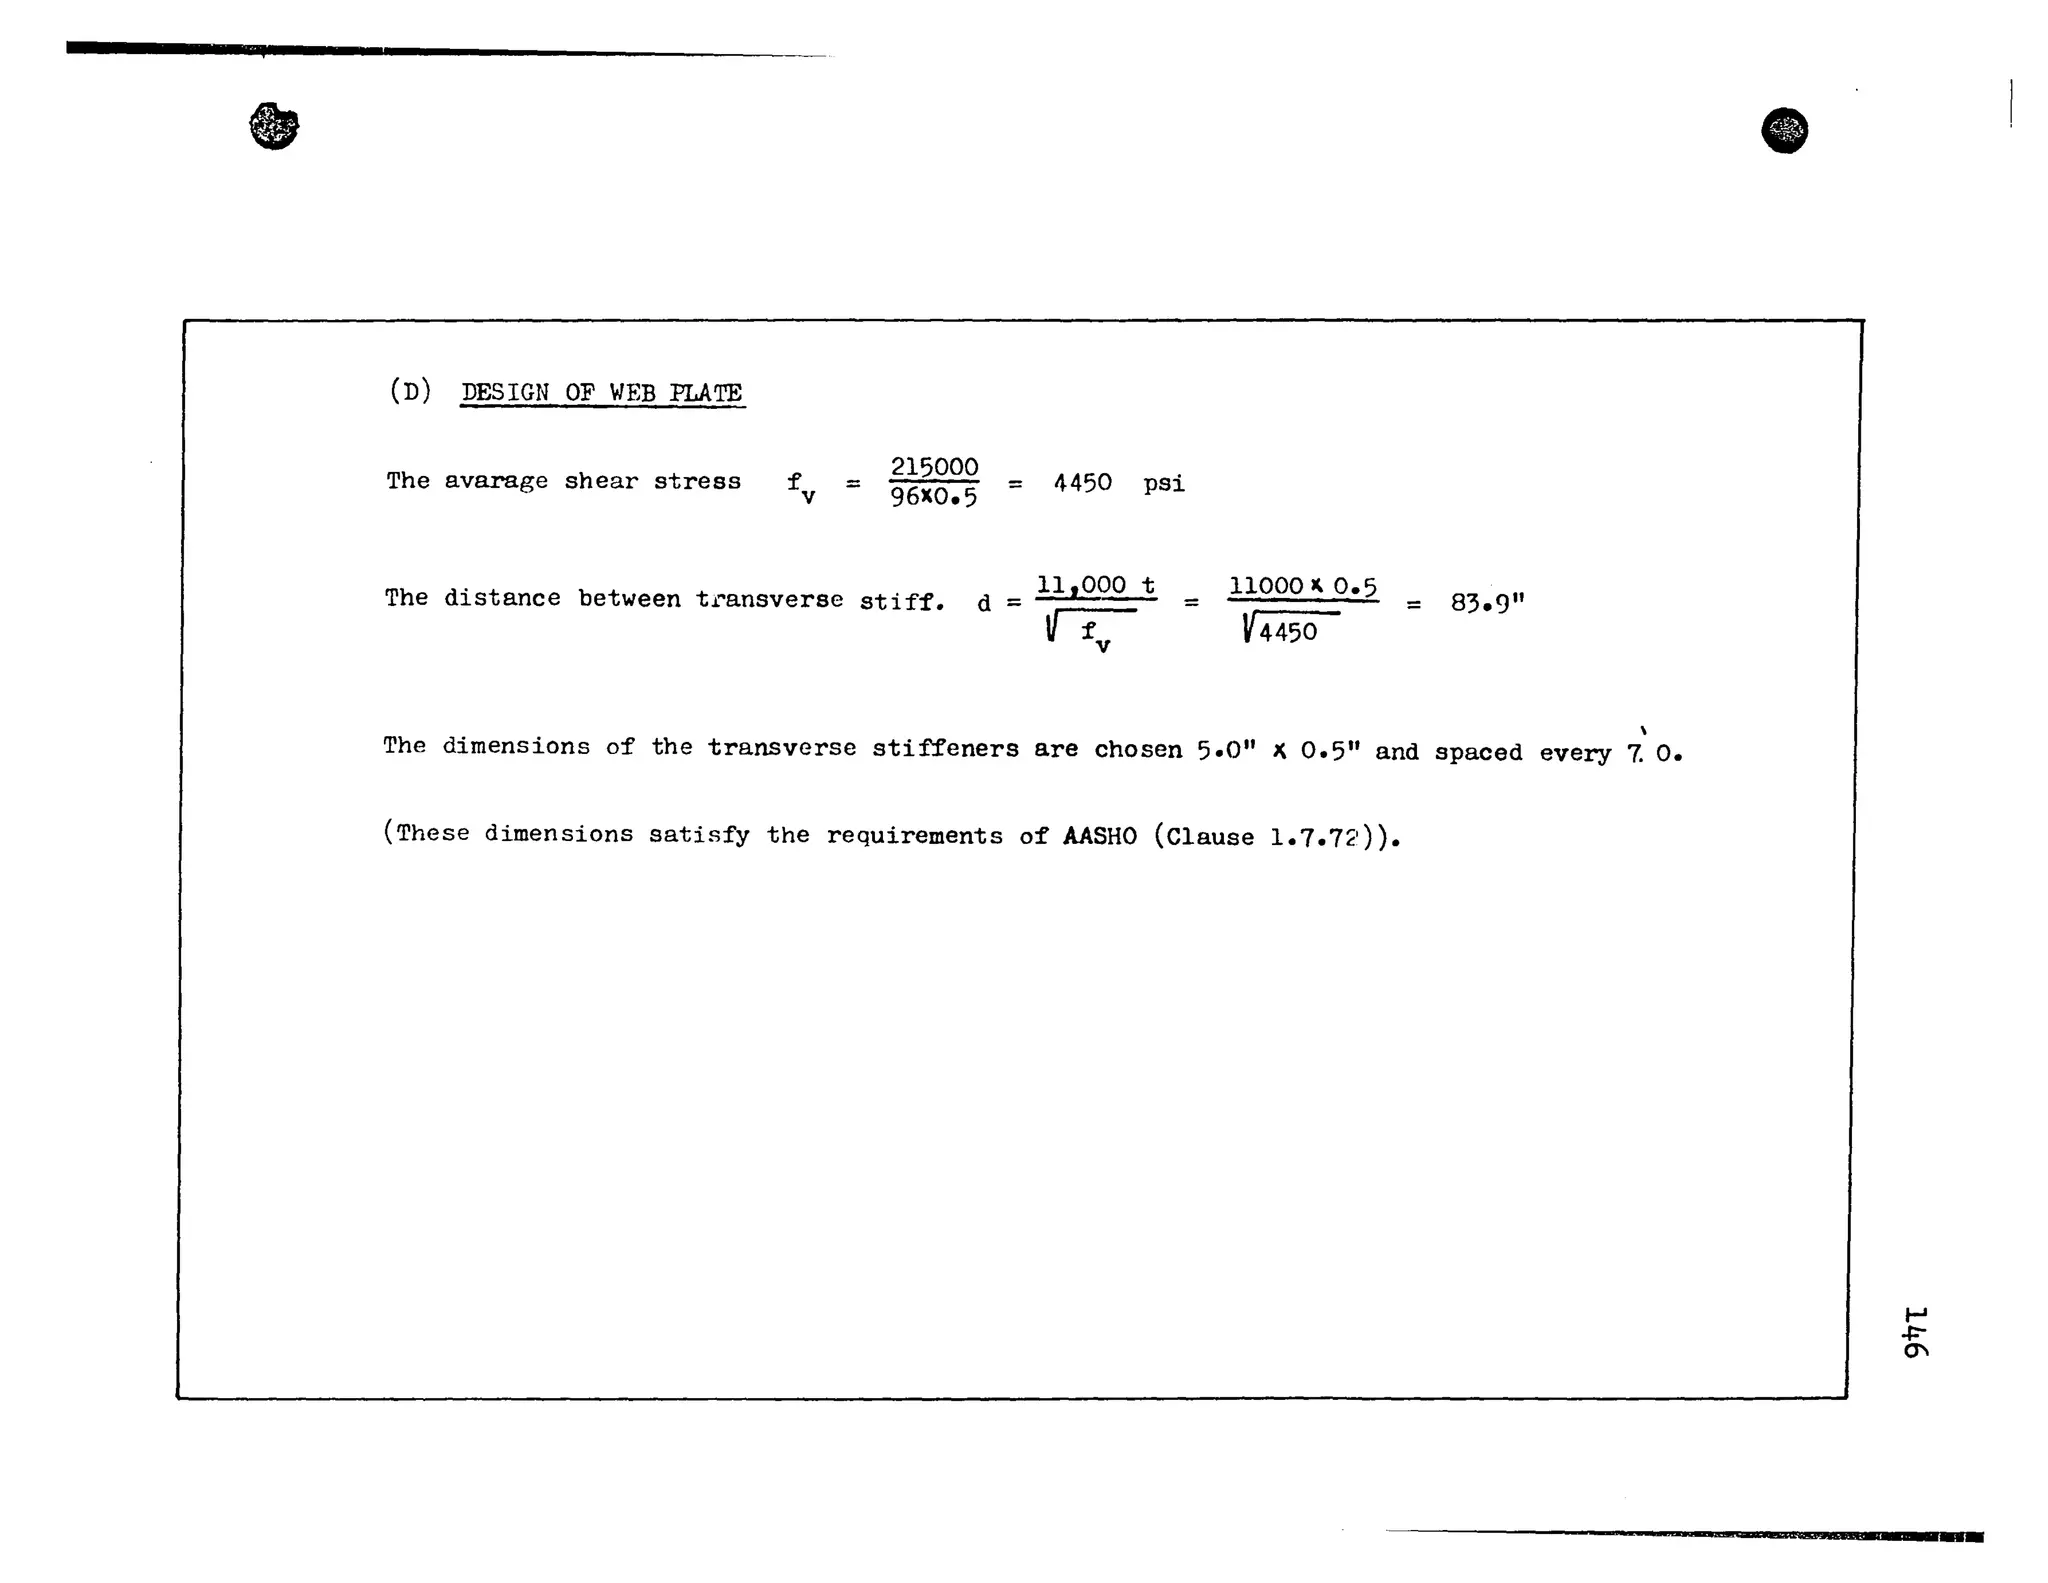
DESIGN BENDING M(l·1EUT M = MD•L + ~.L = 11250 + 9500 =20750 K.ft
(B.3) MAXIMUM· SHEARING FORCE:
The max. S.F. is at the supports
(a) Hax. S. ]t'. due ta D.L. sn.L 2.25~200 = 225 KIP
2 -
(b) Max. S.P. due ta L.L.
,
(See ASSHO page 299), for span = 200 and
impact factor = 1.155 SL.L = 90 J( 2 )( 1.155 = 205 KIP
Design shearing force for each web = 22S:205 = 215 KIP
(B.4) SECTION PROfi~RTIES
Area of the section = 446 in
2
Distance from top f1ange ta C.G. of section
Distance from bottom f1ange ta C.G. of section
Homcnt of inertia of the section
= 42.55 in )
= 53.95 in ~
= 839300 in
4
(See Fig. C.3)
e
1-'
~](https://image.slidesharecdn.com/torsionalbehaviourofsinglecellboxgirderbridges-140613171733-phpapp01/75/Torsional-behaviour-of-single-cell-box-girder-bridges-160-2048.jpg)

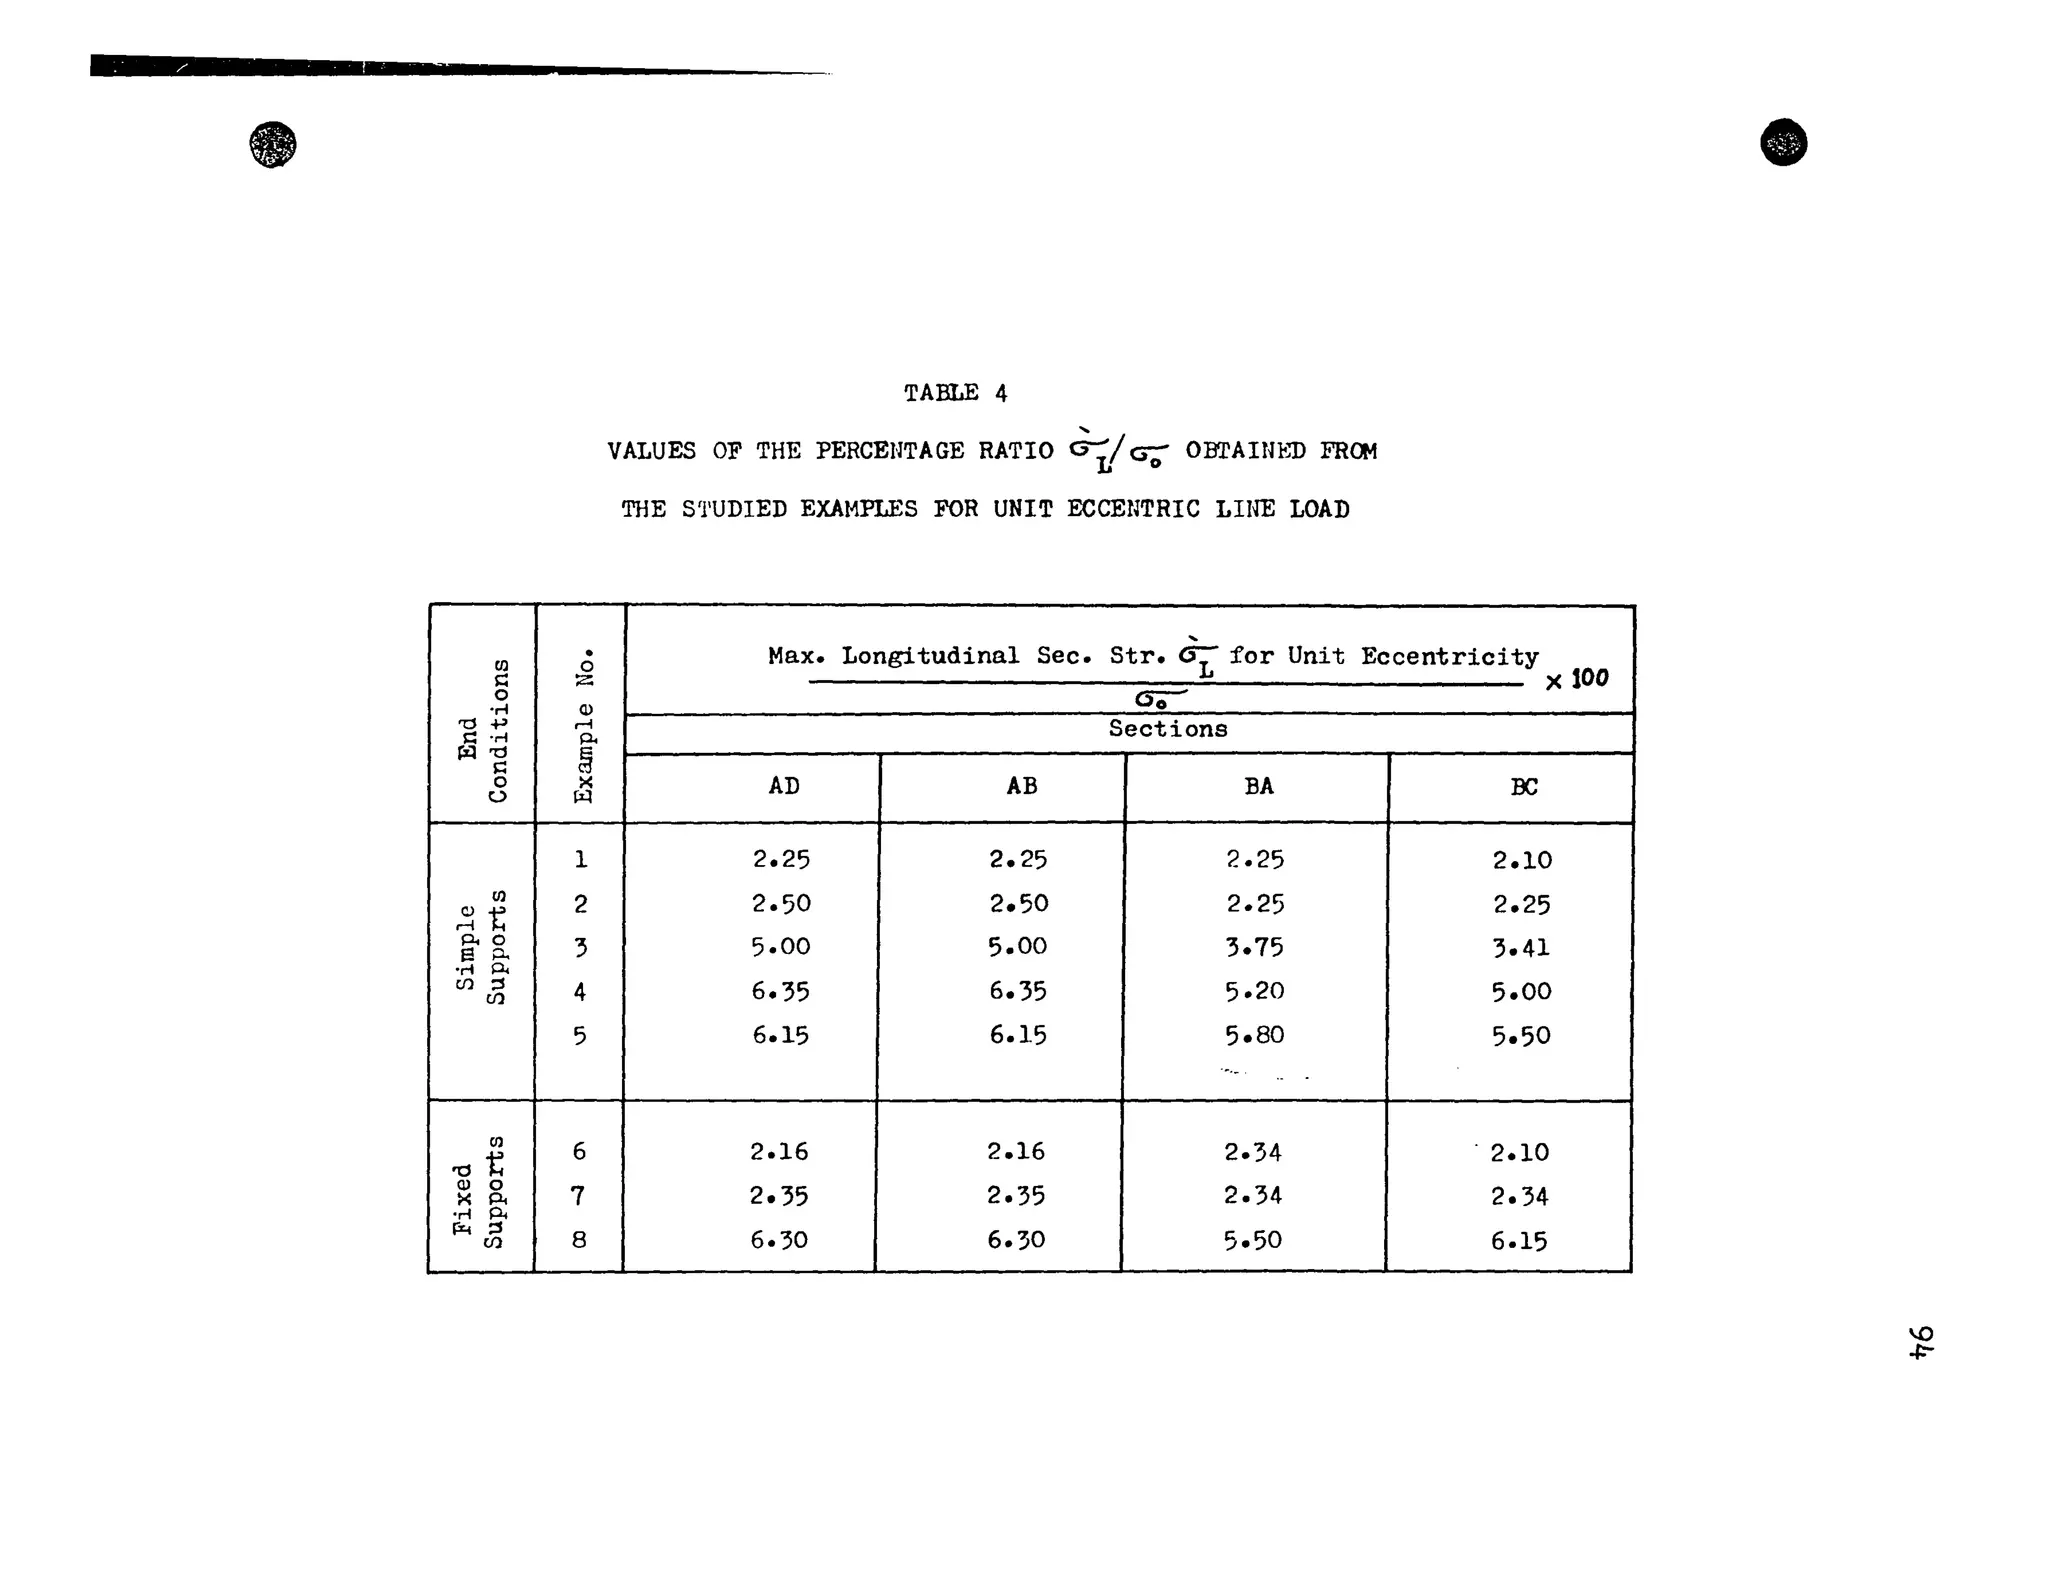
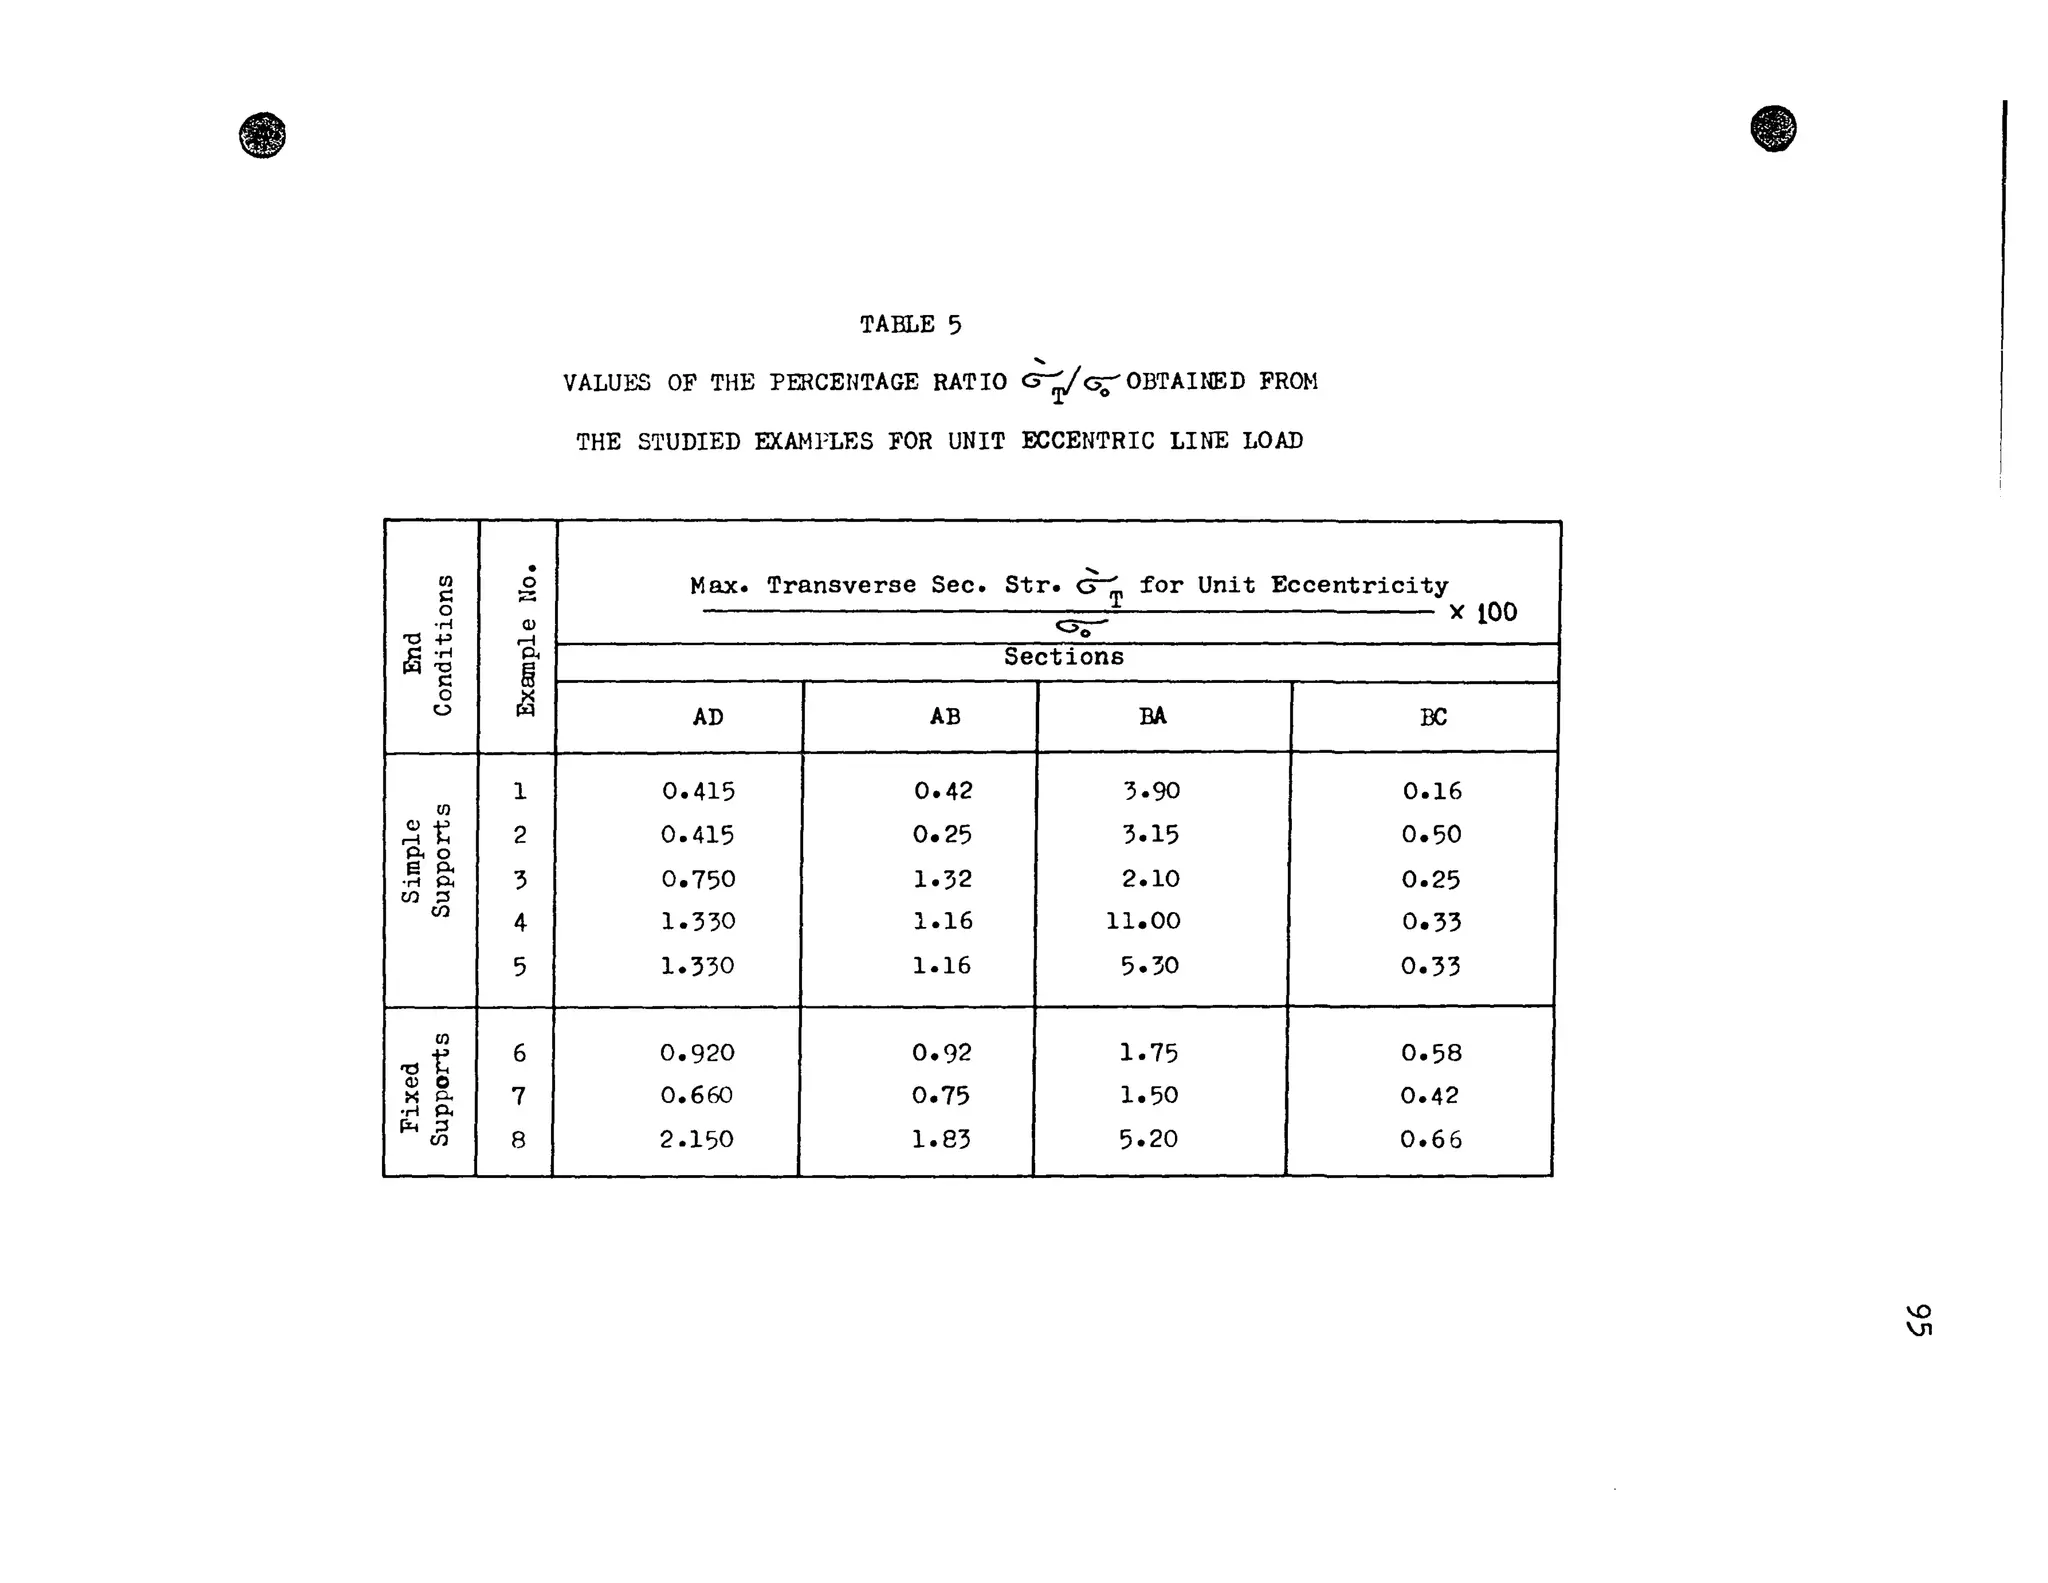
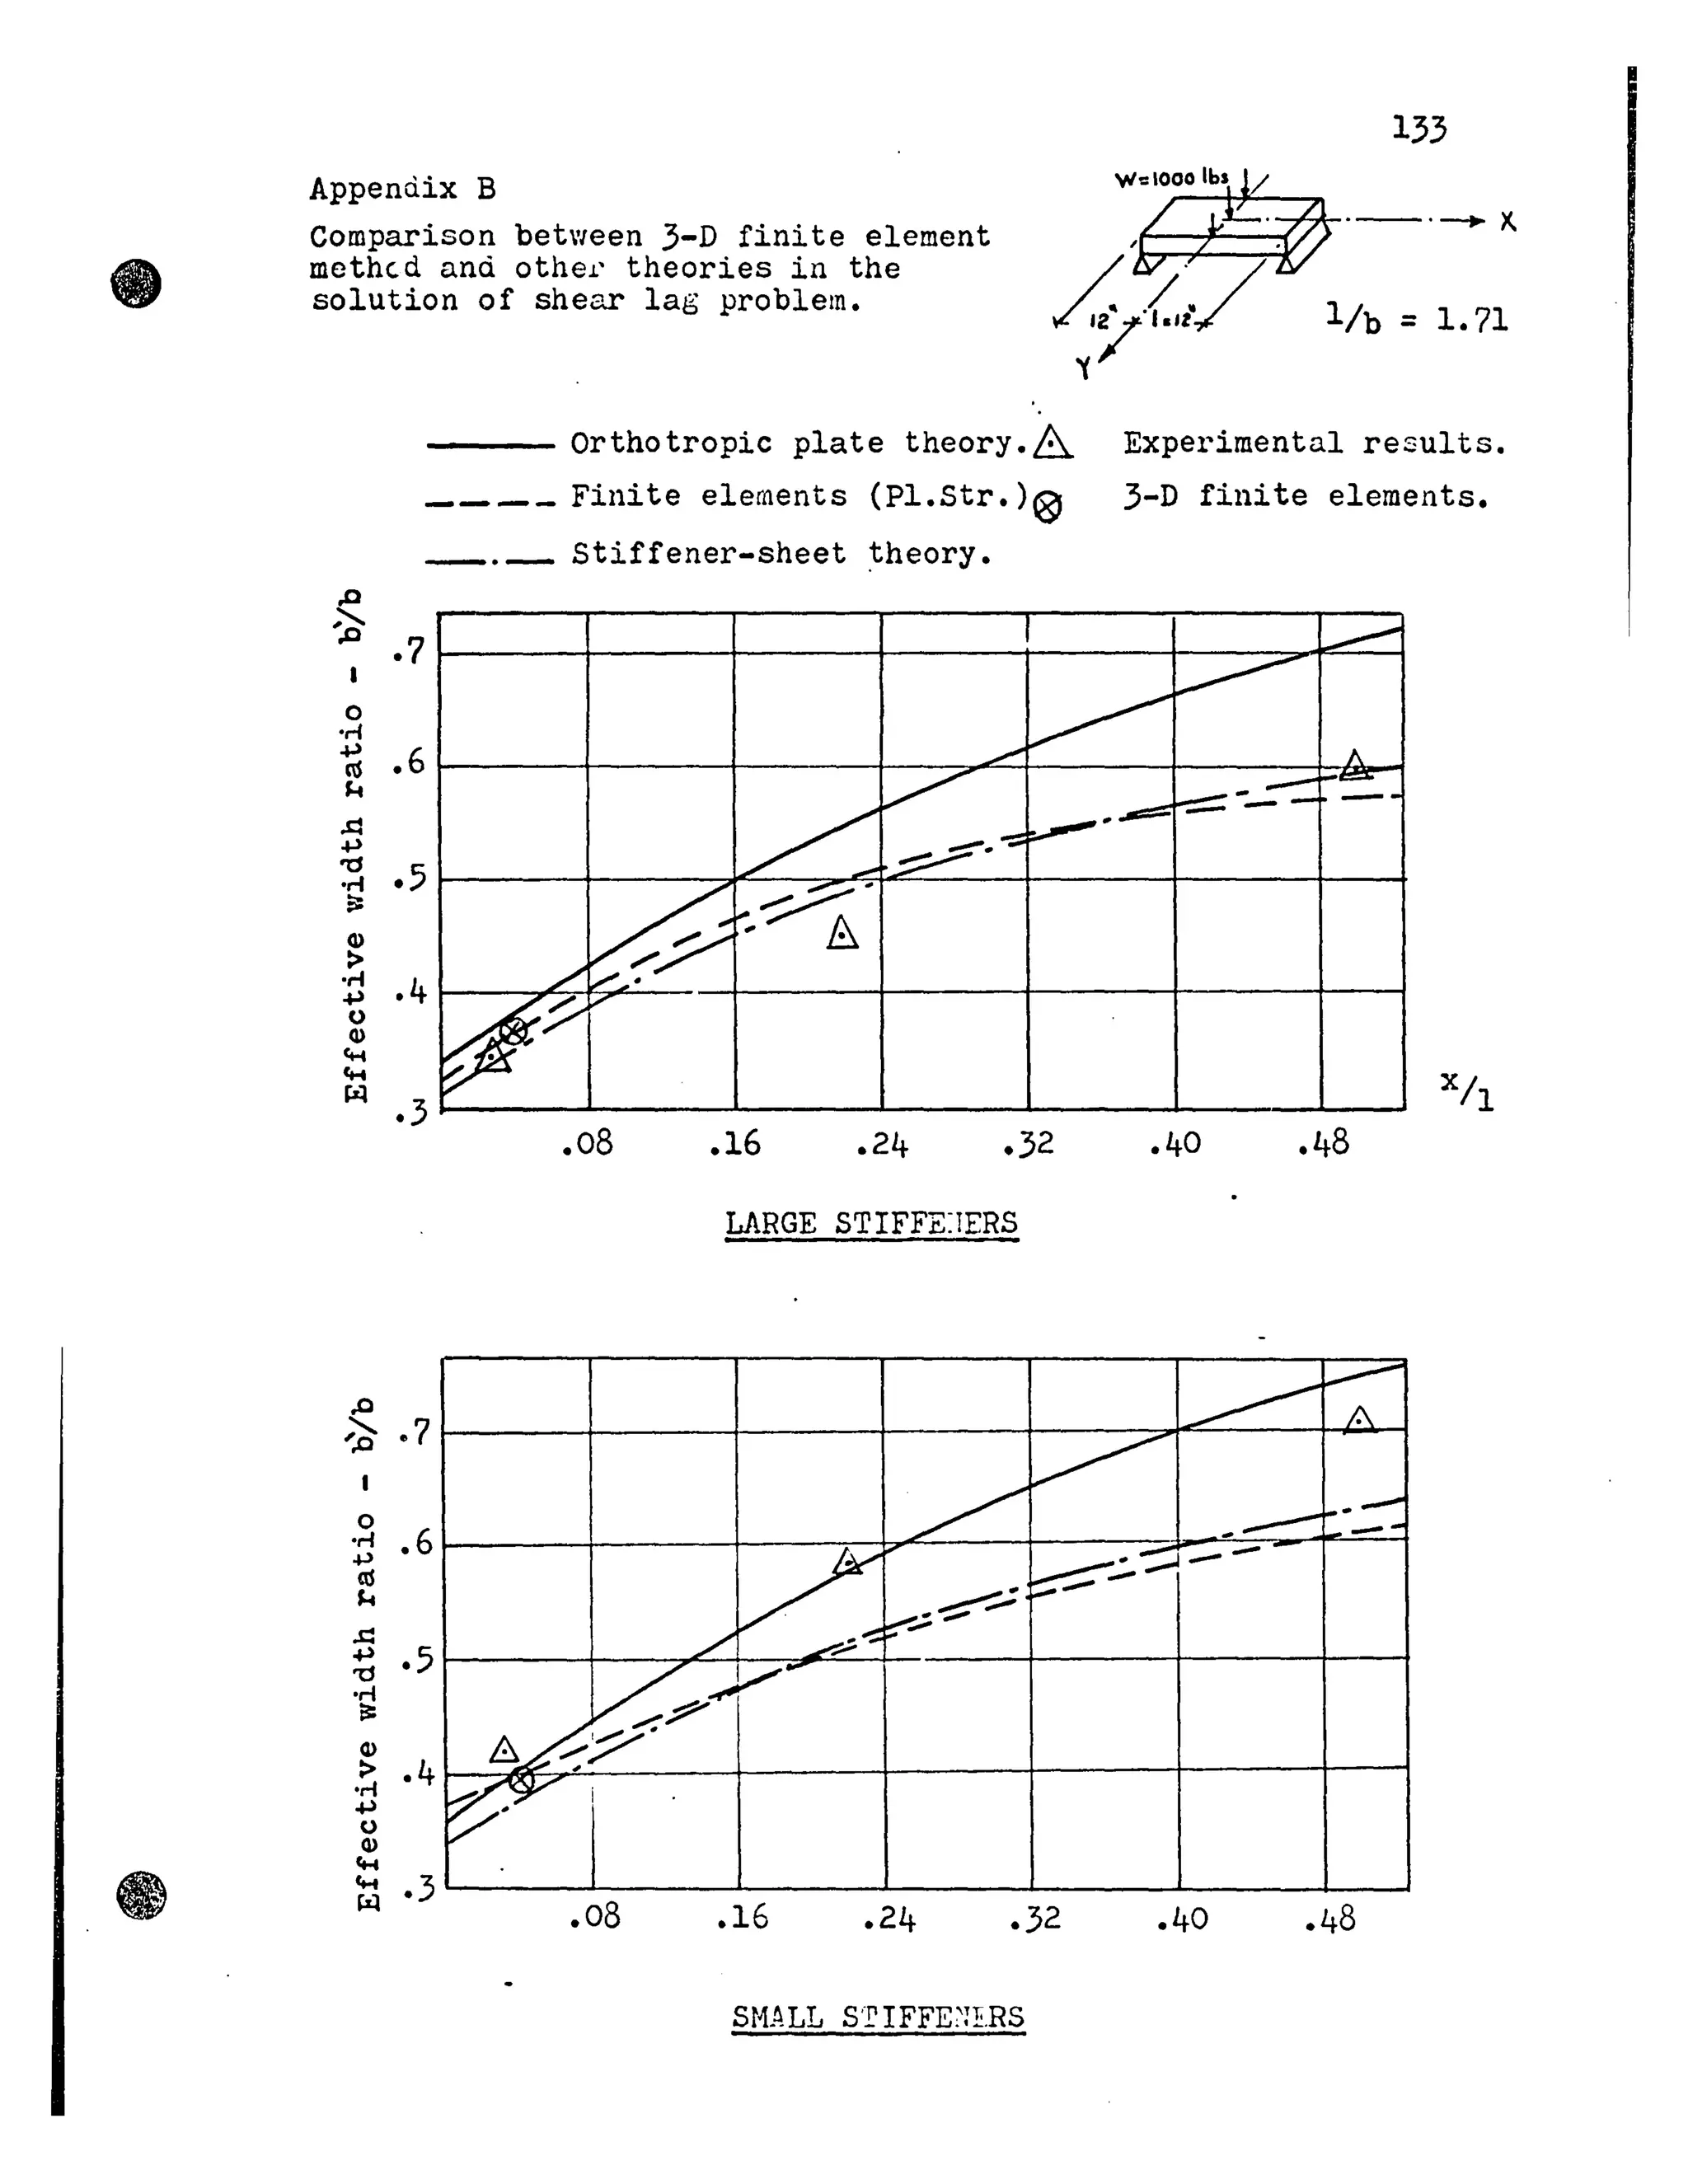
This thesis investigates the torsional behavior of single cell box girder bridges through finite element analysis. The author develops a finite element computer program to analyze orthotropic steel box girder bridges under uniform torsional loads. The program is verified by comparing results to theoretical solutions. The program is then used to study the stresses in several example bridges with different geometry and boundary conditions. The results demonstrate that torsional bending stresses, which are often ignored in design, are important to consider. The author makes recommendations for accounting for torsional deformations in bridge design based on the parametric studies.


