The document provides an overview of trends in the Texas retail market. Key points include:
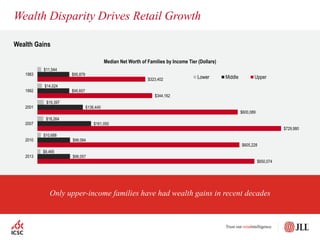
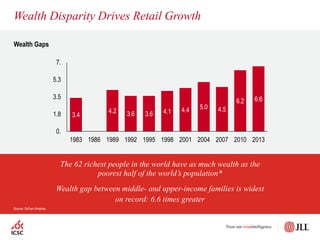
- Wealth disparity is driving retail growth as only upper-income families have experienced wealth gains.
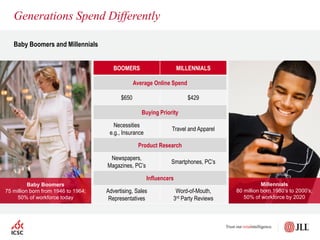
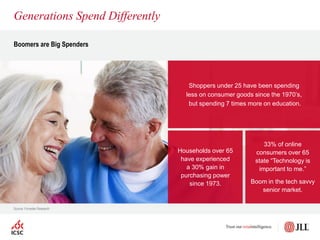
- Different generations spend differently, with millennials prioritizing necessities while baby boomers are big spenders.
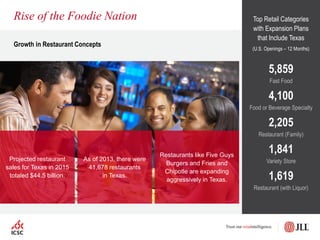
- The rise of the "foodie nation" is fueling growth in restaurant concepts.
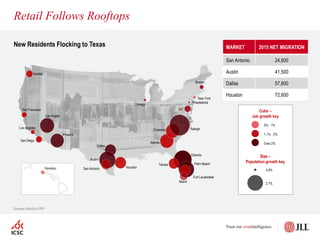
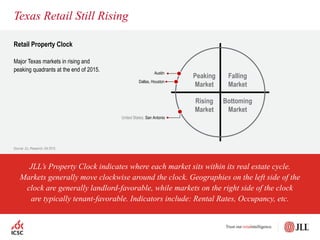
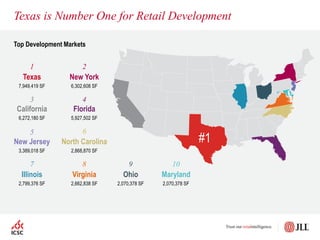
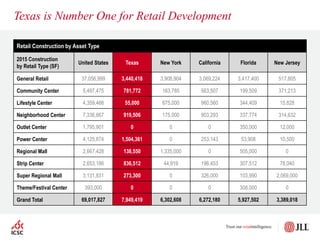
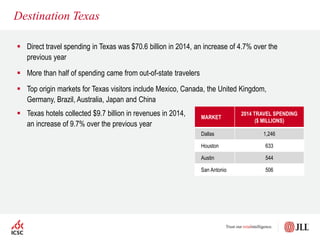
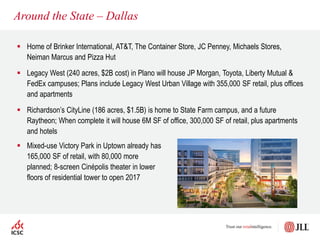
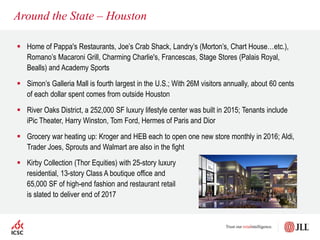
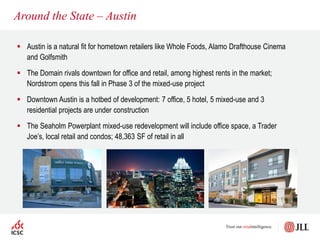
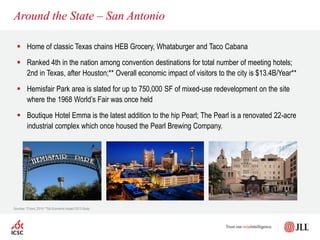
- Texas cities like Dallas, Houston, Austin, and San Antonio are experiencing population growth and new retail development.
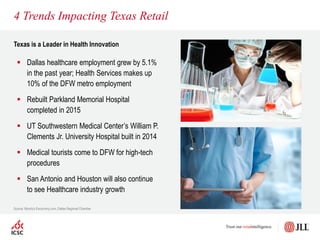
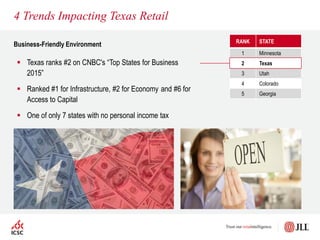
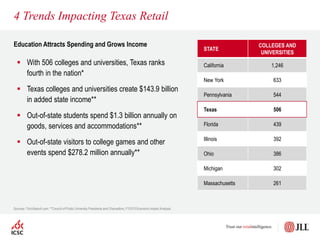
- Factors like a business-friendly environment, healthcare growth, and education are fueling the Texas economy and retail spending.