The survey asked respondents which brand comes to mind when thinking of smartphones. Samsung was the top response at 54.45% of answers. Other popular responses included iPhone at 7.16%, Sony at 5.94%, and Apple at 3.51%. In total, 2305 responses were collected with over 100 different brands mentioned.
The Great Indian Smartphone Survey 2021 by 91mobiles91mobiles
Based on over 15,000 responses, here are the insights from our Great Indian Smartphone Survey 2021, providing details on aspects like the phone brands people use, the ones they would like to buy next, how satisfied they are with their current handset, and details on their purchase preferences.
The smartphone segment is the most dynamic arena in consumer technology, and brands keep coming up with newer models on a very frequent basis. But who are the people who’re buying all these devices? Which brands do people prefer the most? How are ownership patterns and brand loyalties shifting over time? How people decide on a new smartphone and what are the aspects that matter the most to them while buying one? Our survey has the answers
91mobiles' annual survey on smartphone ownership, loyalty trends, desired features and user satisfaction is here, and highlights interesting insights in the Indian smartphone industry.
Easy-to-use operation system, beautiful design, strong hardware configuration are top 3 reasons for buying the smartphone
Find more at : www.di-onlinesurvey.com
91mobiles Smartphone Buyer Insights Study April 202091mobiles
The key points addressed in the 91mobiles Smartphone Buyer Insights Survey 2020 are details on current and future smartphone ownership in India, how brand loyalty is shifting, smartphone aspects that matter to people, how they research and how they buy smartphones.
Laptop have come must-have devices these days, thanks to use cases like "work from home" and "learn from home". This survey is based on 8,000 user responses and reveals insights on current and future ownership, how people choose new laptops, the aspects that matter to them while purchasing, and how they prefer buying.
91mobiles Smartphone Buyer Insights Study 201991mobiles
91mobiles Smartphone Buyer Insights Study 2019 aims to unearth insights related to how often users upgrade their phones, what matters most to them while selecting a new daily driver, how they research for handsets, and their preferred buying modes and price ranges.
91mobiles consumer insights study for smartphones91mobiles
As part of the 91mobiles Consumer Insights Study, we surveyed over 15,000 smartphone users in India to gain an insight into the brand loyalty, change in phone ownership patterns, common issues users face with their devices and their satisfaction levels with the phone.
Study About Recent Uber-Grab Move in Southeast AsiaDI Marketing
Most of the people aware that Uber in Southeast Asia has been bought by Grab, the highest awareness come from Vietnam (86%), followed by Indonesia (77%) and Thailand (62%)
Find more at: https://dreamincubator.asia/en/insights/
Research Method : Online Research
Fieldwork Period : January 2015
Research Area : Indonesia (Nationwide)
Respondent Criteria : Male and Female aged 17 years old and above
Aware of smartwatch brand
Sample Size : 436 samples
-2/3 of smartphone users have feature phone as well
-46% use internet more than 3 hours / day, while no more than 28% access same hours from smart phone
-For brands, Samsung tops with 33% share followed by Nokia and apple
-Brand (53%), Pricing (52%) and Design (51%) are the main consideration factors
50-100K are the most common spending for the monthly phone usage
Less than 18% of smart phone users have paid for app
A. Research background
Since the beginning of the smartphone era, smartphone devices are gaining more popularity among users of all ages due to the convenience provided by smartphone applications, which now play a significant role in helping users live their lives more conveniently through providing entertainment as well as a platform to do business everywhere and anytime. In the past, application categories are limited to a few such as games and a few productivity applications, but who would have imagined we would have fitness tracking applications, educational applications or even medical applications?
LG, Panasonic and Samsung are top 3 well-known Air-conditioner brands in Indonesia
LG is the leader of Air-Conditioner market in Indonesia (39% market share)
Find more at: http://www.di-onlinesurvey.com/
Although Vietnamese love Facebook and smartphones are everywhere, enterprises fail to leverage this opportunities and rely on traditional media approach. Q&Me by Asia Plus Inc has gone through multiple analysis how to narrow this gap and approach users via social media
[Invbots' Insight] Investment Strategy - Apple Inc./iPhone 8Invbots Limited
Since launch 10 years ago, iPhone is among the greatest product ever. However, iPhone shipment growth has slowed significantly in recent years. iPhone shipment declined 8% YoY in FY16 and is expected to increase by only 3% YoY in FY17. Also, Apple Inc.’s business in China faces intense competition and its sales has been declining for 7 consecutive quarters.
Will the new iPhone rejuvenate Apple Inc., the largest listed company in the world, in terms of market capitalisation? Could iPhone8 enable Apple Inc. to gain its market shares back from Chinese handset makers? Is now still the right time to buy Apple Inc.’s shares?
Invbots has worked on an unique research based on proprietary data-points to analyse the potential development of Apple Inc. and its upcoming new iPhone. We are happy to share with you some of our research highlights and our crafted investment strategies.
You may also view our presentation here:
https://youtu.be/w0Dgf4paKps
InvBots.com (Invest Bots Limited), is a fast growing fin-tech with clear vision, game-changing strategies and extensive experience, network in global financial industry.
One stop shop for the latest mobile phones & accessories with the cheapest price. Shop online for all the mobile brands & related accessories & avail same day delivery.
Presentation slides for the session "Form Factors, Screen Sizes, and Browsers - Global Mobile Devices Overview". Presented by Krishna Guda of ScientiaMobile at ModevCon - December 11-12, 2014 in Arlington, VA
Presentation for California State University Fullerton Management Course, "Seminar in Strategic Management & Policy"
Complete overview of Apple's financial performance, top management, and projections for future corporate performance.
Understanding the Mobile data usage among youthRenzil D'cruz
Prepare Survey question are to find insight on how youth use data on there phone.
Prepare Insights report on pattern and usage among youth on mobile internet.
Measures to improve mobile data penetration and usage among youth.
Touching Isn't It? Consumer Response to Touch and Gesture Technology for IHS...John Feland
Ever since the iPhone was launched in 2007, consumers have increasingly become accustomed to touchscreen technology. Microsoft's touch centric Windows 8 release across tablets, laptops, phones and kitchen countertop computers was met with a mix of delight and dismay. Nintendo, Sony and Microsoft have rolled out gestures as the main way to play an increasing number of games on their platforms. Samsung's Galaxy S series phones allow hand waving gestures to silence calls, pause movies and more, but frustrate users with the lower battery life.
So how are we doing as an interface industry? As touch and gestures rollout to more and more devices and the enabling technology of controller chips and sensors improves, we should see any consumer discussion of touch fade from view as the use of the touchscreen becomes as natural as breathing. The reality is, as cost pressures increase, performance is dropping, and what should be a seamless user experience is becoming pitted with potholes of poor performance, manufacturing quality issues, and nonintuitive integration.
This presentation to the attendees of the IHS 2014 Touch, Gesture, Motion conference discussions the latest consumer experience research of Argus Insights. Covering market segments ranging from Wearables, Tablets, Laptops, Smartphones and more, Dr. Feland details what is working and what isn't with touch technologies.
Prediction of Apple's Q3 iPhone sales and trends guiding Q4, see how Apple is...John Feland
See the latest analysis from Argus Insights on Apple iPhone sales performance. Leverage consumer insights from around the world, this presentation shows how Apple is faring against Xiaomi in China, Samsung in the US and against themselves globally.
We saw robust demand in the US, Europe and China for Apple iPhones, with sell-through in Q3 on par or above that of Q1, the holiday season. Apple continues to do well against Samsung in China but we are seeing some softness in the US market where Samsung demand went up while Apple's dropped, but lower than expected. Consumer interest in the iPhone 5S has slowed in both the US and China. It is most disturbing in China where we see interest in the iPhone 4S exceed that of the 5S and 5C. Interest fell in the 5C at a lower rate in the US. So while Argus believes Apple will outperform Q3 2013, seeing the rapid drop in interest for the flagship iPhone 5S so far ahead of their next product launch signals a rough Q4 for iPhone sales.
Similar to Top of Mind Brand Smartphone in Indonesia (20)
Prediction of Apple's Q3 iPhone sales and trends guiding Q4, see how Apple is...
Top of Mind Brand Smartphone in Indonesia
1. 1/20/2015 SurveyResult byJakPat - Leading mobile market research in indonesia
http://jajakpendapat.net/surveyorproject/587 1/35
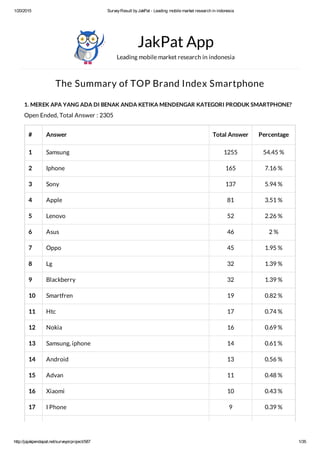
The Summary of TOP Brand Index Smartphone
1. MEREK APA YANG ADA DI BENAK ANDA KETIKA MENDENGAR KATEGORI PRODUK SMARTPHONE?
Open Ended, Total Answer : 2305
# Answer Total Answer Percentage
1 Samsung 1255 54.45 %
2 Iphone 165 7.16 %
3 Sony 137 5.94 %
4 Apple 81 3.51 %
5 Lenovo 52 2.26 %
6 Asus 46 2 %
7 Oppo 45 1.95 %
8 Lg 32 1.39 %
9 Blackberry 32 1.39 %
10 Smartfren 19 0.82 %
11 Htc 17 0.74 %
12 Nokia 16 0.69 %
13 Samsung, iphone 14 0.61 %
14 Android 13 0.56 %
15 Advan 11 0.48 %
16 Xiaomi 10 0.43 %
17 I Phone 9 0.39 %
JakPat App
Leading mobile market research in indonesia
2. 1/20/2015 SurveyResult byJakPat - Leading mobile market research in indonesia
http://jajakpendapat.net/surveyorproject/587 2/35
18 Sony xperia 8 0.35 %
19 Samsung dan iphone 8 0.35 %
20 Samsung galaxy 7 0.3 %
21 Evercoss 7 0.3 %
22 Xperia 5 0.22 %
23 Acer 5 0.22 %
24 I-Phone 5 0.22 %
25 Sony Experia 5 0.22 %
26 andromax 4 0.17 %
27 Samsung, Sony 4 0.17 %
28 Iphone, samsung 4 0.17 %
29 Apple iPhone 4 0.17 %
30 Smartfreen 4 0.17 %
31 iphone dan samsung 4 0.17 %
32 Motorola 3 0.13 %
33 Samsunh 3 0.13 %
34 Hp 3 0.13 %
35 ipone 3 0.13 %
36 Samsung dan apple 3 0.13 %
37 Sony, samsung 3 0.13 %
38 Cross 3 0.13 %
39 Apple samsung 3 0.13 %
40 Aple 3 0.13 %
41 samsul 3 0.13 %
8. 1/20/2015 SurveyResult byJakPat - Leading mobile market research in indonesia
http://jajakpendapat.net/surveyorproject/587 8/35
164 Smartfriend 1 0.04 %
165 Google nexus 1 0.04 %
166 Samsung. 1 0.04 %
167 Samsung apple 1 0.04 %
168 Samsung, Sony, Andromax, Evercoss, Mito 1 0.04 %
169 Oppho 1 0.04 %
170 Kualitas 1 0.04 %
171 Samsung. Smartfreen 1 0.04 %
172 Fungsinya 1 0.04 %
173 sony, samsung, lenovo 1 0.04 %
174 Asus, samsung, i phone 1 0.04 %
175 Multitasking 1 0.04 %
176 apple...blackberry..htc..sony..samsung 1 0.04 %
177 Samsung.... apple 1 0.04 %
178 Blackbery 1 0.04 %
179 Samsung,Blackberry,Nokia 1 0.04 %
180 Sony Ericsson 1 0.04 %
181 Pinter 1 0.04 %
182 Asus , samsung , iphone , blackberry 1 0.04 %
183 Samsung dan sony xperia 1 0.04 %
184 Azuz 1 0.04 %
185 ingin membeli 1 0.04 %
186 Samsung, imo, blackberry 1 0.04 %
187 LG DAN SAMSUNG 1 0.04 %
9. 1/20/2015 SurveyResult byJakPat - Leading mobile market research in indonesia
http://jajakpendapat.net/surveyorproject/587 9/35
188 Blackberru 1 0.04 %
189 1 gadget penting yang bisa digunakan untuk segala macam aktifitas 1 0.04 %
190 iPhone,Samsung,HTC,LG,Lenovo,Huawei,ZTE,Motorola,Asus,Nokia 1 0.04 %
191 Smartfren andromax 1 0.04 %
192 Apple, Samsung, HTC 1 0.04 %
193 Apa ya? 1 0.04 %
194 Ahhah 1 0.04 %
195 Fiturnya banyak 1 0.04 %
196 IPhone, Xperia 1 0.04 %
197 Sony, Samsung, Apple 1 0.04 %
198 Iphone , samsung 1 0.04 %
199 Xiaomi, Nexus, AndroidOne, Snapdragon. MediaTek jelek, iPhone jelek ga guna. Android is the best1 0.04 %
200 Wow 1 0.04 %
201 Samsung, Apple, HTC 1 0.04 %
202 HTC One M8 1 0.04 %
203 Samsung, sony, nokia, lenovo, Lg, oppo, Advan, himax 1 0.04 %
204 Asus,smartfren 1 0.04 %
205 Xiao mi 1 0.04 %
206 Nokia, sony, samsung 1 0.04 %
207 samsung, iphone, sony,oppo 1 0.04 %
208 Andromeda 1 0.04 %
209 Samsung, LG, apple 1 0.04 %
210 apple, sony, nokia, samsung 1 0.04 %
211 Sony experia z 1 0.04 %
10. 1/20/2015 SurveyResult byJakPat - Leading mobile market research in indonesia
http://jajakpendapat.net/surveyorproject/587 10/35
212 Samsung, Sony, Nokia 1 0.04 %
213 Axioo 1 0.04 %
214 Samsung, apple, lg, nokia, sony 1 0.04 %
215 Sony,iphone,mi,smartfren 1 0.04 %
216 Android, blackberry, iphone 1 0.04 %
217 iPhone & Samsung 1 0.04 %
218 apple, samsung, oppo, lenovo 1 0.04 %
219 Sonyericson 1 0.04 %
220 Samsung android 1 0.04 %
221 Android, ios 1 0.04 %
222 Hp pintar dan canggih 1 0.04 %
223 Blacberry, Iphone 1 0.04 %
224 Samsung, sony xperia, htc, asus zenfone 1 0.04 %
225 Aple samsung sony 1 0.04 %
226 Smarfren 1 0.04 %
227 Evercross 1 0.04 %
228 tidakk ada 1 0.04 %
229 Samsung, apple, blackberry, asus 1 0.04 %
230 Samsung, Nokia, Oppo 1 0.04 %
231 Samsung, lumia, sony 1 0.04 %
232 Hape buat kerja sama internet 1 0.04 %
233 Appel 1 0.04 %
234 Iphone samsung htc lg 1 0.04 %
235 samsung, LG, nokia 1 0.04 %
11. 1/20/2015 SurveyResult byJakPat - Leading mobile market research in indonesia
http://jajakpendapat.net/surveyorproject/587 11/35
236 Apple, samsung, asus, lenovo, acer, oppo, htc, motorola, nokia, sony, Lg, dll1 0.04 %
237 Iphone 6 1 0.04 %
238 Samsung,oppo dan apple 1 0.04 %
239 Sony, lg, samsung, asus 1 0.04 %
240 Apple Phone 1 0.04 %
241 Samsung , Oppo, HTC 1 0.04 %
242 sony, oppo, samsung, iphone 1 0.04 %
243 Internet 1 0.04 %
244 Samsung, Lenovo. iphone, asus, sony 1 0.04 %
245 Samsung , LG , Asus 1 0.04 %
246 Samsung, sonny 1 0.04 %
247 Biasa saja 1 0.04 %
248 Samsung, LG. 1 0.04 %
249 samsung, iphone, nokia, sonny 1 0.04 %
250 Samsung dan oppo 1 0.04 %
251 Ram 1 0.04 %
252 Blackberry, samsung, iphone 1 0.04 %
253 Samsun 1 0.04 %
254 Samsung, Lg, Sony 1 0.04 %
255 Samsung, Blackbery dan Nokia 1 0.04 %
256 Experia 1 0.04 %
257 canggih dan berteknologi tinggi 1 0.04 %
258 Aplle 1 0.04 %
259 Swasung 1 0.04 %
12. 1/20/2015 SurveyResult byJakPat - Leading mobile market research in indonesia
http://jajakpendapat.net/surveyorproject/587 12/35
260 Iphone 5 1 0.04 %
261 Samsung 1 0.04 %
262 Tidak ada 1 0.04 %
263 Samsung, Blackberry, dan LG 1 0.04 %
13. 1/20/2015 SurveyResult byJakPat - Leading mobile market research in indonesia
http://jajakpendapat.net/surveyorproject/587 13/35
2. MEREK PRODUK SMARTPHONE YANG ANDA GUNAKAN SAAT INI?
Multiple Answer, Total Answer : 2305
0 % 20 % 40 % 60 % 80 % 100
%
1
2
3
4
5
6
7
8
9
10
Samsung (48.03%)
Other option (21.74%)
Sony (9.54%)
Lenovo (6.64%)
LG (3.99%)
Oppo (3.73%)
Iphone (3.64%)
Huawei (1.04%)
Xiaomi (0.95%)
14. 1/20/2015 SurveyResult byJakPat - Leading mobile market research in indonesia
http://jajakpendapat.net/surveyorproject/587 14/35
Nexus (0.69%)
15. 1/20/2015 SurveyResult byJakPat - Leading mobile market research in indonesia
http://jajakpendapat.net/surveyorproject/587 15/35
# Option Total Answer Percentage
1 Samsung 1107 48.03 %
2 Other option 501 21.74 %
3 Sony 220 9.54 %
4 Lenovo 153 6.64 %
5 LG 92 3.99 %
6 Oppo 86 3.73 %
7 Iphone 84 3.64 %
8 Huawei 24 1.04 %
9 Xiaomi 22 0.95 %
10 Nexus 16 0.69 %
16. 1/20/2015 SurveyResult byJakPat - Leading mobile market research in indonesia
http://jajakpendapat.net/surveyorproject/587 16/35
3. KAPAN RENCANA ANDA AKAN MEMBELI SMARTPHONE LAGI DI MASA DEPAN?
Multiple Answer, Total Answer : 2305
0 % 20 % 40 % 60 % 80 % 100
%
1
2
3
4
5
6
7
1 Tahun ke depan (46.29%)
Other option (27.16%)
6 Bulan ke depan (11.67%)
3 Bulan ke depan (8.94%)
Bulan depan (4.16%)
Besok (0.95%)
Minggu depan (0.82%)
17. 1/20/2015 SurveyResult byJakPat - Leading mobile market research in indonesia
http://jajakpendapat.net/surveyorproject/587 17/35
# Option Total Answer Percentage
1 1 Tahun ke depan 1067 46.29 %
2 Other option 626 27.16 %
3 6 Bulan ke depan 269 11.67 %
4 3 Bulan ke depan 206 8.94 %
5 Bulan depan 96 4.16 %
6 Besok 22 0.95 %
7 Minggu depan 19 0.82 %
18. 1/20/2015 SurveyResult byJakPat - Leading mobile market research in indonesia
http://jajakpendapat.net/surveyorproject/587 18/35
4. MEREK SMARTPHONE APA YANG INGIN ANDA BELI DI MASA DEPAN?
Single Answer, Total Answer : 2305
Iphone (32.97%)
Samsung (27.03%)
Sonny (11.32%)
Other option (8.16%)
Xiaomi (6.51%)
Oppo (5.55%)
LG (3.69%)
Lenovo (2.78%)
Nexus (1.61%)
Huawei (0.39%)
19. 1/20/2015 SurveyResult byJakPat - Leading mobile market research in indonesia
http://jajakpendapat.net/surveyorproject/587 19/35
# Option Total Answer Percentage
1 Iphone 760 32.97 %
2 Samsung 623 27.03 %
3 Sonny 261 11.32 %
4 Other option 188 8.16 %
5 Xiaomi 150 6.51 %
6 Oppo 128 5.55 %
7 LG 85 3.69 %
8 Lenovo 64 2.78 %
9 Nexus 37 1.61 %
10 Huawei 9 0.39 %
20. 1/20/2015 SurveyResult byJakPat - Leading mobile market research in indonesia
http://jajakpendapat.net/surveyorproject/587 20/35
5. BERIKAN RATING ATAS MEREK SMARTPHONE YANG ANDA GUNAKAN SAAT INI
Scale Question, Total Answer : 2305
Scale 7 (0.09%)
Scale 5 (31.24%)
Scale 4 (48.29%)
Scale 3 (15.57%)
Scale 2 (3.56%)
Scale 1 (1.21%)
Scale 0 (0.04%)
21. 1/20/2015 SurveyResult byJakPat - Leading mobile market research in indonesia
http://jajakpendapat.net/surveyorproject/587 21/35
# Scale Total Answer Percentage
1 Scale 7 2 0.09 %
2 Scale 5 720 31.24 %
3 Scale 4 1113 48.29 %
4 Scale 3 359 15.57 %
5 Scale 2 82 3.56 %
6 Scale 1 28 1.21 %
7 Scale 0 1 0.04 %
22. 1/20/2015 SurveyResult byJakPat - Leading mobile market research in indonesia
http://jajakpendapat.net/surveyorproject/587 22/35
6. URUTKAN FITUR YANG PALING ANDA CARI KETIKA MEMBELI SMARTPHONE
Priority, Total Answer : 2305
Option : Harga
0 % 20 % 40 % 60 % 80 % 100
%
1
2
3
4
5
6
7
Priority 1 (38.87%)
Priority 6 (12.49%)
Priority 5 (11.15%)
Priority 4 (10.67%)
Priority 7 (9.98%)
Priority 3 (9.54%)
Priority 2 (7.29%)