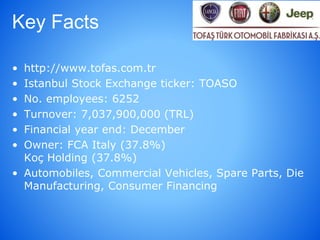
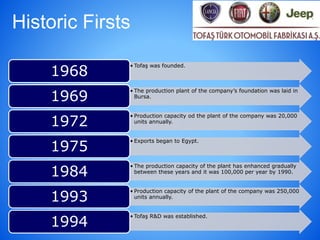
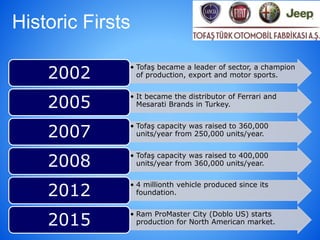
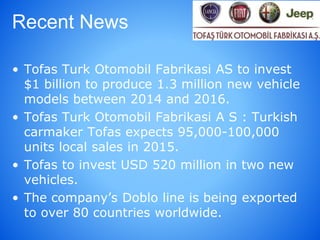
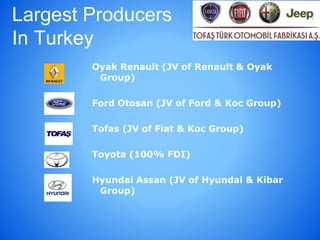
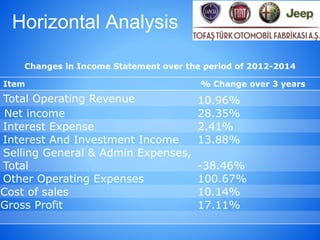
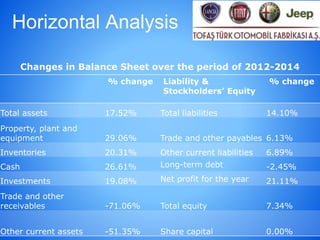
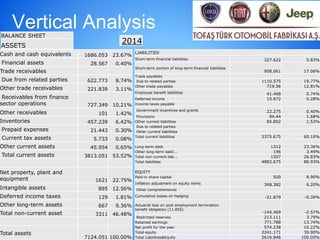
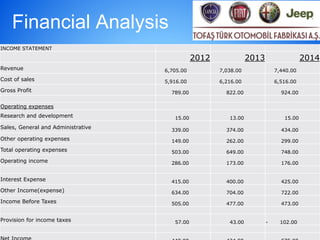
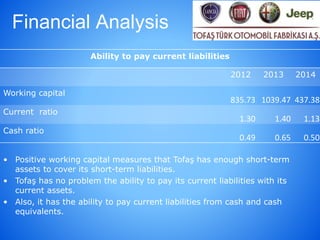
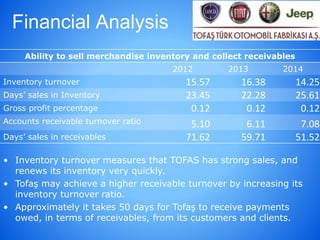
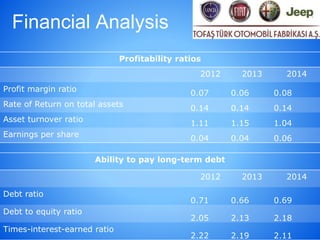
TOFAŞ TÜRK OTOMOBİL FABRİKASI A.Ş
Financial Accounting(ACCT 201-A) Group Project
By: MERT ÜÇMER S001973
Content
• Company Overview
• Key Facts
• Historic Firsts
• Recent News
• Industry Overview (Global Market, Turkish Market)
• Horizontal Analysis
• Vertical Analysis
• Financial Analysis
• Conclusion
Company Overview
• Tofas was founded in 1968 and is
headquartered in Istanbul, Turkey.
• The company offers its products under the
Fiat, Alfa Romeo, Lancia, Maserati, Ferrari,
and Jeep brands.
• The 6th biggest industrial enterprise of
Turkey
• Plays a leading role in Turkish automotive
sector
• Current CEO – Kamil Başaran
Key Facts
• http://www.tofas.com.tr
• Istanbul Stock Exchange ticker: TOASO
• No. employees: 6252
• Turnover: 7,037,900,000 (TRL)
• Financial year end: December
• Owner: FCA Italy (37.8%)
Koç Holding (37.8%)
• Automobiles, Commercial Vehicles, Spare Parts, Die
Manufacturing, Consumer Financing
Historic Firsts
• Tofaş was founded.
1968
• The production plant of the company’s foundation was laid in
Bursa.
1969
• Production capacity od the plant of the company was 20,000
units annually.
1972
• Exports began to Egypt.
1975
• The production capacity of the plant has enhanced gradually
between these years and it was 100,000 per year by 1990.
1984
• Production capacity of the plant of the company was 250,000
units annually.1993
• Tofaş R&D was established.
1994
Historic Firsts
• Tofaş became a leader of sector, a champion
of production, export and motor sports.2002
• It became the distributor of Ferrari and
Mesarati Brands in Turkey.2005
• Tofaş capacity was raised to 360,000
units/year from 250,000 units/year.2007
• Tofaş capacity was raised to 400,000
units/year from 360,000 units/year.2008
• 4 millionth vehicle produced since its
foundation.2012
• Ram ProMaster City (Doblo US) starts
production for North American market.2015
Recent News
• Tofas Turk Otomobil Fabrikasi AS to invest
$1 billion to produce 1.3 million new vehicle
models between 2014 and 2016.
• Tofas Turk Otomobil Fabrikasi A S : Turkish
carmaker Tofas expects 95,000-100,000
units local sales in 2015.
• Tofas to invest USD 520 million in two new
vehicles.
• The company’s Doblo line is being exported
to over 80 countries worldwide.
Largest Producers
In Turkey
Oyak Renault (JV of Renault & Oyak
Group)
Ford Otosan (JV of Ford & Koc Group)
Tofas (JV of Fiat & Koc Group)
Toyota (100% FDI)
Hyundai Assan (JV of Hyundai & Kibar
Group)
Industry Overview
in Turkey
Production,
units
2010 2011 2012 2013 2014 2014/2013
Passenger car 510,931 603,394 639,734 577,296 633,604 9.8%
LCV 341,873 459,386 506,346 458,826 452,801 -1.3%
HCV 16,801 31,777 43,051 36,856 39,129 6.2%
Tractor 14,861 30,425 45,506 42,255 40,509 -4.1%
Total 884,466 1,124,982 1,234,637 1,115,233 1,166,043 4.6%
Source: Automotive Manufacturers Association, 2014
The volume of production is over 1.1m units in 2014.
Industry Overview
in World
Source: EIU/IATA Economic Briefing 2008
Horizontal Analysis
Item % Change over 3 years
Total Operating Revenue 10.96%
Net income 28.35%
Interest Expense 2.41%
Interest And Investment Income 13.88%
Selling General & Admin Expenses,
Total -38.46%
Other Operating Expenses 100.67%
Cost of sales 10.14%
Gross Profit 17.11%
Changes in Income Statement over the period of 2012-2014
Horizontal Analysis
Changes in Balance Sheet over the period of 2012-2014
% change Liability &
Stockholders’ Equity
% change
Total assets 17.52% Total liabilities 14.10%
Property, plant and
equipment 29.06% Trade and other payables 6.13%
Inventories 20.31% Other current liabilities 6.89%
Cash 26.61% Long-term debt -2.45%
Investments 19.08% Net profit for the year 21.11%
Trade and other
receivables -71.06% Total equity 7.34%
Other current assets -51.35% Share capital 0.00%
Vertical Analysis
Cash and cash equivalents 1686.053 23.67%
Financial assets 28.567 0.40%
Trade receivables
Due from related parties 622.773 8.74%
Other trade receivables 221.839 3.11%
Receivables from finance
sector operations 727.349 10.21%
Other receivables 101 1.42%
Inventories 457.239 6.42%
Prepaid expenses 21.443 0.30%
Current tax assets 5.733 0.08%
Other current assets 45.954 0.65%
Total current assets 3813.051 53.52%
Net property, plant and
equipment 1621 22.75%
Intangible assets 895 12.56%
Deferred income taxes 129 1.81%
Other long-term assets 667 9.36%
Total non-current asset 3311 46.48%
Total assets
7124.051 100.00%
LIABILITIES
Short-term financial liabilities 327.622 5.83%
Short-term portion of long-term financial liabilities
958.061 17.06%
Trade payables
Due to related parties 1110.575 19.77%
Other trade payables 719.56 12.81%
Employee benefit liabilities 41.468 0.74%
Deferred income 15.872 0.28%
Income taxes payable
Government incentives and grants 22.275 0.40%
Provisions 94.44 1.68%
Other current liabilities 85.802 1.53%
Due to related parties
Other current liabilities
Total current liabilities 3375.675 60.10%
Long-term debt 1312 23.36%
Other long-term liabil... 196 3.49%
Total non-current liab... 1507 26.83%
Total liabilities 4882.675 86.93%
EQUITY
Paid-in share capital 500 8.90%
Inflation adjustment on equity items 348.382 6.20%
Other comprehensives
Cumulative losses on hedging -21.879 -0.39%
Actuarial loss on post employment termination
benefit obligation (11.856)
-144.469 -2.57%
Restricted reserves 213.111 3.79%
Retained earnings 771.788 13.74%
Net profit for the year 574.238 10.22%
Total equity 2241.171 39.90%
Total Liabilities&Equity 5616.846 100.00%
BALANCE SHEET
ASSETS
2014
Financial Analysis
891,000
1,009,000
INCOME STATEMENT
2012 2013 2014
Revenue 6,705.00 7,038.00 7,440.00
Cost of sales 5,916.00 6,216.00 6,516.00
Gross Profit 789.00 822.00 924.00
Operating expenses
Research and development 15.00 13.00 15.00
Sales, General and Administrative 339.00 374.00 434.00
Other operating expenses 149.00 262.00 299.00
Total operating expenses 503.00 649.00 748.00
Operating income 286.00 173.00 176.00
Interest Expense 415.00 400.00 425.00
Other Income(expense) 634.00 704.00 722.00
Income Before Taxes 505.00 477.00 473.00
Provision for income taxes 57.00 43.00 - 102.00
Financial Analysis
Ability to pay current liabilities
2012 2013 2014
Working capital
835.73 1039.47 437.38
Current ratio
1.30 1.40 1.13
Cash ratio
0.49 0.65 0.50
• Positive working capital measures that Tofaş has enough short-term
assets to cover its short-term liabilities.
• Tofaş has no problem the ability to pay its current liabilities with its
current assets.
• Also, it has the ability to pay current liabilities from cash and cash
equivalents.
Financial Analysis
Ability to sell merchandise inventory and collect receivables
2012 2013 2014
Inventory turnover 15.57 16.38 14.25
Days’ sales in Inventory 23.45 22.28 25.61
Gross profit percentage 0.12 0.12 0.12
Accounts receivable turnover ratio 5.10 6.11 7.08
Days’ sales in receivables 71.62 59.71 51.52
• Inventory turnover measures that TOFAS has strong sales, and
renews its inventory very quickly.
• Tofaş may achieve a higher receivable turnover by increasing its
inventory turnover ratio.
• Approximately it takes 50 days for Tofaş to receive payments
owed, in terms of receivables, from its customers and clients.
Financial Analysis
Profitability ratios
2012 2013 2014
Profit margin ratio 0.07 0.06 0.08
Rate of Return on total assets 0.14 0.14 0.14
Asset turnover ratio 1.11 1.15 1.04
Earnings per share 0.04 0.04 0.06
Ability to pay long-term debt
2012 2013 2014
Debt ratio
0.71 0.66 0.69
Debt to equity ratio
2.05 2.13 2.18
Times-interest-earned ratio
2.22 2.19 2.11
Financial Analysis
• The higher the profit margin, the more sales
turkish liras end up as profit.
• Tofaş is successful that it has in using its
assets to earn income better way.
• However, Tofaş does not show good
improvement about EPS over 3 years.
• Dept to equity ratio in Tofas is normal when
we compare with industry average.
• Ability to pay interest expense is normal.
Conclusion
We have analyzed the financial statements of Tofaş Türk Otomobil
Fabrikası A.Ş for the period of 2012-2014, which is comprised of the
annual income statements, and balance sheets for the period of 2012
until 2014
Moreover, we have evaluated the liquidity, debt paying ability, profitability,
turnover, capital structure, and market based ratios as well as carried
horizontal, and vertical analyses.
Based upon the data we have assembled, the ratios and analysis we have
obtained, we are hereby expressing our opinion of investing opportunity in
Tofaş as well as to advise in the best possible way, the
respective company could improve its performance.
Conclusion
In our opinion, the financial statements of Tofaş for the
period of 2012-2014:
(i) demonstrates financial stability
(ii) demonstrates low risks associated with possible investments
(iii) express company’s ability to meet short-term as well as
long-term obligations
For the reasons above, we have decided to invest in Tofaş Türk Otomobil Fa.
In our opinion, based on the financial statements of Tofaş for the period of
2012-2014.

Tofas Financial Accounting

  • 1.
    TOFAŞ TÜRK OTOMOBİLFABRİKASI A.Ş Financial Accounting(ACCT 201-A) Group Project By: MERT ÜÇMER S001973
  • 2.
    Content • Company Overview •Key Facts • Historic Firsts • Recent News • Industry Overview (Global Market, Turkish Market) • Horizontal Analysis • Vertical Analysis • Financial Analysis • Conclusion
  • 3.
    Company Overview • Tofaswas founded in 1968 and is headquartered in Istanbul, Turkey. • The company offers its products under the Fiat, Alfa Romeo, Lancia, Maserati, Ferrari, and Jeep brands. • The 6th biggest industrial enterprise of Turkey • Plays a leading role in Turkish automotive sector • Current CEO – Kamil Başaran
  • 4.
    Key Facts • http://www.tofas.com.tr •Istanbul Stock Exchange ticker: TOASO • No. employees: 6252 • Turnover: 7,037,900,000 (TRL) • Financial year end: December • Owner: FCA Italy (37.8%) Koç Holding (37.8%) • Automobiles, Commercial Vehicles, Spare Parts, Die Manufacturing, Consumer Financing
  • 5.
    Historic Firsts • Tofaşwas founded. 1968 • The production plant of the company’s foundation was laid in Bursa. 1969 • Production capacity od the plant of the company was 20,000 units annually. 1972 • Exports began to Egypt. 1975 • The production capacity of the plant has enhanced gradually between these years and it was 100,000 per year by 1990. 1984 • Production capacity of the plant of the company was 250,000 units annually.1993 • Tofaş R&D was established. 1994
  • 6.
    Historic Firsts • Tofaşbecame a leader of sector, a champion of production, export and motor sports.2002 • It became the distributor of Ferrari and Mesarati Brands in Turkey.2005 • Tofaş capacity was raised to 360,000 units/year from 250,000 units/year.2007 • Tofaş capacity was raised to 400,000 units/year from 360,000 units/year.2008 • 4 millionth vehicle produced since its foundation.2012 • Ram ProMaster City (Doblo US) starts production for North American market.2015
  • 7.
    Recent News • TofasTurk Otomobil Fabrikasi AS to invest $1 billion to produce 1.3 million new vehicle models between 2014 and 2016. • Tofas Turk Otomobil Fabrikasi A S : Turkish carmaker Tofas expects 95,000-100,000 units local sales in 2015. • Tofas to invest USD 520 million in two new vehicles. • The company’s Doblo line is being exported to over 80 countries worldwide.
  • 8.
    Largest Producers In Turkey OyakRenault (JV of Renault & Oyak Group) Ford Otosan (JV of Ford & Koc Group) Tofas (JV of Fiat & Koc Group) Toyota (100% FDI) Hyundai Assan (JV of Hyundai & Kibar Group)
  • 9.
    Industry Overview in Turkey Production, units 20102011 2012 2013 2014 2014/2013 Passenger car 510,931 603,394 639,734 577,296 633,604 9.8% LCV 341,873 459,386 506,346 458,826 452,801 -1.3% HCV 16,801 31,777 43,051 36,856 39,129 6.2% Tractor 14,861 30,425 45,506 42,255 40,509 -4.1% Total 884,466 1,124,982 1,234,637 1,115,233 1,166,043 4.6% Source: Automotive Manufacturers Association, 2014 The volume of production is over 1.1m units in 2014.
  • 10.
    Industry Overview in World Source:EIU/IATA Economic Briefing 2008
  • 11.
    Horizontal Analysis Item %Change over 3 years Total Operating Revenue 10.96% Net income 28.35% Interest Expense 2.41% Interest And Investment Income 13.88% Selling General & Admin Expenses, Total -38.46% Other Operating Expenses 100.67% Cost of sales 10.14% Gross Profit 17.11% Changes in Income Statement over the period of 2012-2014
  • 12.
    Horizontal Analysis Changes inBalance Sheet over the period of 2012-2014 % change Liability & Stockholders’ Equity % change Total assets 17.52% Total liabilities 14.10% Property, plant and equipment 29.06% Trade and other payables 6.13% Inventories 20.31% Other current liabilities 6.89% Cash 26.61% Long-term debt -2.45% Investments 19.08% Net profit for the year 21.11% Trade and other receivables -71.06% Total equity 7.34% Other current assets -51.35% Share capital 0.00%
  • 13.
    Vertical Analysis Cash andcash equivalents 1686.053 23.67% Financial assets 28.567 0.40% Trade receivables Due from related parties 622.773 8.74% Other trade receivables 221.839 3.11% Receivables from finance sector operations 727.349 10.21% Other receivables 101 1.42% Inventories 457.239 6.42% Prepaid expenses 21.443 0.30% Current tax assets 5.733 0.08% Other current assets 45.954 0.65% Total current assets 3813.051 53.52% Net property, plant and equipment 1621 22.75% Intangible assets 895 12.56% Deferred income taxes 129 1.81% Other long-term assets 667 9.36% Total non-current asset 3311 46.48% Total assets 7124.051 100.00% LIABILITIES Short-term financial liabilities 327.622 5.83% Short-term portion of long-term financial liabilities 958.061 17.06% Trade payables Due to related parties 1110.575 19.77% Other trade payables 719.56 12.81% Employee benefit liabilities 41.468 0.74% Deferred income 15.872 0.28% Income taxes payable Government incentives and grants 22.275 0.40% Provisions 94.44 1.68% Other current liabilities 85.802 1.53% Due to related parties Other current liabilities Total current liabilities 3375.675 60.10% Long-term debt 1312 23.36% Other long-term liabil... 196 3.49% Total non-current liab... 1507 26.83% Total liabilities 4882.675 86.93% EQUITY Paid-in share capital 500 8.90% Inflation adjustment on equity items 348.382 6.20% Other comprehensives Cumulative losses on hedging -21.879 -0.39% Actuarial loss on post employment termination benefit obligation (11.856) -144.469 -2.57% Restricted reserves 213.111 3.79% Retained earnings 771.788 13.74% Net profit for the year 574.238 10.22% Total equity 2241.171 39.90% Total Liabilities&Equity 5616.846 100.00% BALANCE SHEET ASSETS 2014
  • 14.
    Financial Analysis 891,000 1,009,000 INCOME STATEMENT 20122013 2014 Revenue 6,705.00 7,038.00 7,440.00 Cost of sales 5,916.00 6,216.00 6,516.00 Gross Profit 789.00 822.00 924.00 Operating expenses Research and development 15.00 13.00 15.00 Sales, General and Administrative 339.00 374.00 434.00 Other operating expenses 149.00 262.00 299.00 Total operating expenses 503.00 649.00 748.00 Operating income 286.00 173.00 176.00 Interest Expense 415.00 400.00 425.00 Other Income(expense) 634.00 704.00 722.00 Income Before Taxes 505.00 477.00 473.00 Provision for income taxes 57.00 43.00 - 102.00
  • 15.
    Financial Analysis Ability topay current liabilities 2012 2013 2014 Working capital 835.73 1039.47 437.38 Current ratio 1.30 1.40 1.13 Cash ratio 0.49 0.65 0.50 • Positive working capital measures that Tofaş has enough short-term assets to cover its short-term liabilities. • Tofaş has no problem the ability to pay its current liabilities with its current assets. • Also, it has the ability to pay current liabilities from cash and cash equivalents.
  • 16.
    Financial Analysis Ability tosell merchandise inventory and collect receivables 2012 2013 2014 Inventory turnover 15.57 16.38 14.25 Days’ sales in Inventory 23.45 22.28 25.61 Gross profit percentage 0.12 0.12 0.12 Accounts receivable turnover ratio 5.10 6.11 7.08 Days’ sales in receivables 71.62 59.71 51.52 • Inventory turnover measures that TOFAS has strong sales, and renews its inventory very quickly. • Tofaş may achieve a higher receivable turnover by increasing its inventory turnover ratio. • Approximately it takes 50 days for Tofaş to receive payments owed, in terms of receivables, from its customers and clients.
  • 17.
    Financial Analysis Profitability ratios 20122013 2014 Profit margin ratio 0.07 0.06 0.08 Rate of Return on total assets 0.14 0.14 0.14 Asset turnover ratio 1.11 1.15 1.04 Earnings per share 0.04 0.04 0.06 Ability to pay long-term debt 2012 2013 2014 Debt ratio 0.71 0.66 0.69 Debt to equity ratio 2.05 2.13 2.18 Times-interest-earned ratio 2.22 2.19 2.11
  • 18.
    Financial Analysis • Thehigher the profit margin, the more sales turkish liras end up as profit. • Tofaş is successful that it has in using its assets to earn income better way. • However, Tofaş does not show good improvement about EPS over 3 years. • Dept to equity ratio in Tofas is normal when we compare with industry average. • Ability to pay interest expense is normal.
  • 19.
    Conclusion We have analyzedthe financial statements of Tofaş Türk Otomobil Fabrikası A.Ş for the period of 2012-2014, which is comprised of the annual income statements, and balance sheets for the period of 2012 until 2014 Moreover, we have evaluated the liquidity, debt paying ability, profitability, turnover, capital structure, and market based ratios as well as carried horizontal, and vertical analyses. Based upon the data we have assembled, the ratios and analysis we have obtained, we are hereby expressing our opinion of investing opportunity in Tofaş as well as to advise in the best possible way, the respective company could improve its performance.
  • 20.
    Conclusion In our opinion,the financial statements of Tofaş for the period of 2012-2014: (i) demonstrates financial stability (ii) demonstrates low risks associated with possible investments (iii) express company’s ability to meet short-term as well as long-term obligations For the reasons above, we have decided to invest in Tofaş Türk Otomobil Fa. In our opinion, based on the financial statements of Tofaş for the period of 2012-2014.