This document is the Oracle Enterprise Manager Cloud Control Administrator’s Guide for the 13c Release 1. It provides an overview of Oracle's comprehensive out-of-box monitoring capabilities including metric thresholds, baselines, advanced threshold management, custom events, corrective actions, and metric extensions. It also describes how to set up advanced monitoring configurations using templates, administration groups, and customizing alert messages. The document outlines how to manage incidents, problems, events and notifications. It provides guidance on accessing monitoring information and using the incident management functionality within Oracle Enterprise Manager.
![[1]Oracle® Enterprise Manager
Cloud Control Administrator’s Guide
13c Release 1
E60047-04
April 2016](https://image.slidesharecdn.com/toaz-220630202557-58e3356d/75/toaz-info-oracle-enterprise-manager-13cpdf-pr_d27a8dfef1d5b8f2ea644bed24621723-pdf-1-2048.jpg)


![Advanced Topics
2-56 Oracle® Enterprise Manager Administration
2.4.2 Defining Custom Incident Statuses
As discussed in "Working with Incidents" on page 2-40, one of the primary incident
workflow attributes is status. For most conditions, these predefined status attributes
will suffice. However, the uniqueness of your monitoring and management
environment may require an incident workflow requiring specialized incident states.
To address this need, you can define custom states using the create_resolution_state EM
CLI verb.
2.4.2.1 Creating a New Resolution State
emcli create_resolution_state
-label="Label for display"
-position="Display position"
[-applies_to="INC|PBLM"]
This verb creates a new resolution state for describing the state of incidents or
problems.
The new state is always added between the New and Closed states. You must specify
the exact position of this state in the overall list of states by using the -position
option. The position can be between 2 and 98.
By default, the new state is applicable to both incidents and problems. The -applies_
to option can be used to indicate that the state is applicable only to incidents or
problems.
A success message is reported if the command is successful. An error message is
reported if the change fails.
Examples
The following example adds a resolution state that applies to both incidents and
problems at position 25.
emcli create_resolution_state -label="Waiting for Ticket" -position=25
The following example adds a resolution state that applies to problems only at
position 35.
emcli create_resolution_state -label="Waiting for SR" -position=35
-applies_to=PBLM
2.4.2.2 Modifying an Existing Resolution State
You can chance the both the display label and the position of an existing state by using
the modify_resolution_state verb.
emcli modify_resolution_state
Important: The Enterprise Manager incident limits are in addition to
any diagnostic incident limits imposed by underlying applications
such as Oracle database, Middleware and Fusion Applications. These
limits are specific to each application. See the respective application
documentation for more information.
Important: This command can only be executed by Enterprise
Manager Super Administrators.](https://image.slidesharecdn.com/toaz-220630202557-58e3356d/75/toaz-info-oracle-enterprise-manager-13cpdf-pr_d27a8dfef1d5b8f2ea644bed24621723-pdf-110-2048.jpg)
![Advanced Topics
Using Incident Management 2-57
-label="old label of the state to be changed"
-new_label="New label for display"
-position="New display position"
[-applies_to=BOTH]
This verb modifies an existing resolution state that describes the state of incidents or
problems. As with the create_resolution_state verb, this command can only be
executed by Super Administrators.
You can optionally indicate that the state should apply to both incidents and problems
using the -applies_to option.
Examples
The following example updates the resolution state with old label "Waiting for TT"
with a new label "Waiting for Ticket" and if necessary, changes the position to 25.
emcli modify_resolution_state -label="Waiting for TT" -new_label="Waiting
for Ticket" -position=25
The following example updates the resolution state with the old label "SR Waiting"
with a new label "Waiting for SR" and if necessary, changes the position to 35. It also
makes the state applicable to incidents and problems.
emcli modify_resolution_state -label="SR Waiting" -new_label="Waiting for
SR" -position=35 -applies_to=BOTH
2.4.3 Clearing Stateless Alerts for Metric Alert Event Types
For metric alert event types, an event (metric alert) is raised based on the metric
threshold values. These metric alert events are called stateful alerts. For those metric
alert events that are not tied to the state of a monitored system (for example, snapshot
too old, or resumable session suspended ), these alerts are called stateless alerts. Because
stateless alerts are not cleared automatically, they need to be cleared manually. You can
perform a bulk purge of stateless alerts using the clear_stateless_alerts EM CLI verb.
clear_stateless_alerts clears the stateless alerts associated with the specified target. The
clearing must be manually performed as the Management Agent does not
automatically clear stateless alerts. To find the metric internal name associated with a
stateless alert, use the EM CLI get_metrics_for_stateless_alerts verb.
Format
emcli clear_stateless_alerts -older_than=number_in_days -target_type=target_type
-target_name=target_name [-include_members][-metric_internal_name=target_type_
metric:metric_name:metric_column] [-unacknowledged_only][-ignore_notifications]
[-preview]
[ ] indicates that the parameter is optional
Options
■ older_than
Specify the age of the alert in days. (Specify 0 for currently open stateless alerts.)
Note: For large numbers of incidents, you can manually clear
incidents in bulk. See "Responding to and Managing Multiple
Incidents, Events and Problems in Bulk".](https://image.slidesharecdn.com/toaz-220630202557-58e3356d/75/toaz-info-oracle-enterprise-manager-13cpdf-pr_d27a8dfef1d5b8f2ea644bed24621723-pdf-111-2048.jpg)

![Advanced Topics
Using Incident Management 2-59
During the rule creation process, you can specify that an event be automatically
cleared by selecting the Clear Event option while you are adding conditional actions.
Getting Notified when the Event Clears
The event clearing action is an asynchronous operation, which means that when the
rule action (clear) is initiated, the manually clearable event will be enqueued for
clearing, but not actually cleared. Hence, an email notification sent upon rule
execution will indicate that the event has not been cleared. Asynchronous clearing is
by design as it reduces overall rule engine processing load and processing time.
Subscribing to this event clearing rule with the intent to be notified when the event
clears will be of little value. If you want to be notified when the event clears, you must
create a new event rule and explicitly specify a Clear severity. In doing so, you will be
notified once the event is actually cleared.
2.4.5 User-reported Events
Users may create (publish) events manually using the EM CLI verb publsh_event. A
User-reported event is published as an event of the "User-reported event" class. Only
users with Manage Target privilege can publish these events for a target. An error
message is reported if the publish fails.
After an event is published with a severity other than CLEAR (see below), end-users
with appropriate privileges can manually clear the event from the UI, or they can
publish a new event using a severity level of CLEAR and the same details to report
clearing of the underlying situation.
2.4.5.1 Format
emcli publish_event
-target_name="Target name"
-target_type="Target type internal name"
-message="Message for the event"
-severity="Severity level"
-name="event name"
[-key="sub component name"
-context="name1=value1;name2=value2;.."
-separator=context="alt. pair separator"
-subseparator=context="alt. name-value separator"]
[ ] indicates that the parameter is optional
2.4.5.2 Options
■ target_name
Target name.
■ target_type
Target type name.
■ message
Message to associate for the event. The message cannot exceed 4000 characters.
■ severity
Numeric severity level to associate for the event. The supported values for severity
level are as follows:
"CLEAR"
"MINOR_WARNING"](https://image.slidesharecdn.com/toaz-220630202557-58e3356d/75/toaz-info-oracle-enterprise-manager-13cpdf-pr_d27a8dfef1d5b8f2ea644bed24621723-pdf-113-2048.jpg)


![Advanced Topics
2-66 Oracle® Enterprise Manager Administration
3. Click Export. Your browser’s file dialog appears prompting you to save or open
the file. Save the file to your local disk. By default the file name will be the name of
your rule set with a.xml extension.
2.4.7.2 Importing Rule Sets using the Enterprise Manager Console
In order to import an incident rule set, administrators must have the Create Enterprise
Rule Set privilege.
When an incident rule set is first imported, it will be disabled by default. You will need
to edit the imported rule set in order to specify environment-specific parameters such
as target names for specific target selection or user names for email notification. You
will then need to enable the rule set.
To import an incident rule set:
1. From the Setup menu, select Incidents then select Incident Rules.
2. Click Import. The Import Rule Set dialog displays.
3. From the Import Rule Set dialog, click Choose File. The File Upload dialog
displays.
4. Select the incident rule set XML file and click Open.
5. Click OK.
If there is a naming conflict for the name, you will be asked to select one of the
following:
■ Override rule set with same name
■ Create rule set with different name
2.4.7.3 Importing Rule Sets Using EM CLI
Using EM CLI, you can write scripts to import/export large numbers of rule sets. The
Create Enterprise Rule Set privilege is required in order to run the import operation
from the command line or script.
You can import a rule set from list of enterprise rule set(s) except for predefined
(out-of-box) rule sets supplied by Oracle.
emcli import_incident_rule_set
-import_file=<XML file name along with the file path for the exported rule
set earlier>
[-alt_rule_set_name=<rule set name>]
Options
■ import_file=<XML file name along with the file path for the exported rule set
earlier>
■ alt_rule_set_name=<rule set name>
Optionally, you can specify the name of an enterprise rule set to use in case rule set
already exists.
Example
emcli import_incident_rule_set -import_file="/tmp/TEST_RULESET.xml" -alt_
rule_set_name=COPY_OF_TEST_RULESET
Note: You should not edit the generated rule set XML files.](https://image.slidesharecdn.com/toaz-220630202557-58e3356d/75/toaz-info-oracle-enterprise-manager-13cpdf-pr_d27a8dfef1d5b8f2ea644bed24621723-pdf-120-2048.jpg)
![Advanced Topics
Using Incident Management 2-67
This command imports the rule set and names it as 'COPY_OF_TEST_RULESET' from
rule set XML specified 'TEST_RULESET.xml'
2.4.7.4 Exporting Rule Sets Using EM CLI
You can export a rule set from list of enterprise rule set(s) except for predefined
(out-of-box) rule sets supplied by Oracle. Any user can run the export operation. No
special privileges are required.
emcli export_incident_rule_set
-rule_set_name=<rule set name>
[-rule_set_owner=<ruleset owner>]
-export_file=<XML file name along with the file path for the exported rule
set>
Options
■ rule_set_name=<rule set name>
Name of an enterprise rule set.
■ rule_set_owner=<ruleset owner>
Optionally, you can specify the owner of the rule set.
■ export_file=<XML file name along with the file path for the exported rule set>
If the filename is specified as directory, it will create a file with rule set name in
that directory.
Examples:
emcli export_incident_rule_set -rule_set_name=TEST_RULESET -rule_set_
owner=sysman -export_file="/tmp/"
This command exports the ruleset named 'TEST_RULESET' from rule set(s) and saves
at '/tmp/TEST_RULESET.xml'
2.4.8 Creating Corrective Actions for Events
Prior to Enterprise Manager release 13.1, corrective actions could only be associated
with metric alerts. Enterprise Manager release 13.1 now allows script-based corrective
actions to fire on an event by associating them with event rules. This greatly increases
the number of situations where corrective actions can be used, such as compliance
standard violations, metric errors, or target availability. By associating corrective
actions with event rules, you can have the corrective action performed automatically.
You can also initiate the corrective action manually through the event details Guided
Resolutions area of Incident Manager. For a detailed discussion about corrective
actions, see "Creating Corrective Actions" on page 10-36..
Corrective Actions in Event Rules
When you create an event rule to be triggered when a matching event occurs, you can
select an appropriate predefined corrective action from the Corrective Actions Library.
The corrective actions available for selection will depend on the event type and target
type selected for the rule.
When an event rule set is exported or imported, the associated corrective actions will
be exported/imported as well. For more information about importing/exporting
event rules, see "Exporting and Importing Incident Rules" on page 2-65.
Create the Corrective Action](https://image.slidesharecdn.com/toaz-220630202557-58e3356d/75/toaz-info-oracle-enterprise-manager-13cpdf-pr_d27a8dfef1d5b8f2ea644bed24621723-pdf-121-2048.jpg)


![Setting Up Notifications
Using Notifications 3-9
predefined building blocks (called attributes and labels) contained within a simple
script, Super Administrators can customize alert emails by selecting from a wide
variety of information content.
To customize an email:
1. From the Setup menu, select Notifications, then select Customize Email Formats.
2. Choose the Type and Format.
3. Click Customize. The Customize Email Template page displays.
From the Customize Email Template page, you can modify the content of the email
template Enterprise Manager uses to generate email notifications. Extensive
information on script formatting, syntax, and options is available from the Edit Email
Template page via imbedded assistance and online help.
3.1.4.1 Email Customization Reference
The following reference summarizes the semantics and component syntax of the
pseudo-language used to define emails. The pseudo-language provides you with a
simple, yet flexible way to customize email notifications. The following is a summary
of pseudo-language conventions/limitations:
■ You can add comments (or any free-form text) using separate lines beginning with
"--" or at end of lines.
■ You can use attributes.
■ You can use IF & ELSE & ENDIF control structures. You can also use multiple
conditions using "AND" or "OR". Nested IF statements are not supported.
■ You can insert spaces for formatting purposes. Spaces at the beginning of a line
will be ignored in the actual email. To insert spaces at the beginning of a line, use
the [SP] attribute.
■ Use "/" to escape and "[" or "]" if you want to add attribute names, operators, or IF
clauses to the actual email.
■ HTML is not supported.
Reserved Words and Operators
The following table lists all reserved words and operators used when modifying email
scripts.
Table 3–1 Reserved Words and Operators
Reserved Word/Operator Description
IF, ELSIF, ENDIF, ELSE Used in IF-ELSE constructs.
AND, OR Boolean operators – used in IF-ELSE constructs only.
NULL To check NULL value for attributes - used in IF-ELSE constructs
only.
| Pipe operator – used to show the first non-NULL value in a list
of attributes.
For example:
METRIC_NAME|SEVERITY
EQ, NEQ Equal and Not-Equal operators – applicable to NULL, STRING
and NUMERIC values.](https://image.slidesharecdn.com/toaz-220630202557-58e3356d/75/toaz-info-oracle-enterprise-manager-13cpdf-pr_d27a8dfef1d5b8f2ea644bed24621723-pdf-161-2048.jpg)
![Setting Up Notifications
3-10 Oracle® Enterprise Manager Administration
Syntax Elements
Literal Text
You can specify any text as part of the email content. The text will be displayed in the
email and will not be translated if the Oracle Management Services (OMS) language
setting is changed. For example, ‘my Oracle Home’ appears as ‘my Oracle Home’ in
the generated email.
Predefined Attributes
Predefined attributes/labels will be substituted with actual values in a specific context.
To specify a predefined attribute/label, use the following syntax:
[PREDEFINED_ATTR]
Attribute names can be in either UPPER or LOWER case. The parsing process is
case-insensitive.
A pair of square brackets is used to distinguish predefined attributes from literal text.
For example, for a job email notification, the actual job name will be substituted for
[EXECUTION_STATUS]. For a metric alert notification, the actual metric column name
will be substituted for [METIRC_COLUMN].
You can use the escape character “/” to specify words and not have them interpreted
as predefined labels/attributes. For example, "/[NEW/]” will not be considered as the
predefined attribute [NEW] when parsed.
Operators
EQ, NEQ – for text and numeric values
NULL- for text and numeric values
GT, LT, GE, LE – for numeric values
Control Structures
The following table lists acceptable script control structures.
/ Escape character – used to escape reserved words and operators.
Escape characters signify that what follows the escape character
takes an alternative interpretation.
[ , ] Delimiters used to demarcate attribute names and IF clauses.
Table 3–2 Control Structures
Control Structure Description
Pipe "|" Two or more attributes can be separated by ‘|’ character. For
example,
[METRIC_NAME|SEVERITY]
In this example, only the applicable attribute within the current
alert context will be used (replaced by the actual value) in the
email. If more than one attribute is applicable, only the left-most
attribute is used.
Table 3–1 (Cont.) Reserved Words and Operators
Reserved Word/Operator Description](https://image.slidesharecdn.com/toaz-220630202557-58e3356d/75/toaz-info-oracle-enterprise-manager-13cpdf-pr_d27a8dfef1d5b8f2ea644bed24621723-pdf-162-2048.jpg)
![Setting Up Notifications
Using Notifications 3-11
Comments
You can add comments to your script by prefacing a single line of text with two
hyphens "--". For example,
-- Code added on 8/3/2009
[IF REPEAT_COUNT NEQ NULL]
IF Allows you to make a block of text conditional. Only one level of
IF and ELSIF is supported. Nested IF constructs are not
supported.
All attributes can be used in IF or ELSIF evaluation using
EQ/NEQ operators on NULL values. Other operators are
allowed for “SEVERITY” and “REPEAT_COUNT” only.
Inside the IF block, the values need to be contained within
quotation marks “ ”. Enterprise Manager will extract the
attribute name and its value based on the position of “EQ” and
other key words such as “and”, “or”. For example,
[IF REPEAT_COUNT EQ “1” AND SEVERITY EQ “CRITICAL”
THEN]
The statement above will be true when the attributes of the alert
match the following condition:
■ Attribute Name: REPEAT_COUNT
■ Attribute Value: 1
■ Attribute Name: SEVERITY
■ Attribute Value: CRITICAL
Example IF Block:
[IF EXECUTION_STATUS NEQ NULL]
[JOB_NAME_LABEL]=[EXECUTION_STATUS]
[JOB_OWNER_LABEL]=[JOB_OWNER]
[ENDIF]
[IF SEVERITY_CODE EQ CRITICAL ]
[MTRIC_NAME_LABEL]=[METRIC_GROUP]
[METRIC_VALUE_LABEL]=[METRIC_VALUE]
[TARGET_NAME_LABEL]=[TARGET_NAME]
[KEY_VALUES]
[ENDIF]
Example IF and ELSEIF Block:
[IF SEVERITY_CODE EQ CRITICAL]
statement1
[ELSIF SEVERITY_CODE EQ WARNING]
statement2
[ELSIF SEVERITY_CODE EQ CLEAR]
statement3
[ELSE]
statement4
[ENDIF]
Table 3–2 (Cont.) Control Structures
Control Structure Description](https://image.slidesharecdn.com/toaz-220630202557-58e3356d/75/toaz-info-oracle-enterprise-manager-13cpdf-pr_d27a8dfef1d5b8f2ea644bed24621723-pdf-163-2048.jpg)
![Setting Up Notifications
3-12 Oracle® Enterprise Manager Administration
. . .
Comments may also be placed at the end of a line of text.
[IF SEVERITY_SHORT EQ W] -- for Warning alert
HTML Tags in Customization Content
Use of HTML tags is not supported.
When Enterprise Manager parses the email script, it will convert the “<” and “>”
characters of HTML tags into encoded format (< and >). This ensures that the
HTML tag is not treated as HTML by the destination system.
Examples
Email customization template scripts support three main operators.
■ Comparison operators: EQ/NEQ/GT/LT/GE/LE
■ Logic operators: AND/OR
■ Pipeline operator: |
3.1.5 Setting Up Repeat Notifications
Repeat notifications allow administrators to be notified repeatedly until an incident is
either acknowledged or the number of Maximum Repeat Notifications has been
reached. Enterprise Manager supports repeat notification for all notification methods
(email, OS command, PL/SQL procedure, and SNMP trap).
Configuring Repeat Notifications Globally
To enable repeat notifications for a notification method (globally), select the Send
Repeat Notifications option on the Notification Methods page . In addition to setting
the maximum number of repeat notifications, you can also set the time interval at
which the notifications are sent.
Configuring Repeat Notifications Via Incident Rules
Setting repeat notifications globally at the notification method level may not provide
sufficient flexibility. For example, you may want to have different repeat notification
settings based on event type. Enterprise Manager accomplishes this by allowing you to
set repeat notifications for individual incident rule sets or individual rules within a
rule set. Repeat notifications set at the rule level take precedence over those defined at
the notification method level.
Non-Email Repeat Notifications
Important: For Oracle database versions 10 and higher, it is
recommend that no modification be made to aq_tm_processes init.ora
parameter. If, however, this parameter must be modified, its value
should be at least one for repeat notification functionality. If the
Enterprise Manager Repository database version is 9.2, the aq_tm_
processes init.ora parameter must be set to at least one to enable repeat
notification functionality.
Important: Repeat notifications will only be sent if the Send Repeat
Notifications option is enabled in the Notification Methods page.](https://image.slidesharecdn.com/toaz-220630202557-58e3356d/75/toaz-info-oracle-enterprise-manager-13cpdf-pr_d27a8dfef1d5b8f2ea644bed24621723-pdf-164-2048.jpg)


![Sending Notifications Using OS Commands and Scripts
3-16 Oracle® Enterprise Manager Administration
You can edit an existing rule (or create a new instance rule), then go to the Methods
page. From the Setup menu, choose Incidents and then Incident Rules. The Incident
Rules page provides access to all available rule sets.
For detailed reference information on passing event, incident, and problem
information to an OS Command or script, see "Passing Event, Incident, Problem
Information to an OS Command or Script" on page 3-55.
3.3.1 Script Examples
The sample OS script shown in Example 3–6 appends environment variable entries to
a log file. In this example, the script logs a severity occurrence to a file server. If the file
server is unreachable then an exit code of 100 is returned to force the Oracle
Management Service Notification System to retry the notification
Example 3–6 Sample OS Command Script
#!/bin/ksh
LOG_FILE=/net/myhost/logs/event.log
if test -f $LOG_FILE
then
echo $TARGET_NAME $MESSAGE $EVENT_REPORTED_TIME >> $LOG_FILE
else
exit 100
fi
Example 3–7 shows an OS script that logs alert information for both incidents and
events to the file 'oscmdNotify.log'. The file is saved to the /net/myhost/logs
directory.
Example 3–7 Alert Logging Scripts
#!/bin/sh
#
LOG_FILE=/net/myhost/logs/oscmdNotify.log
echo '-------------' >> $LOG_FILE
echo 'issue_type=' $ISSUE_TYPE >> $LOG_FILE
echo 'notif_type=' $NOTIF_TYPE >> $LOG_FILE
echo 'message=' $MESSAGE >> $LOG_FILE
echo 'message_url' = $MESSAGE_URL >>$LOG_FILE
echo 'severity=' $SEVERITY >> $LOG_FILE
echo 'severity_code' = $SEVERITY_CODE >>$LOG_FILE
echo 'ruleset_name=' $RULESET_NAME >> $LOG_FILE
echo 'rule_name=' $RULE_NAME >> $LOG_FILE
echo 'rule_owner=' $RULE_OWNER >> $LOG_FILE
echo 'repeat_count=' $REPEAT_COUNT >> $LOG_FILE
echo 'categories_count' = $CATEGORIES_COUNT >>$LOG_FILE
echo 'category_1' = $CATEGORY_1 >>$LOG_FILE
echo 'category_2' = $CATEGORY_2 >>$LOG_FILE
echo 'category_code_1' = $CATEGORY_CODE_1 >>$LOG_FILE
echo 'category_code_2' = $CATEGORY_CODE_2 >>$LOG_FILE
echo 'category_codes_count' = $CATEGORY_CODES_COUNT >>$LOG_FILE
# event
if [ $ISSUE_TYPE -eq 1 ]
then
echo 'host_name=' $HOST_NAME >> $LOG_FILE](https://image.slidesharecdn.com/toaz-220630202557-58e3356d/75/toaz-info-oracle-enterprise-manager-13cpdf-pr_d27a8dfef1d5b8f2ea644bed24621723-pdf-168-2048.jpg)
![Sending Notifications Using OS Commands and Scripts
Using Notifications 3-17
echo 'event_type=' $EVENT_TYPE >> $LOG_FILE
echo 'event_name=' $EVENT_NAME >> $LOG_FILE
echo 'event_occurrence_time=' $EVENT_OCCURRENCE_TIME >> $LOG_FILE
echo 'event_reported_time=' $EVENT_REPORTED_TIME >> $LOG_FILE
echo 'sequence_id=' $SEQUENCE_ID >> $LOG_FILE
echo 'event_type_attrs=' $EVENT_TYPE_ATTRS >> $LOG_FILE
echo 'source_obj_name=' $SOURCE_OBJ_NAME >> $LOG_FILE
echo 'source_obj_type=' $SOURCE_OBJ_TYPE >> $LOG_FILE
echo 'source_obj_owner=' $SOURCE_OBJ_OWNER >> $LOG_FILE
echo 'target_name' = $TARGET_NAME >>$LOG_FILE
echo 'target_url' = $TARGET_URL >>$LOG_FILE
echo 'target_owner=' $TARGET_OWNER >> $LOG_FILE
echo 'target_type=' $TARGET_TYPE >> $LOG_FILE
echo 'target_version=' $TARGET_VERSION >> $LOG_FILE
echo 'lifecycle_status=' $TARGET_LIFECYCLE_STATUS >> $LOG_FILE
echo 'assoc_incident_escalation_level' = $ASSOC_INCIDENT_ESCALATION_LEVEL
>>$LOG_FILE
echo 'assoc_incident_id' = $ASSOC_INCIDENT_ID >>$LOG_FILE
echo 'assoc_incident_owner' = $ASSOC_INCIDENT_OWNER >>$LOG_FILE
echo 'assoc_incident_acknowledged_by_owner' = $ASSOC_INCIDENT_ACKNOWLEDGED_BY_
OWNER >>$LOG_FILE
echo 'assoc_incident_acknowledged_details' = $ASSOC_INCIDENT_ACKNOWLEDGED_
DETAILS >>$LOG_FILE
echo 'assoc_incident_priority' = $ASSOC_INCIDENT_PRIORITY >>$LOG_FILE
echo 'assoc_incident_status' = $ASSOC_INCIDENT_STATUS >>$LOG_FILE
echo 'ca_job_status' = $CA_JOB_STATUS >>$LOG_FILE
echo 'event_context_attrs' = $EVENT_CONTEXT_ATTRS >>$LOG_FILE
echo 'last_updated_time' = $LAST_UPDATED_TIME >>$LOG_FILE
echo 'sequence_id' = $SEQUENCE_ID >>$LOG_FILE
echo 'test_date_attr_noref' = $TEST_DATE_ATTR_NOREF >>$LOG_FILE
echo 'test_raw_attr_noref' = $TEST_RAW_ATTR_NOREF >>$LOG_FILE
echo 'test_str_attr1' = $TEST_STR_ATTR1 >>$LOG_FILE
echo 'test_str_attr2' = $TEST_STR_ATTR2 >>$LOG_FILE
echo 'test_str_attr3' = $TEST_STR_ATTR3 >>$LOG_FILE
echo 'test_str_attr4' = $TEST_STR_ATTR4 >>$LOG_FILE
echo 'test_str_attr5' = $TEST_STR_ATTR5 >>$LOG_FILE
echo 'test_str_attr_ref' = $TEST_STR_ATTR_REF >>$LOG_FILE
echo 'total_occurrence_count' = $TOTAL_OCCURRENCE_COUNT >>$LOG_FILE
fi
# incident
if [ $ISSUE_TYPE -eq 2 ]
then
echo 'action_msg=' $ACTION_MSG >> $LOG_FILE
echo 'incident_id=' $INCIDENT_ID >> $LOG_FILE
echo 'incident_creation_time=' $INCIDENT_CREATION_TIME >> $LOG_FILE
echo 'incident_owner=' $INCIDENT_OWNER >> $LOG_FILE
echo 'incident_acknowledged_by_owner' = $INCIDENT_ACKNOWLEDGED_BY_OWNER >>$LOG_
FILE
echo 'incident_status' = $INCIDENT_STATUS >>$LOG_FILE
echo 'last_modified_by=' $LAST_MODIFIED_BY >> $LOG_FILE
echo 'last_updated_time=' $LAST_UPDATED_TIME >> $LOG_FILE
echo 'assoc_event_count=' $ASSOC_EVENT_COUNT >> $LOG_FILE
echo 'adr_incident_id=' $ADR_INCIDENT_ID >> $LOG_FILE
echo 'occurrence_count=' $OCCURRENCE_COUNT >> $LOG_FILE
echo 'escalated=' $ESCALATED >> $LOG_FILE
echo 'escalated_level=' $ESCALATED_LEVEL >> $LOG_FILE
echo 'priority=' $PRIORITY >> $LOG_FILE
echo 'priority_code' = $PRIORITY_CODE >>$LOG_FILE
echo 'ticket_id=' $TICKET_ID >> $LOG_FILE](https://image.slidesharecdn.com/toaz-220630202557-58e3356d/75/toaz-info-oracle-enterprise-manager-13cpdf-pr_d27a8dfef1d5b8f2ea644bed24621723-pdf-169-2048.jpg)


![Sending SNMP Traps to Third Party Systems
Using Notifications 3-41
Example SNMP Trap Implementation
In this scenario, you want to identify the unique issues from the SNMP traps that are
sent. Keep in mind that all events that are related to the same issue are part of the same
event sequence. Each event sequence has a unique identification number.
An event sequence is a sequence of related events that represent the life of a specific
issue from the time it is detected and an event is raised to the time it is fixed and a
corresponding clear event is generated. For example, a warning metric alert event is
raised when the CPU utilization of a host crosses 80%. This starts the event sequence
representing the issue CPU Utilization of the host is beyond normal level. Another critical
event is raised for the same issue when the CPU utilization goes above 90% and the
event is added to the same event sequence. After a period of time, the CPU utilization
returns to a normal level and a clear event is raised. At this point, the issue is resolved
and the event sequence is closed.
The SNMP trap sent for this scenario is shown in Example 3–15. Each piece of
information is sent as a variable embedded in the SNMP Trap.
Example 3–15 SNMP Trap
**************V1 TRAP***[1]*****************
Community : public
Enterprise :1.3.6.1.4.1.111.15.2
Generic :6
Specific :3
TimeStamp :67809
Agent adress :10.240.36.109
1.3.6.1.4.1.111.15.3.1.1.2.1: NOTIF_NORMAL
1.3.6.1.4.1.111.15.3.1.1.3.1: CPU Utilization is 92.658%, crossed warning (80) or
critical (90) threshold.
1.3.6.1.4.1.111.15.3.1.1.4.1:
https://sampleserver.oracle.com:5416/em/redirect?pageType=sdk-core-event-console-d
etailEvent&issueID=C77AE9E578F00773E040F00A6D242F90
1.3.6.1.4.1.111.15.3.1.1.5.1: Critical
1.3.6.1.4.1.111.15.3.1.1.6.1: CRITICAL
1.3.6.1.4.1.111.15.3.1.1.7.1: 0
1.3.6.1.4.1.111.15.3.1.1.8.1:
1.3.6.1.4.1.111.15.3.1.1.9.1:
1.3.6.1.4.1.111.15.3.1.1.10.1: Aug 17, 2012 3:26:36 PM PDT
1.3.6.1.4.1.111.15.3.1.1.11.1: Capacity
1.3.6.1.4.1.111.15.3.1.1.12.1: Capacity
1.3.6.1.4.1.111.15.3.1.1.13.1: Metric Alert
1.3.6.1.4.1.111.15.3.1.1.14.1: Load:cpuUtil
1.3.6.1.4.1.111.15.3.1.1.15.1: 281
1.3.6.1.4.1.111.15.3.1.1.16.1:
1.3.6.1.4.1.111.15.3.1.1.17.1: No
1.3.6.1.4.1.111.15.3.1.1.18.1: New
1.3.6.1.4.1.111.15.3.1.1.19.1: None
1.3.6.1.4.1.111.15.3.1.1.20.1: 0
1.3.6.1.4.1.111.15.3.1.1.21.1: sampleserver.oracle.com
1.3.6.1.4.1.111.15.3.1.1.22.1:
https://sampleserver.oracle.com:5416/em/redirect?pageType=TARGET_
HOMEPAGE&targetName=sampleserver.oracle.com&targetType=host
1.3.6.1.4.1.111.15.3.1.1.23.1: Host
1.3.6.1.4.1.111.15.3.1.1.24.1: sampleserver.oracle.com
1.3.6.1.4.1.111.15.3.1.1.25.1: SYSMAN
1.3.6.1.4.1.111.15.3.1.1.26.1:
1.3.6.1.4.1.111.15.3.1.1.27.1: 5.8.0.0.0
1.3.6.1.4.1.111.15.3.1.1.28.1: Operating System=Linux, Platform=x86_64,](https://image.slidesharecdn.com/toaz-220630202557-58e3356d/75/toaz-info-oracle-enterprise-manager-13cpdf-pr_d27a8dfef1d5b8f2ea644bed24621723-pdf-193-2048.jpg)


![Notification Reference
Using Notifications 3-55
Get Property Command
emctl get [-sysman_pwd "sysman password"]-name
oracle.sysman.core.notification.short_format_length
Set Property Command
emctl set property -name oracle.sysman.core.notification.short_format_length
-value 155
Emoms Properties Entries for a Short Email Format
emctl set property -name oracle.sysman.core.notification.short_format_length
-value 155
emctl set property -name oracle.sysman.core.notification.short_format -value both
3.10.2 Passing Event, Incident, Problem Information to an OS Command or Script
The notification system passes information to an OS script or executable using system
environment variables.
Conventions used to access environmental variables vary depending on the operating
system:
■ UNIX: $ENV_VARIABLE
■ Windows:%ENV_VARIABLE%
The notification system sets the following environment variables before calling the
script. The script can then use any or all of these variables within the logic of the script.
3.10.2.1 Environment Variables Common to Event, Incident and Problem
Note: The following commands require an OMS restart in order for
the changes to take place.
Table 3–19 Generic Environment Variables
Environment Variable Description
NOTIF_TYPE Type of notification and possible values
NOTIF_NORMAL,
NOTIF_RETRY,
NOTIF_DURATION,
NOTIF_REPEAT,
NOTIF_CA,
NOTIF_RCA
REPEAT_COUNT How many times the notification has been sent out
before this notification.
RULESET_NAME The name of the ruleset that triggered this notification.
RULE_NAME The name of the rule that triggered this notification.
RULE_OWNER The owner of the ruleset that triggered this notification.
MESSAGE The message of the event, incident, or problem.
MESSAGE_URL EM console URL for this message.](https://image.slidesharecdn.com/toaz-220630202557-58e3356d/75/toaz-info-oracle-enterprise-manager-13cpdf-pr_d27a8dfef1d5b8f2ea644bed24621723-pdf-207-2048.jpg)


![Notification Reference
Using Notifications 3-77
send an email to the Sender's email address. Make sure this email is received. Note
that the Test button ignores any Notification Schedule.
■ Make sure an email address is set up. Clicking the Test button will send an email
to specified address and you should make sure this email is received. Note that the
Test button ignores any Notification Schedule.
■ Make sure an email schedule is defined. No emails will be sent unless a
Notification Schedule has been defined.
■ Make sure a incident rule is defined that matches the states you are interested and
make sure email and notification methods are assigned to the rule.
3.10.4.2 Notification System Errors
For any alerts involving problems with notifications, check the following for
notification errors.
■ Any serious errors in the Notification System are logged as system errors in the
MGMT_SYSTEM_ERROR_LOG table. From the Setup menu, select Management
Services and Repository to view these errors.
■ Check for any delivery errors. You can view them from Incident Manager. From
the Enterprise menu, select Monitoring, then select Incident Manager. The details
will give the reason why the notification was not delivered.
3.10.4.3 Notification System Trace Messages
The Notification System can produce trace messages in sysman/log/emoms.trc file.
Tracing is configured by setting the log4j.category.oracle.sysman.em.notification property
flag using the emctl set property command. You can set the trace level to INFO,
WARN, DEBUG. For example,
emctl set property -name log4j.category.oracle.sysman.em.notification -value
DEBUG -module logging
Note: The system will prompt you for the SYSMAN password.
Trace messages contain the string "em.notification". If you are working in a UNIX
environment, you can search for messages in the emoms.trc and emoms_pbs.trc files
using the grep command. For example,
grep em.notification emoms.trc emoms_pbs.trc
What to look for in the trace file.
The following entries in the emoms.trc file are relevant to notifications.
Normal Startup Messages
When the OMS starts, you should see these types of messages.
2011-08-17 13:50:29,458 [EventInitializer] INFO em.notification init.167 - Short
format maximum length is 155
2011-08-17 13:50:29,460 [EventInitializer] INFO em.notification init.185 - Short
format is set to both subject and body
2011-08-17 13:50:29,460 [EventInitializer] INFO em.notification init.194 -
Content-Transfer-Encoding is 8-bit
2011-08-17 13:50:29,460 [EventInitializer] DEBUG em.notification
registerAdminMsgCallBack.272 - Registering notification system message call back
2011-08-17 13:50:29,461 [EventInitializer] DEBUG em.notification
registerAdminMsgCallBack.276 - Notification system message callback is registered
successfully](https://image.slidesharecdn.com/toaz-220630202557-58e3356d/75/toaz-info-oracle-enterprise-manager-13cpdf-pr_d27a8dfef1d5b8f2ea644bed24621723-pdf-229-2048.jpg)
![Notification Reference
3-78 Oracle® Enterprise Manager Administration
2011-08-17 13:50:29,713 [EventInitializer] DEBUG em.notification
upgradeEmailTemplates.2629 - Enter upgradeEmailTemplates
2011-08-17 13:50:29,735 [EventInitializer] INFO em.notification
upgradeEmailTemplates.2687 - Email template upgrade is not required since no
customized templates exist.
2011-08-17 13:49:28,739 [EventCoordinator] INFO events.EventCoordinator logp.251
- Creating event worker thread pool: min = 4 max = 15
2011-08-17 13:49:28,791 [[STANDBY] ExecuteThread: '2' for queue:
'weblogic.kernel.Default (self-tuning)'] INFO emdrep.pingHBRecorder
initReversePingThreadPool.937 - Creating thread pool for reverse ping : min = 10
max = 50
2011-08-17 13:49:28,797 [[STANDBY] ExecuteThread: '2' for queue:
'weblogic.kernel.Default (self-tuning)'] DEBUG emdrep.HostPingCoordinator logp.251
- Creating thread pool of worker thread for host ping: min = 1 max = 10
2011-08-17 13:49:28,799 [[STANDBY] ExecuteThread: '2' for queue:
'weblogic.kernel.Default (self-tuning)'] DEBUG emdrep.HostPingCoordinator logp.251
- Creating thread pool for output of worker's output for host ping: min = 2 max =
20
2011-08-17 13:49:30,327 [ConnectorCoordinator] INFO
connector.ConnectorPoolManager logp.251 - Creating Event thread pool: min = 3 max
= 10
2011-08-17 13:51:48,152 [NotificationMgrThread] INFO notification.pbs logp.251 -
Creating thread pool: min = 6 max = 24
2011-08-17 13:51:48,152 [NotificationMgrThread] INFO em.rca logp.251 - Creating
RCA thread pool: min = 3 max = 20
Notification Delivery Messages
2006-11-08 03:18:45,387 [NotificationMgrThread] INFO em.notification run.682 -
Notification ready on EMAIL1
2006-11-08 03:18:46,006 [DeliveryThread-EMAIL1] INFO em.notification run.114 -
Deliver to SYSMAN/admin@myco.com
2006-11-08 03:18:47,006 [DeliveryThread-EMAIL1] INFO em.notification run.227 -
Notification handled for SYSMAN/admin@myco.com
Notification System Error Messages
2011-08-17 14:02:23,905 [NotificationMgrThread] DEBUG notification.pbs logp.251 -
Notification ready on EMAIL1
2011-08-17 14:02:23,911 [NotificationMgrThread] DEBUG notification.pbs logp.251 -
Notification ready on PLSQL4
2011-08-17 14:02:23,915 [NotificationMgrThread] DEBUG notification.pbs logp.251 -
Notification ready on OSCMD14
2011-08-17 14:02:19,057 [DeliveryThread-EMAIL1] INFO notification.pbs logp.251 -
Deliver to To: my.admin@myco.com; issue type: 1; notification type: 1
2011-08-17 14:02:19,120 [DeliveryThread-OSCMD14] INFO notification.pbs logp.251 -
Deliver to SYSMAN, OSCMD, 8; issue type: 1; notification type: 1
2011-08-17 14:02:19,346 [DeliveryThread-PLSQL4] INFO notification.pbs logp.251 -
Deliver to SYSMAN, LOG_JOB_STATUS_CHANGE, 9; issue type: 1; notification type: 1
2011-08-17 14:02:19,977 [DeliveryThread-PLSQL4] DEBUG notification.pbs logp.251 -
Notification handled for SYSMAN, LOG_JOB_STATUS_CHANGE, 9
2011-08-17 14:02:20,464 [DeliveryThread-EMAIL1] DEBUG notification.pbs logp.251 -
Notification handled for To: my.admin@myco.com
2011-08-17 14:02:20,921 [DeliveryThread-OSCMD14] DEBUG notification.pbs logp.251 -
Notification handled for SYSMAN, OSCMD, 8](https://image.slidesharecdn.com/toaz-220630202557-58e3356d/75/toaz-info-oracle-enterprise-manager-13cpdf-pr_d27a8dfef1d5b8f2ea644bed24621723-pdf-230-2048.jpg)


![System Broadcasts
Using Notifications 3-81
3. Check the desired broadcast message preferences then click Save.
Whenever you send a system broadcast message, these are the preferences that
will be used.
Creating a System Broadcast
Once your preferences are set, you use the EM CLI verb send_system_broadcast to send
a system broadcast message.
emcli send_system_broadcast
-toOption="ALL|SPECIFIC"
[-to="comma separated user names"]
[-messageType="INFO|CONF|WARN|ERROR|FATAL" (default is INFO)]
-message="message details"
Options
■ toOption
Enter the value ALL to send the broadcast message to all users logged into the
Enterprise Manager Console. Or enter SPECIFIC to send System Broadcast to
users specified by -to.
■ to
Comma-separated list of users who are to receive the broadcast message. This
option can only be used if the -toOption is set to SPECIFIC.
■ messageType
Type of System Broadcast, it can be one of following types
– INFO (Information)
– CONF (Confirmation)
– WARN (Warning)
Note: The Number of seconds to show the System Broadcast setting will
only work when the Do not automatically close System Broadcast sent by
the super administrator option is disabled.](https://image.slidesharecdn.com/toaz-220630202557-58e3356d/75/toaz-info-oracle-enterprise-manager-13cpdf-pr_d27a8dfef1d5b8f2ea644bed24621723-pdf-233-2048.jpg)


![Controlling Blackouts Using the Command Line Utility
4-6 Oracle® Enterprise Manager Administration
Use the following examples to learn more about controlling blackouts from the
Enterprise Manager command line:
■ To start a blackout called "bk1" for databases "db1" and "db2," and for Oracle
Listener "ldb2," enter the following command:
$PROMPT> emctl start blackout bk1 db1 db2 ldb2:oracle_listener -d 5 02:30
The blackout starts immediately and will last for 5 days 2 hours and 30 minutes.
■ To check the status of all the blackouts on a managed host:
$PROMPT> emctl status blackout
■ To stop blackout "bk2" immediately:
$PROMPT> emctl stop blackout bk2
■ To start an immediate blackout called "bk3" for all targets on the host:
$PROMPT> emctl start blackout bk3 -nodeLevel
■ To start an immediate blackout called "bk3" for database "db1" for 30 minutes:
$PROMPT> emctl start blackout bk3 db1 -d 30
Table 4–1 Summary of Blackout Commands
Blackout Action Command
Set an immediate blackout
on a particular target or list
of targets
emctl start blackout <Blackoutname>
[<Target_name>[:<Target_Type>]]....
[-d <Duration>]
Be sure to use a unique name for the blackout so you can refer to
it later when you want to stop or check the status of the
blackout.
The -d option is used to specify the duration of the blackout.
Duration is specified in [days] hh:mm where:
■ days indicates number of days, which is optional
■ hh indicates number of hours
■ mm indicates number of minutes
If you do not specify a target or list of targets, Enterprise
Manager will blackout the local host target. All monitored
targets on the host are not blacked out unless a list is specified or
you use the -nodelevel argument.
If two targets of different target types share the same name, you
must identify the target with its target type.
Stop an immediate blackout emctl stop blackout <Blackoutname>
Set an immediate blackout
for all targets on a host
emctl start blackout <Blackoutname> [-nodeLevel] [-d
<Duration>]
The -nodeLevel option is used to specify a blackout for all the
targets on the host; in other words, all the targets that the
Management Agent is monitoring, including the Management
Agent host itself. The -nodeLevel option must follow the
blackout name. If you specify any targets after the -nodeLevel
option, the list is ignored.
Check the status of a
blackout
emctl status blackout [<Target_name>[:<Target_Type>]]....](https://image.slidesharecdn.com/toaz-220630202557-58e3356d/75/toaz-info-oracle-enterprise-manager-13cpdf-pr_d27a8dfef1d5b8f2ea644bed24621723-pdf-240-2048.jpg)


![Managing Groups
5-8 Oracle® Enterprise Manager Administration
violations associated with the members of the Dynamic Group in graphical
format.
8. Click the Access tab. Use the Access page to administer access privileges for the
group. On the Access page you can grant target access to Enterprise Manager roles
and grant target access to Enterprise Manager administrators.
9. Click OK to create the Dynamic Group.
5.2.3 Adding Members to Privilege Propagating Groups
The target privileges granted on a propagating group are propagated to member
targets. The administrator grants target objects scoped to another administrator, and
the grantee maintains the same privileges on member targets. The propagating groups
maintain the following features:
■ The administrator with a Create Privilege Propagating Group privilege will be
able to create a propagating group
■ To add a target as a member of a propagating group, the administrator must have
Full target privileges on the target
You can add any non-aggregate target as the member of a privilege propagating
group. For aggregate targets in Cloud Control version 12c, cluster and RAC databases
and other propagating groups can be added as members. Cloud Control version 12c
supports more aggregate target types, such as redundancy systems, systems and
services.
If you are not the group creator, you must have at least the Full target privilege on the
group to add a target to the group.
5.2.4 Converting Conventional Groups to Privilege Propagating Groups
In Enterprise Manager release 12c you can convert conventional groups to privilege
propagating groups (and vice-versa) through the use of the specified EM CLI verb.
Two new parameters have been added in the modify_group EM CLI verb:
■ privilege_propagation
This parameter is used to modify the privilege propagation behavior of the group.
The possible value of this parameter is either true or false.
■ drop_existing_grants
This parameter indicates whether existing privilege grants on that group are to be
revoked at the time of converting a group from privilege propagation to normal
(or vice versa). The possible values of this parameter are yes or no. The default
value of this parameter is yes.
These same enhancements have been implemented on the following EM CLI verbs:
modify_system, modify_redundancy_group, and modify_aggregrate_service.
The EM CLI verb is listed below:
emcli modify_group
-name="name"
[-type=<group>]
[-add_targets="name1:type1;name2:type2;..."]...
[-delete_targets="name1:type1;name2:type2;..."]...
[-privilege_propagation = true/false]
[-drop_existing_grants = Yes/No]](https://image.slidesharecdn.com/toaz-220630202557-58e3356d/75/toaz-info-oracle-enterprise-manager-13cpdf-pr_d27a8dfef1d5b8f2ea644bed24621723-pdf-250-2048.jpg)


![Working with Metric Extensions
8-12 Oracle® Enterprise Manager Administration
■ Add Delta metric columns based on another metric column
Example: You want to know the difference in the table space used since the
last collection.
Delta Calculation:
current metric value - previous metric value
■ Add Rate Per Minute metric column based on another metric column
Example: You want to know the average table space usage per minute based
on the table space column metric which is collected every 1 hr.
Rate Per Minute Calculation:
(current metric value - previous metric value)/ collection schedule
where the collection schedule is in minutes.
■ Add Rate Per Five Minutes metric column based on another metric column
Example: You want to know the average table space usage every five minutes
based on the table space column which is collected say every 1 hour]
Rate Per Five Minute Calculation:
[(current metric value - previous metric value)/ collection schedule ] * 5
where the collection schedule is in minutes.
To create a rate/delta metric column, click on an existing data column in the table
and then select one of the rate/delta column options from the Add menu.
6. From the Credentials page, you can override the default monitoring credentials by
using custom monitoring credential sets. By default, the metric extension wizard
chooses the existing credentials used by Oracle out-of-box metrics for the
particular target type. For example, metric extensions will use the dbsnmp user for
database targets. You have the option to override the default credentials, by
creating a custom monitoring credential set through the "emcli create_credential_
set" command. Refer to the Enterprise Manager Command Line Interface Guide for
additional details. Some adapters may use additional credentials, refer to the
Adapters section for specific information.
7. From the Test page, add available test targets.
8. Click Run Test to validate the metric extension. The extension is deployed to the
test targets specified by the user and a real-time collection is executed. Afterwards,
the metric extension is automatically undeployed. The results and any errors are
added to the Test Results region.](https://image.slidesharecdn.com/toaz-220630202557-58e3356d/75/toaz-info-oracle-enterprise-manager-13cpdf-pr_d27a8dfef1d5b8f2ea644bed24621723-pdf-310-2048.jpg)


![Adapters
8-20 Oracle® Enterprise Manager Administration
Example: You want to know the average table space usage per minute based
on the table space column metric which is collected every 1 hr.
Rate Per Minute Calculation:
(current metric value - previous metric value)/ collection schedule
where the collection schedule is in minutes.
■ Add Rate Per Five Minutes metric column based on another metric column
Example: You want to know the average table space usage every five minutes
based on the table space column which is collected say every 1 hour]
Rate Per Five Minute Calculation:
[(current metric value - previous metric value)/ collection schedule ] * 5
where the collection schedule is in minutes.
To create a rate/delta metric column, click on an existing data column in the table
and then select one of the rate/delta column options from the Add menu.
7. From the Test page, add available test targets.
8. Click Run Test to validate the metric extension. The extension is deployed to the
test targets specified by the user and a real-time collection is executed. Afterwards,
the metric extension is automatically undeployed. The results and any errors are
added to the Test Results region.
9. Repeat the edit /test cycle until the metric extension returns data as expected.
10. Click Finish.
8.4 Adapters
Oracle Integration Adapters provide comprehensive, easy-to-use monitoring
connectivity with a variety of target types. The adapter enables communication with
an enterprise application and translates the application data to standards-compliant
XML and back.
The metric extension target type determines which adapters are made available from
the UI. For example, when creating a metric extension for an Automatic Storage
Management target type, only three adapters (OS Command-Single Column, OS
Command-Multiple Columns, and SQL) are available from the UI.](https://image.slidesharecdn.com/toaz-220630202557-58e3356d/75/toaz-info-oracle-enterprise-manager-13cpdf-pr_d27a8dfef1d5b8f2ea644bed24621723-pdf-318-2048.jpg)


![Converting User-defined Metrics to Metric Extensions
Using Metric Extensions 8-31
Name: migration1
Desc: Convert UDMs for host target
Created: <date> <time>
UDM Pick: [hostudm1]
UDMs being converted:
----------+----------+---------+------+------------+---------+---------+-----
Type |Name |UDM |#MC |Metric |Column |DepS |DelS
----------+----------+---------+------+------------+---------+---------+-----
host |host1 |hostudm1 | 0 | | |WAIT |WAIT
----------+----------+---------+------+------------+---------+---------+-----
The command provides the status of a single migration session. It lists the name of the
UDM and the target type and name of the target on which the UDM resides. In
addition, it also outlines the metric extensions currently in the EM instance that match
the UDM. The user can elect to use one of the existing choices or create an entirely new
metric extension.
The system attempts to find compatible metric extensions by matching the properties
of the UDM. For example, in the case of a host UDM, the system tries to find a metric
extension that has the same command, script and argument fields. In the case of a
database UDM, the system attempts to match the SQL query.
Finally, the DepS column indicates whether the metric extension that was matched to
the UDM has been deployed to the target on which the UDM is defined. The DelS
column tells the user whether the UDM has been deleted after the metric extension has
been deployed. As the user proceeds with the migration, the above table is updated
from left to right. When the delete status column is set to complete, the migration
session has ended.
$ emcli udmmig_submit_metricpicks -session_id=1 -input_file=metric_picks:filename
Successfully submitted metric picks for migration session
The command instructs the Enterprise Manager instance to use an existing metric
extension or create a new one to replace the UDM. The various options are presented
through a file, which is filename in the above command. The contents of the file are
shown below
"host,host1,hostudm1,N,ME$me1,Usage"
Each line in the file represents a mapping from n UDM to an ME. The line provides the
target type, the name of the target, the name of the UDM, a flag to indicate whether
the metric extension is new (N) or existing (E), the name of the metric extension (note
that ME$ must be prefixed) and the column name.
The types of UDMs supported are:
■ Host (host)
■ Database (oracle_database)
■ RAC (rac_database)
A user can only specify the names of the data columns via the collection item portion
of the file. A metric extension created through migration will always have two
columns to represent the structure of the UDM. The first column is an index column
for single column UDMs while the second column uses the column name mentioned
in the file. In the case of two column UDMs, the first column of the ME is termed as
the 'KEY' column and the collection name is used for the second column.
At this stage, the metric extension has been created and is visible in the metric
extensions library.](https://image.slidesharecdn.com/toaz-220630202557-58e3356d/75/toaz-info-oracle-enterprise-manager-13cpdf-pr_d27a8dfef1d5b8f2ea644bed24621723-pdf-329-2048.jpg)
![Converting User-defined Metrics to Metric Extensions
8-32 Oracle® Enterprise Manager Administration
$ emcli udmmig_session_details -session_id=1
Name: migration1
Desc: Convert UDMs for host target
Created: <date> <time>
UDM Pick: [hostudm1]
Udms being converted:
----------+--------+---------+------+----------+------------+---------+-----
Type |Name |UDM |#MC |Metric |Column |DepS |DelS
----------+--------+---------+------+----------+------------+---------+-----
host |host1 |hostudm1 | 1 | ME$me1 | Usage |WAIT |WAIT
----------+--------+---------+------+----------+------------+---------+-----
#MC : There are 1 matches for udms in this session.
Use emcli udmmig_list_matches to list available matches
The session details command indicates that there is one matching metric extension for
this UDM (the value of the MC column is 1) and that metric extension is named as
ME$me1. At this stage, we are ready to test the metric extension through the library
page. Once the testing is complete and the user is satisfied with the metric extension
that has been created, it is ready to be deployed. In order to deploy, the metric
extension has to be minimally saved as a deployable draft.
$ emcli udmmig_retry_deploys -session_id=1 -input_file=metric_tasks:filename2
Metric Deployments successfully submitted
Note that the system will trigger a job to automatically deploy the metric extension to
all targets where the UDM was present once the metric extension is published. If the
user is interested in manually controlling the operation, the above command will
perform the necessary steps. The command is similar to the submit_metricpicks option
in that a file with the UDM to target mapping is provided. It is referred to by filename2
above. The contents of the file are as follows
"host,host1,hostudm1"
Each line in the file is a mapping from the UDM to the targets type and target on
which it resides. Once the command is executed, jobs to deploy the metric extensions
to various targets have been launched and can be tracked through the user interface.
$ emcli udmmig_request_udmdelete -session_id=1 -input_file=metric_tasks:demo_tasks
Udm deletes successfully submitted
The final command deletes the UDMs that were migrated to metric extensions. Note
that this command might partially finish based on how many of the deployments were
completed when the command was run.
$ emcli udmmig_session_details -session_id=1
Name: migration1
Desc: Convert UDMs for host target
Created: <date > <time>
Completed: <date > <time>
UDM Pick: [hostudm1]
Udms being converted:
--------+----------+---------+------+------------+------------+---------+-----
Type |Name |UDM |#MC |Metric |Column |DepS |DelS
--------+----------+---------+------+------ ----+------------+---------+-----
host |host1 |hostudm1 | 1 | ME$me1 | Usage |COMP |COMP
--------+----------+---------+------+------------+------------+---------+-----](https://image.slidesharecdn.com/toaz-220630202557-58e3356d/75/toaz-info-oracle-enterprise-manager-13cpdf-pr_d27a8dfef1d5b8f2ea644bed24621723-pdf-330-2048.jpg)


![Metric Extension Command Line Verbs
Using Metric Extensions 8-35
Options:
-target_type=<target type>
Target type of the metric extension.
-name=<name>
Name of the metric extension.
-version=<version>
Version of the metric extension to be saved to draft.
User-Defined Metric Verbs
emcli abort_udmmig_session
-session_id=<sessionId>
[-input_file=specific_tasks:<complete path to file>]
Description:
Abort the migration of user-defined metrics to MEs in a session
Options:
-session_id=<id of the session>
Specify the id that was returned at time of session created,
or from the output of udmmig_summary
[-input_file=specific_tasks:<complete file path>]
This optional parameter points at a file name that contains a
target, user-defined metric,
one per line in the following format:
<targetType>,<targetName>,<collection name>
Use targetType=Template to indicate a template
Use * for collection name to abort all user-defined metrics for a target
emcli analyze_unconverted_udms [-session_id=<sessionId>]
Description:
Analyze user-defined metrics and list unique user-defined metrics, any
possible matches, and
templates that can apply these matching metric extensions
Options:
-session_id=<id of a session to be reanalyzed>
Not specifying a session id causes the creation of a analysis
session that contains all unconverted user-defined metrics. You can specify
this session id in future invocations to get fresh analysis.
emcli create_udmmig_session
-name=<name of the session>
-desc=<description of the session>
[-udm_choice=<specific udm to convert>]*
{-target=<type:name of the target to migrate> }*
| {-input_file=targetList:<complete path to file>}; {-template=<name of
the template to update> }*
| {-input_file=templateList:<complete path to file>}
[-allUdms]
Description:
Creates a session to migrate user-defined metrics to metric extensions for
targets.
Options:
-name=<session name>](https://image.slidesharecdn.com/toaz-220630202557-58e3356d/75/toaz-info-oracle-enterprise-manager-13cpdf-pr_d27a8dfef1d5b8f2ea644bed24621723-pdf-333-2048.jpg)
![Metric Extension Command Line Verbs
8-36 Oracle® Enterprise Manager Administration
The name of the migration session to be created.
-desc=<session session description>
A description of the migration session to be created.
-udm_choice=<udm name>
If the session should migrate specific user-defined metrics, specify them
Otherwise, all user-defined metrics will be migrated
-target=<type:name of target to migrate>
The type:name of the target to be updated.
Multiple values may be specified.
-input_file=targetList:<complete file path>
This takes a file name that contains a list of targets,
one per line in the following format:
<targetType>:<targetName>
-template=<name of template to migrate>
The name of the template to update.Multiple values may be specified
-input_file=templateList:<complete file path>
This takes a file name that contains a list of templates,
one name per line
-allUdms
This forces the session to contain all user-defined metrics from targets and
templates (default behavior just picks those not in a session)
emcli list_unconverted_udms [-templates_only]
Description:
Get the list of all user-defined metrics that are not yet in a migration
session
Options:
-templates_only
Only lists unconverted user-defined metrics in templates.
emcli udmmig_list_matches
-session_id=<sessionId>
Description:
Lists the matching metrics per user-defined metric in a migration session
Options:
-session_id=<id of the session>
Specify the id that was returned at time of session created,
or from the output of udmmig_summary
emcli udmmig_request_udmdelete
-session_id=<sessionId>
-input_file=metric_tasks:<complete path to file>
Description:
Delete the user-defined metrics that have been replaced by Metric Extenions
Options:
-session_id=<id of the session>
Specify the id that was returned at time of session created,
or from the output of udmmig_summary
-input_file=metric_tasks:<complete file path>
This takes a file name that contains a target, user-defined metric,
one per line in the following format:
<targetType>,<targetName>,<collection name>](https://image.slidesharecdn.com/toaz-220630202557-58e3356d/75/toaz-info-oracle-enterprise-manager-13cpdf-pr_d27a8dfef1d5b8f2ea644bed24621723-pdf-334-2048.jpg)
![Metric Extension Command Line Verbs
Using Metric Extensions 8-37
emcli udmmig_retry_deploys
-session_id=<sessionId>
-input_file=metric_tasks:<complete path to file>
Description:
Retry the deployment of metric extensions to a target
Options:
-session_id=<id of the session>
Specify the id that was returned at time of session created,
or from the output of udmmig_summary
-input_file=metric_tasks:<complete file path>
This takes a file name that contains a target, user-defined metric,
one per line in the following format:
<targetType>,<targetName>,<collection name>
emcli udmmig_submit_metricpicks
-session_id=<sessionId>
-input_file=metric_picks:<complete path to file>
Description:
Supply the metric picks to use to replace user-defined metrics per target in a
session
Options:
-session_id=<id of the session>
Specify the id that was returned at time of session created,
or from the output of udmmig_summary
-input_file=metric_picks:<complete file path>
This takes a file name that contains a target, user-defined metric, metric
pick,
one per line in the following format:
<targetType>,<targetName>,<collection name>,[N/E],<metric>,<column>
using N if a new metric should be created or E if an existing
metric is referenced.
emcli udmmig_summary
[-showAll]
Description:
Gets the summary details of all migration sessions in progress
Options:
-showAll
This prints out all sessions including those that are complete.
By default, only in-progress sessions are listed.
emcli udmmig_update_incrules
-session_id=<sessionId>
-input_file=udm_inc_rules:<complete path to file>
Description:
Update Incident Rules that reference user-defined metrics with a reference to
replacing metric extension.
Options:](https://image.slidesharecdn.com/toaz-220630202557-58e3356d/75/toaz-info-oracle-enterprise-manager-13cpdf-pr_d27a8dfef1d5b8f2ea644bed24621723-pdf-335-2048.jpg)


![Configuring Always-On Monitoring
Always-On Monitoring 12-7
SEQUENCE, CREATE SYNONYM, CREATE TABLE, CREATE TRIGGER, CREATE TYPE, CREATE VIEW,
UNLIMITED TABLESPACE, SELECT ANY DICTIONARY to ems;
SQL> grant EXECUTE ON SYS.DBMS_CRYPTO to ems;
SQL> grant EXECUTE ON SYS.DBMS_AQADM to ems;
SQL> grant EXECUTE ON SYS.DBMS_AQ to ems;
SQL> grant EXECUTE ON SYS.DBMS_AQIN to ems;
SQL> grant EXECUTE on SYS.DBMS_LOCK to ems;
SQL> grant EXECUTE ON SYS.DBMS_SCHEDULER to ems;
SQL> grant create job to ems;
12.2.3 Installing Always-On Monitoring
Always-On Monitoring is a self-contained application that is supplied with the
Enterprise Manager software distribution (located in the sysman/ems directory) and is
also available via the Self-Update function in Enterprise Manager. From either source,
find the Always-On Monitoring installation zip file, ems_13.1.0.0.0.zip and unzip that
file in the location you have selected to install Always-On Monitoring.
12.3 Configuring Always-On Monitoring
Once Always-On Monitoring has been installed, the Always-On Monitoring
configuration assistant script is used to configure the service to communicate with the
Enterprise Manager installation that it will monitor.
Always-On Monitoring configuration involves the following steps:
1. Using the Always-On Monitoring Configuration Assistant (EMSCA)
2. Configuring Email Servers in Enterprise Manager
3. Configuring Downtime Contacts in Enterprise Manager
4. Synchronizing Always-On Monitoring with Enterprise Manager for the First Time
5. Configuring Enterprise Manager to Work with Always-On Monitoring
12.3.1 Using the Always-On Monitoring Configuration Assistant (EMSCA)
The Always-On Monitoring configuration assistant is a script located under the
Always-On Monitoring installation scripts directory. The following assumes
Always-On Monitoring is installed in a location referred to using the environment
variable EMS_HOME.
Run the configuration assistant located in $EMS_HOME/scripts. The EMSCA may be
invoked with no parameters and will prompt for the necessary information. Once the
configuration has completed, record the Always-On Monitoring Upload URL as it will
be used later to configure Enterprise Manager.
Example:
$ ./emsca
Oracle Enterprise Manager Cloud Control 13c Release 1
Copyright (c) 1996, 2015 Oracle Corporation. All rights reserved.
---------------------------------------------------------------
Always-On Monitoring Repository Connection String : myserver:35074:semgc3
Create Always-On Monitoring Repository User [n] :
Always-On Monitoring Repository SYSDBA Username : sys
Always-On Monitoring Repository SYSDBA Password :
Always-On Monitoring Repository Username [ems] :
Always-On Monitoring Repository Password [ems] :
Enterprise Manager Repository Connection String : myserver:35074:semgc3](https://image.slidesharecdn.com/toaz-220630202557-58e3356d/75/toaz-info-oracle-enterprise-manager-13cpdf-pr_d27a8dfef1d5b8f2ea644bed24621723-pdf-405-2048.jpg)


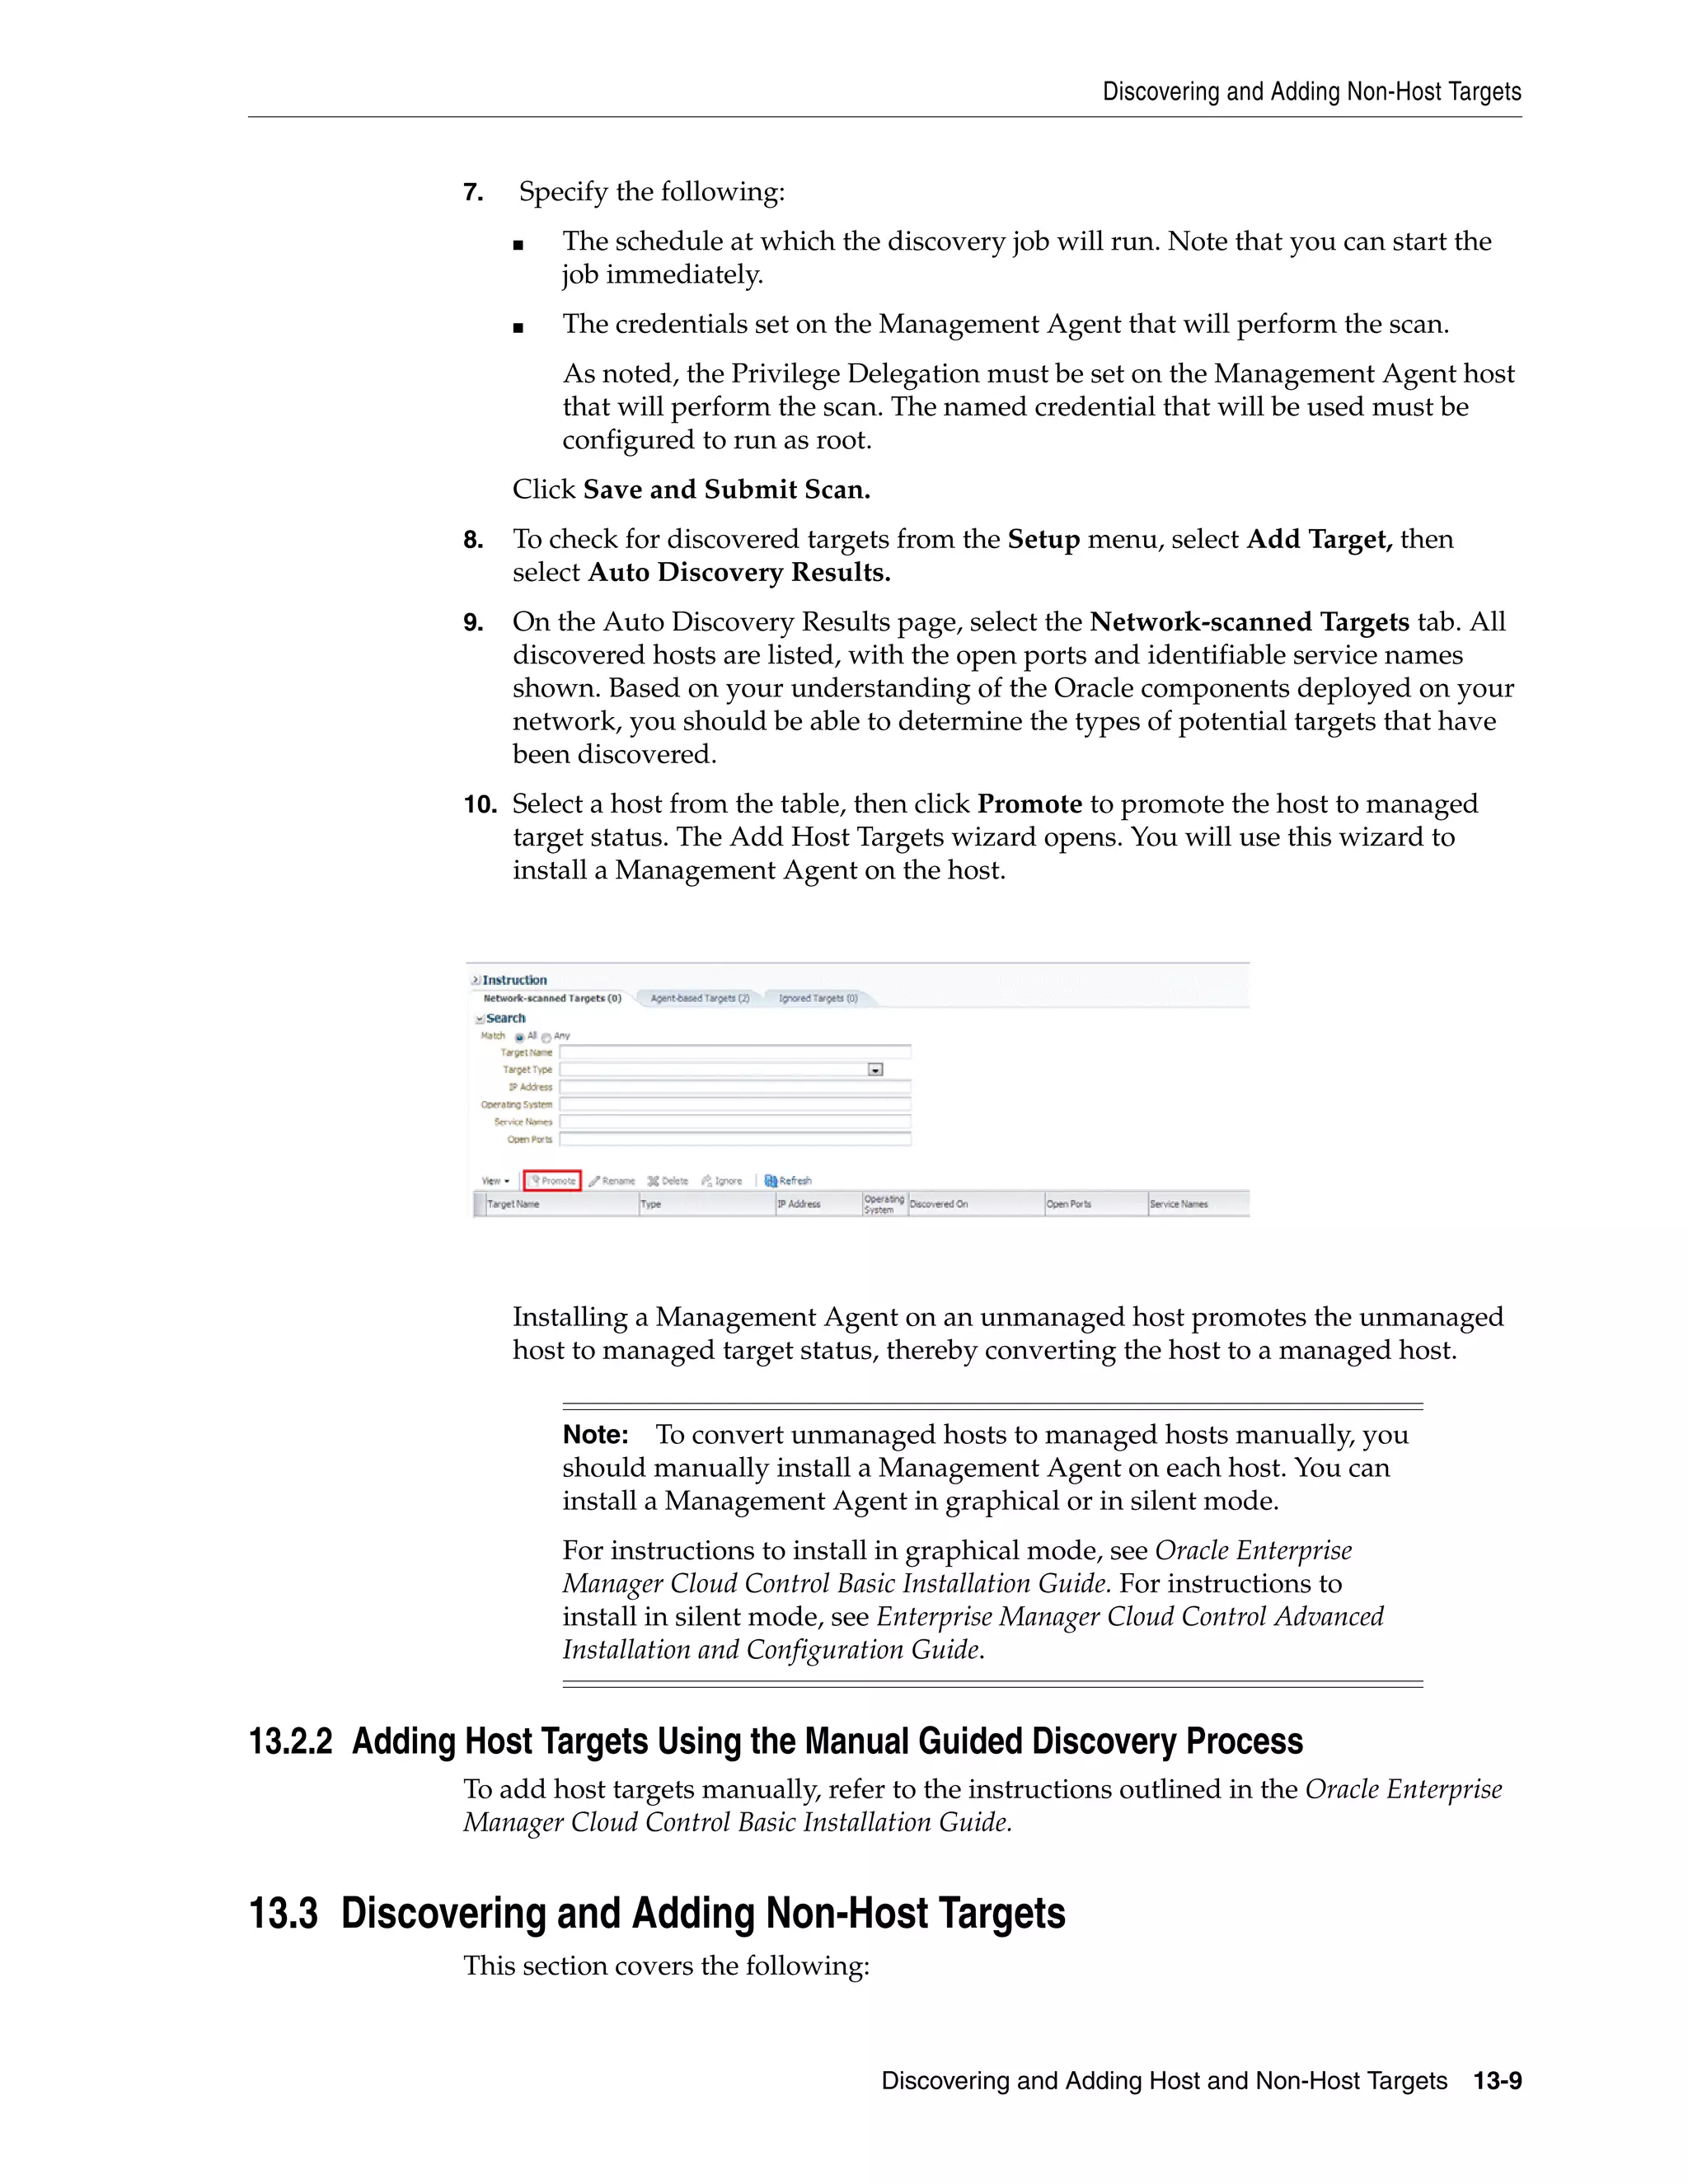


![Retrieving Deleted Targets
Discovering and Adding Host and Non-Host Targets 13-17
13.5 Retrieving Deleted Targets
This sections covers the following:
■ Retrieving Deleted Target Types
■ Retrieving Deleted Host and Corresponding Management Agent Targets
13.5.1 Retrieving Deleted Target Types
If you have deleted one or more targets (such as a database target or a weblogic
domain, or any other target), you can retrieve them and add them back to the
Enterprise Manager Cloud Control Console. If autodiscovery is configured on the host
where the targets were present, the targets are automatically discovered during the
next scheduled autodiscovery operation. Once they are autodiscovered, you can
promote them and add them to the console. If autodiscovery is not configured on the
host where the targets were present, you have to discover the targets using one of the
following methods:
■ By enabling autodiscovery as described in Section 13.3.1 to automatically discover
and promote the targets in the next scheduled autodiscovery operation.
■ By using the guided discovery process as described in Section 13.3.2 to manually
discover and add the discovered targets to the console.
■ By specifying the target monitoring properties for each target as described in
Section 13.3.3 to manually discover and add the discovered targets to the console.
■ By using the following EM CLI verb:
$ emcli add_target
-name="name"
-type="type"
-host="hostname"
[-properties="pname1:pval1;pname2:pval2;..."]
[-separator=properties="sep_string"]
[-subseparator=properties="subsep_string"]
[-credentials="userpropname:username;pwdpropname:password;..."]
[-input_file="parameter_tag:file_path"]
[-display_name="display_name"]
[-groups="groupname1:grouptype1;groupname2:grouptype2;..."]
[-timezone_region="gmt_offset"]
[-monitor_mode="monitor_mode"]
Note: If you submit the discovery job without specifying a path, a
discovery of the whole host will be performed. In order for a Home to
be discoverable by the Management Agent, it needs to be registered in
an inventory that the Management Agent recognizes. The default
inventory is the central inventory, which in Unix systems is found in
/etc/oraInst.loc. Any Home registered here will automatically be
discovered.
If there are other inventories in the host, they need to be added to the
inventory list of the Management Agent. A line must be added to
$EMSTATE/sysman/config/OUIinventories.add.
If the inventory is not found here, the Management Agent will not
know of its existence, and hence any Home registered there will not be
discovered.](https://image.slidesharecdn.com/toaz-220630202557-58e3356d/75/toaz-info-oracle-enterprise-manager-13cpdf-pr_d27a8dfef1d5b8f2ea644bed24621723-pdf-441-2048.jpg)
![Retrieving Deleted Targets
13-18 Oracle® Enterprise Manager Administration
[-instances="rac_database_instance_target_name1:target_type1;..."]
[-force]
[-timeout="time_in_seconds"]
[ ] indicates that the parameter is optional
For more information, access the following URL:
http://docs.oracle.com/cd/E24628_01/em.121/e17786/cli_verb_
ref.htm#CACHFHCA
13.5.2 Retrieving Deleted Host and Corresponding Management Agent Targets
If you have deleted a host target and the corresponding Management Agent target,
you can retrieve both of them. To do so, follow these steps:
Discover and add the host and the Management Agent by running the following
command from the agent instance home of the corresponding host:
$ emctl config agent addInternalTargets
Once the host and the Management Agent are discovered and added to the console,
add each target on that host as targets to be monitored in the console, by running the
following EM CLI verb:
$ emcli add_target
-name="name"
-type="type"
-host="hostname"
[-properties="pname1:pval1;pname2:pval2;..."]
[-separator=properties="sep_string"]
[-subseparator=properties="subsep_string"]
[-credentials="userpropname:username;pwdpropname:password;..."]
[-input_file="parameter_tag:file_path"]
[-display_name="display_name"]
[-groups="groupname1:grouptype1;groupname2:grouptype2;..."]
[-timezone_region="gmt_offset"]
[-monitor_mode="monitor_mode"]
[-instances="rac_database_instance_target_name1:target_type1;..."]
[-force]
[-timeout="time_in_seconds"]
[ ] indicates that the parameter is optional
For more information, access the following URL:
http://docs.oracle.com/cd/E24628_01/em.121/e17786/cli_verb_
ref.htm#CACHFHCA](https://image.slidesharecdn.com/toaz-220630202557-58e3356d/75/toaz-info-oracle-enterprise-manager-13cpdf-pr_d27a8dfef1d5b8f2ea644bed24621723-pdf-442-2048.jpg)
![14
Discovering and Adding Database Targets 14-1
14Discovering and Adding Database Targets
[2]This chapter describes how you can discover and add database targets to be managed
by Enterprise Manager Cloud Control. In particular, this chapters covers the following:
■ Enabling Autodiscovery of Database Targets
■ Discovering and Adding Container Database and Pluggable Database Targets
■ Discovering and Adding Cluster Database Targets
■ Discovering and Adding Single Instance Database Targets
■ Discovering and Adding Cluster Targets
■ Discovering and Adding Single Instance High Availability Service Targets
■ Discovering and Adding Cluster Automatic Storage Management Targets
■ Configuring a Target Database for Secure Monitoring
14.1 Enabling Autodiscovery of Database Targets
Autodiscovery of database targets is enabled by default. If autodiscovery has been
disabled, you can enable it, by following these steps:
1. From the Setup menu, select Add Target, then select Configure Auto Discovery.
2. On the Configure Auto Discovery page, in the Agent-based Auto Discovery table,
select Oracle Database, Listener, and Automatic Storage Management.
3. On the Configure Target Discovery page, click Add Host.](https://image.slidesharecdn.com/toaz-220630202557-58e3356d/75/toaz-info-oracle-enterprise-manager-13cpdf-pr_d27a8dfef1d5b8f2ea644bed24621723-pdf-443-2048.jpg)