Statistical Analysis
In economicsand business, there is a wide range of
problems that have the same procedure of solution. For
example,
• Use a sample of sales receivable for a company to
estimate the mean dollar value of all sales receivables
held by the company.
• Use a sample of cereal box weights to estimate the
mean weight of all cereal boxes produced in a particular
week.
This procedure is called the statistical analysis.
2
3.
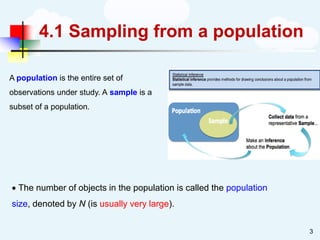
4.1 Sampling froma population
• The number of objects in the population is called the population
size, denoted by N (is usually very large).
3
A population is the entire set of
observations under study. A sample is a
subset of a population.
4.
Example
◼ Note: Populationis modeled as a RV, denoted by X.
◼ Eg: Estimate the mean of the number turning up
◼ Population RV:
X = The number turning up when throwing a fair die
(X = The value obtained when we measure an object in the population)
◼ Throwing a die two times → a sample of size 2:
X1: The number turning up for the 1st time
X2: The number turning up for the 2nd time
→ A sample (X1, X2)
4
5.
4.1 Sampling froma population
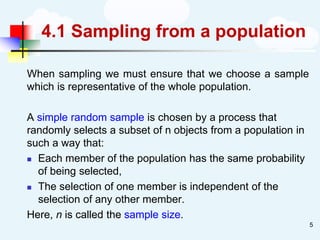
When sampling we must ensure that we choose a sample
which is representative of the whole population.
A simple random sample is chosen by a process that
randomly selects a subset of n objects from a population in
such a way that:
◼ Each member of the population has the same probability
of being selected,
◼ The selection of one member is independent of the
selection of any other member.
Here, n is called the sample size.
5
6.
Example
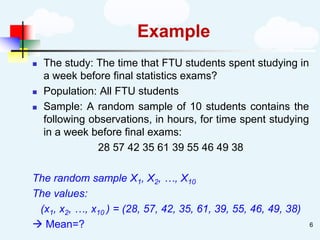
◼ The study:The time that FTU students spent studying in
a week before final statistics exams?
◼ Population: All FTU students
◼ Sample: A random sample of 10 students contains the
following observations, in hours, for time spent studying
in a week before final exams:
28 57 42 35 61 39 55 46 49 38
The random sample X1, X2, …, X10
The values:
(x1, x2, …, x10 ) = (28, 57, 42, 35, 61, 39, 55, 46, 49, 38)
→ Mean=? 6
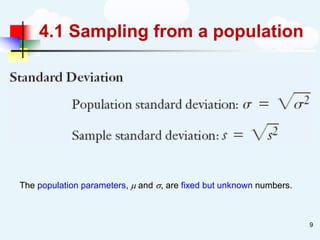
4.1 Sampling froma population
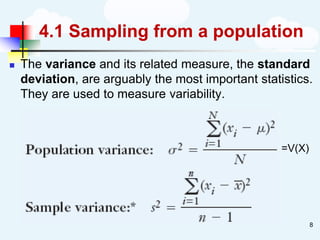
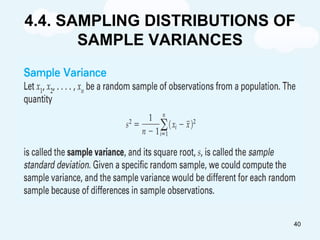
◼ The variance and its related measure, the standard
deviation, are arguably the most important statistics.
They are used to measure variability.
=V(X)
8
9.
4.1 Sampling froma population
9
The population parameters, and , are fixed but unknown numbers.
10.
10
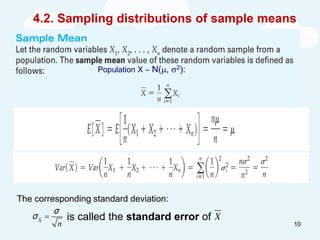
4.2. Sampling distributionsof sample means
The corresponding standard deviation:
is called the standard error of
X
n
σ
σ = X
Population X N(, 2):
11.
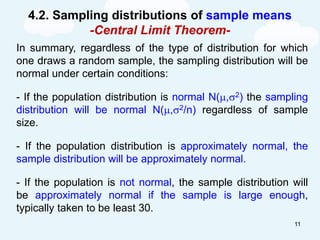
4.2. Sampling distributionsof sample means
-Central Limit Theorem-
In summary, regardless of the type of distribution for which
one draws a random sample, the sampling distribution will be
normal under certain conditions:
- If the population distribution is normal N(,2) the sampling
distribution will be normal N(,2/n) regardless of sample
size.
- If the population distribution is approximately normal, the
sample distribution will be approximately normal.
- If the population is not normal, the sample distribution will
be approximately normal if the sample is large enough,
typically taken to be least 30.
11
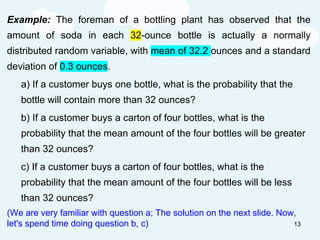
Example: The foremanof a bottling plant has observed that the
amount of soda in each 32-ounce bottle is actually a normally
distributed random variable, with mean of 32.2 ounces and a standard
deviation of 0.3 ounces.
a) If a customer buys one bottle, what is the probability that the
bottle will contain more than 32 ounces?
b) If a customer buys a carton of four bottles, what is the
probability that the mean amount of the four bottles will be greater
than 32 ounces?
c) If a customer buys a carton of four bottles, what is the
probability that the mean amount of the four bottles will be less
than 32 ounces?
(We are very familiar with question a; The solution on the next slide. Now,
let's spend time doing question b, c) 13
14.
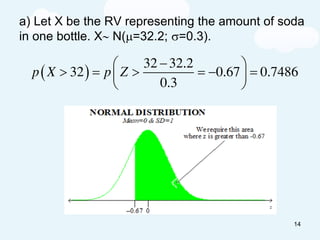
a) Let Xbe the RV representing the amount of soda
in one bottle. X N(=32.2; =0.3).
14
( )
−
= = − =
32 32.2
32 0.67 0.7486
0.3
p X p Z
Example
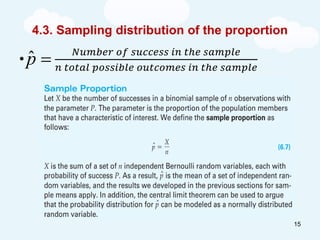
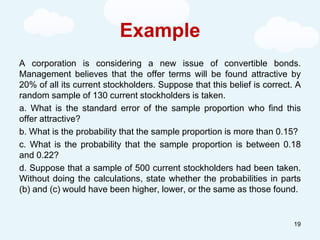
A corporation isconsidering a new issue of convertible bonds.
Management believes that the offer terms will be found attractive by
20% of all its current stockholders. Suppose that this belief is correct. A
random sample of 130 current stockholders is taken.
a. What is the standard error of the sample proportion who find this
offer attractive?
b. What is the probability that the sample proportion is more than 0.15?
c. What is the probability that the sample proportion is between 0.18
and 0.22?
d. Suppose that a sample of 500 current stockholders had been taken.
Without doing the calculations, state whether the probabilities in parts
(b) and (c) would have been higher, lower, or the same as those found.
19
Exercise 1. Anormal population has a mean of 60 and a
standard deviation of 12. You select a random sample of 9.
Compute the probability the sample mean is:
• a. Greater than 63.
• b. Less than 56.
• c. Between 56 and 63.
21
22.
Exercise 2. Apopulation of unknown shape has a mean of
75. You select a sample of 40. The standard deviation of the
sample is 5. Compute the probability the sample mean is:
a. Less than 74.
b. Between 74 and 76.
c. Between 76 and 77.
d. Greater than 77.
22
23.
Exercise 3. Ina certain section of Southern California, the
distribution of monthly rent for a one-bedroom apartment has
a mean of $2,200 and a standard deviation of $250. The
distribution of the monthly rent does not follow the normal
distribution. In fact, it is positively skewed. What is the
probability of selecting a sample of 50 one-bedroom
apartments and finding the mean to be at least $1,950 per
month
23
24.
Exercise 4. Accordingto an IRS study, it takes an average of 330
minutes for taxpayers to prepare, copy, and electronically file a 1040 tax
form and finds the standard deviation of the time to prepare, copy, and
electronically file form 1040 is 80 minutes. A consumer watchdog agency
selects a random sample of 40 taxpayers.
a. What assumption or assumptions do you need to make about the
shape of the population?
b. What is the standard error of the mean?
c. What is the likelihood the sample mean is greater than 320 minutes?
d. What is the likelihood the sample mean is between 320 and 350
minutes?
e. What is the likelihood the sample mean is greater than 350 minutes?
24
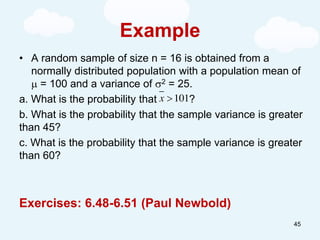
Example
• A randomsample of size n = 16 is obtained from a
normally distributed population with a population mean of
= 100 and a variance of 2 = 25.
a. What is the probability that ?
b. What is the probability that the sample variance is greater
than 45?
c. What is the probability that the sample variance is greater
than 60?
Exercises: 6.48-6.51 (Paul Newbold)
101
x
45