Download to read offline

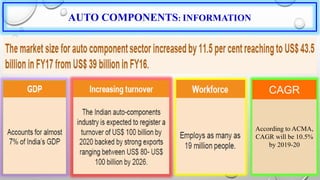
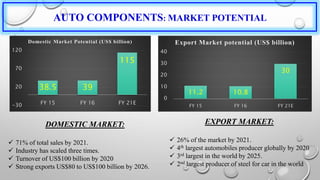
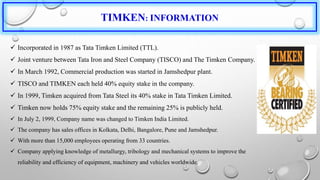
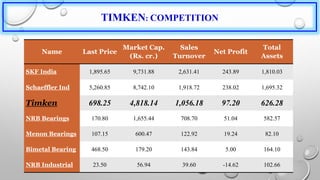
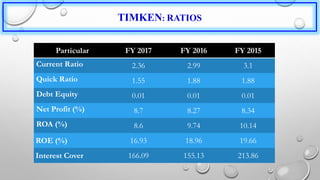
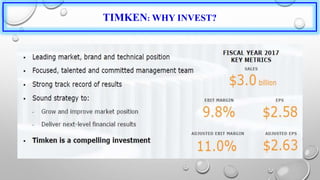


The document discusses the auto components market in India. It states that the domestic auto components market is expected to reach $115 billion by 2021, growing at a CAGR of 10.5%. Exports are also expected to increase significantly, reaching $80-100 billion by 2026. Several major auto component companies like Schaeffler India and UNO Minda are investing heavily in India. The document also provides an overview of Timken India, an auto bearing manufacturer, discussing its history, global operations, competition, financial ratios, and reasons for investing in the company.


