Download to read offline


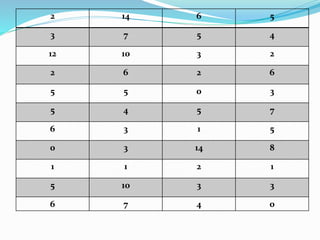
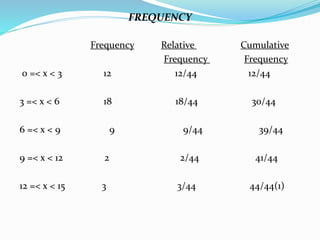
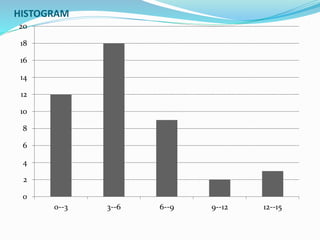

The document appears to contain data on test or survey results including frequency counts of values within certain ranges. A frequency table shows the counts of values ranging from 0 to 15, with the most values falling between 3-6. A histogram and Pareto chart further visualize the frequency distribution, with the largest group of values between 3-6.


