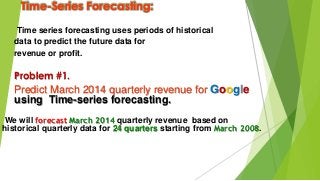
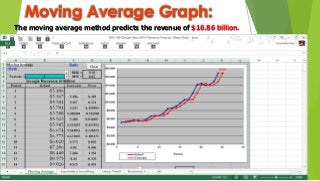
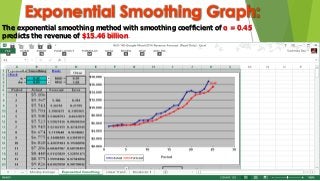
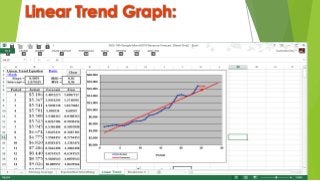
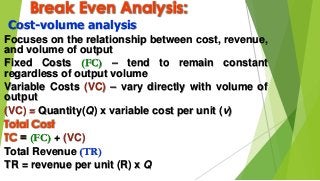
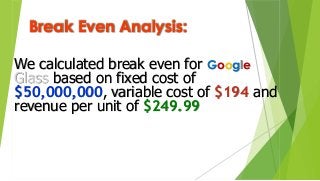
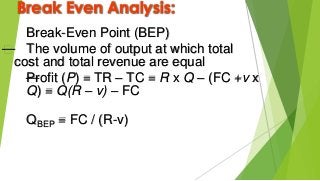
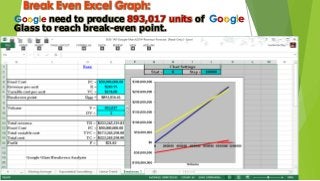
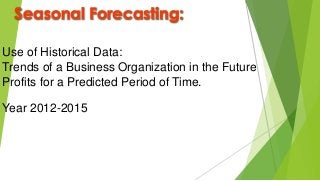
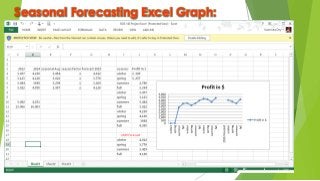
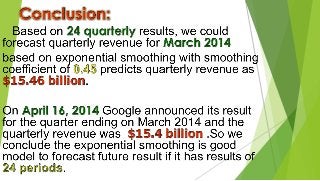
Time Series for
Google Inc.
and Analysis for Google Glass.
Introduction
Google Inc.
Google is a global technology leader
focused on improving the ways people connect
with information. Google build products and
provide services that improve the lives of
billions of people globally.
Introduction
Google Inc.
Google’s primary sources of revenues are to
deliver relevant, cost-effective online
advertising.
Businesses use google AdWords program and
AdSense program to promote their products
and services with advertising on both Google
owned properties and publishers' sites across
the web.
Time-Series Forecasting:
Time series forecasting uses periods of historical
data to predict the future data for
revenue or profit.
Problem #1.
Predict March 2014 quarterly revenue for Google
using Time-series forecasting.
We will forecast March 2014 quarterly revenue based on
historical quarterly data for 24 quarters starting from March 2008.
Moving Average Method:
 —Technique that averages a number of the most
recent actual values in generating a forecast.
Moving Average Graph:
The moving average method predicts the revenue of $16.86 billion.
Exponential Smoothing Method:
Exponential smoothing technique
is used in time series data to
make sophisticated forecasts.
Exponential Smoothing Graph:
The exponential smoothing method with smoothing coefficient of α = 0.45
predicts the revenue of $15.46 billion.
Linear Trend Graph:
Break Even Analysis:
Cost-volume analysis
Focuses on the relationship between cost, revenue,
and volume of output
Fixed Costs (FC) – tend to remain constant
regardless of output volume
Variable Costs (VC) – vary directly with volume of
output
(VC) = Quantity(Q) x variable cost per unit (v)
Total Cost
TC = (FC) + (VC)
Total Revenue (TR)
TR = revenue per unit (R) x Q
Break Even Analysis:
We calculated break even for Google
Glass based on fixed cost of
$50,000,000, variable cost of $194 and
revenue per unit of $249.99
Break Even Analysis:
Break-Even Point (BEP)
— The volume of output at which total
cost and total revenue are equal
—Profit (P) = TR – TC = R x Q – (FC +v x
Q) = Q(R – v) – FC
QBEP = FC / (R-v)
Break Even Excel Graph:
Google need to produce 893,017 units of Google
Glass to reach break-even point.
Seasonal Forecasting:
Use of Historical Data:
Trends of a Business Organization in the Future
Profits for a Predicted Period of Time.
Year 2012-2015
Seasonal Forecasting:
Problem:
Profit of Google Inc. in next one year
Solution:
Seasonal Forecasting
Examines the market at a wider perspective
Crucial in creating:
Market Plans
Budget
Cash Flow
Seasonal Forecasting Excel Graph:
Time Series Forecasting for Google Inc. and Break-even analysis for Google glass.

Time Series Forecasting for Google Inc. and Break-even analysis for Google glass.

  • 1.
    Time Series for GoogleInc. and Analysis for Google Glass.
  • 2.
    Introduction Google Inc. Google isa global technology leader focused on improving the ways people connect with information. Google build products and provide services that improve the lives of billions of people globally.
  • 3.
    Introduction Google Inc. Google’s primarysources of revenues are to deliver relevant, cost-effective online advertising. Businesses use google AdWords program and AdSense program to promote their products and services with advertising on both Google owned properties and publishers' sites across the web.
  • 4.
    Time-Series Forecasting: Time seriesforecasting uses periods of historical data to predict the future data for revenue or profit. Problem #1. Predict March 2014 quarterly revenue for Google using Time-series forecasting. We will forecast March 2014 quarterly revenue based on historical quarterly data for 24 quarters starting from March 2008.
  • 5.
    Moving Average Method: —Technique that averages a number of the most recent actual values in generating a forecast.
  • 6.
    Moving Average Graph: Themoving average method predicts the revenue of $16.86 billion.
  • 7.
    Exponential Smoothing Method: Exponentialsmoothing technique is used in time series data to make sophisticated forecasts.
  • 8.
    Exponential Smoothing Graph: Theexponential smoothing method with smoothing coefficient of α = 0.45 predicts the revenue of $15.46 billion.
  • 9.
  • 10.
    Break Even Analysis: Cost-volumeanalysis Focuses on the relationship between cost, revenue, and volume of output Fixed Costs (FC) – tend to remain constant regardless of output volume Variable Costs (VC) – vary directly with volume of output (VC) = Quantity(Q) x variable cost per unit (v) Total Cost TC = (FC) + (VC) Total Revenue (TR) TR = revenue per unit (R) x Q
  • 11.
    Break Even Analysis: Wecalculated break even for Google Glass based on fixed cost of $50,000,000, variable cost of $194 and revenue per unit of $249.99
  • 12.
    Break Even Analysis: Break-EvenPoint (BEP) — The volume of output at which total cost and total revenue are equal —Profit (P) = TR – TC = R x Q – (FC +v x Q) = Q(R – v) – FC QBEP = FC / (R-v)
  • 13.
    Break Even ExcelGraph: Google need to produce 893,017 units of Google Glass to reach break-even point.
  • 14.
    Seasonal Forecasting: Use ofHistorical Data: Trends of a Business Organization in the Future Profits for a Predicted Period of Time. Year 2012-2015
  • 15.
    Seasonal Forecasting: Problem: Profit ofGoogle Inc. in next one year Solution: Seasonal Forecasting Examines the market at a wider perspective Crucial in creating: Market Plans Budget Cash Flow
  • 16.