
Recommended
More Related Content
What's hot
Viewers also liked
Similar to Thoughts on the Oil price OCT 16
Similar to Thoughts on the Oil price OCT 16 (20)
Thoughts on the Oil price OCT 16
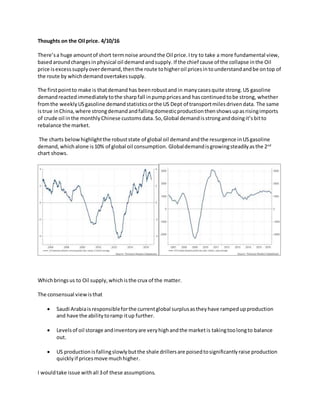
- 1. Thoughts on the Oil price. 4/10/16 There’sa huge amountof short termnoise aroundthe Oil price.Itry to take a more fundamental view, basedaroundchangesin physical oil demandandsupply. If the chief cause of the collapse inthe Oil price isexcesssupplyoverdemand,thenthe route tohigheroil pricesintounderstandandbe ontop of the route by whichdemandovertakessupply. The firstpointto make is thatdemand has beenrobustand in manycasesquite strong.US gasoline demandreactedimmediatelytothe sharpfall inpumppricesand hascontinuedtobe strong, whether fromthe weeklyUSgasoline demandstatisticsorthe US Dept of transportmilesdrivendata. The same istrue inChina,where strongdemandandfallingdomesticproductionthenshowsupasrisingimports of crude oil inthe monthlyChinese customsdata.So,Global demandisstronganddoingit’sbitto rebalance the market. The charts belowhighlightthe robuststate of global oil demandandthe resurgence inUSgasoline demand,whichalone is10% of global oil consumption. Globaldemandisgrowingsteadilyasthe 2nd chart shows. Whichbringsus to Oil supply,whichisthe crux of the matter. The consensual viewisthat Saudi Arabiaisresponsibleforthe currentglobal surplusastheyhave rampedupproduction and have the abilitytoramp itup further. Levelsof oil storage andinventoryare veryhighandthe marketis takingtoolongto balance out. US productionisfallingslowlybutthe shale drillersare poisedtosignificantlyraise production quicklyif pricesmove muchhigher. I wouldtake issue withall 3of these assumptions.
- 2. Yes,Saudi didraise production,eventually.ButIraqisalsothe keydriverbehindthe increaseinOpec output.Saudi oil demandisalsorisingrapidlyandalthoughthe dataishard to getholdof,it lookslike the levelsof Saudi exportshave barelychangedinrecentyears. Iranisalmostbackto its shortterm productioncapacityandUS banksremainveryreluctanttofinance anygenuine reconstructionof the Iranianoil infrastructure.There couldwell be little ornospare capacitywithinOPEC,apart fromLibya. Thisis the viewof the CEO of Core Labs,a highendUS oil Service Companywhichspecializesinreservoir enhancementtechniques. Oil inventoriesare highinthe USA and the marketseemsobsessedwiththe weeklyUSinventorydata.I tendto ignore themasreactingto a badlyconstructedestimate of aweeklynumber,giventhatthe global oil marketremainsoversuppliedistomymindirrelevant.Oil storage levelsoutside the USare no wayas nearlyelevated. Whichbringsus neatlyontoUS supply. Since the shale revolutiongotusintoa positionof global oversupply,thentheyalsohave tobe part of the solution. The EIA produce monthlyUS crude oil productiondata. Sept30st saw the July data publishedandJuly was -747,000 bbl/day downon a yearago. So,as the top 2 charts show,US CRUDE OIL productionisfallingfast. Thisdata is forCRUDE OIL, andexcludesNatural GasLiquids(NGL),mostof whichisoil andoil products that comesoff wetgas production. SowhilstUSCRUDE OIL productionissub9m bbl/day(the figure the mediausuallyquotes),total USoil production(incNGL) ismuch higher. “production”iscrude oil but “supply”includesanumberof otherproductcategories. THIS IS KEY TO UNDERSTANDING WHAT’SREALLY HAPPENING IN TERMS OF THE SUPPLY“GLUT”.
- 3. The EIA publishworld crude oil production.Thisisamonthbehindthe US,so we have data up to JUNE 2016. Worldcrude Oil production rose slightlyInJUNEoverMAY as Saudi rampedupproductionto meettheirdomesticsummerpeakdemand,IrancontinuedtobuildproductionandCanadabounced back fromthe impactof the wildfiresinAlberta. Butevenso, WorldCrude Oil productionis still falling year on year. So, ifdemand is growing by around 1.1m bbl/day and crude oil productionis fallingby -700,000 bbl/day, why the renewedfearsofa glut lastingwell into 2017? The answerliesinthe continuedgrowthinNGLoil supply,whichismaskingthe sharpfallsin Crude Oil production. The world Crude Oil Production data seemsatoddswiththe official EIA global supply dataandforecast for WorldOil supply. It’sthissupply numberthatthe marketfocusesonand the forecastsforWorldOil supply thatdrivesthe viewthatthe marketbalancessometimenextsummer,2017, if not later.
- 4. The Global Oil Supplyof 97m bbl/daytiesinwiththe EIA data onTOTAL OIL SUPPLY, which includes NGL, refinerygains,nearoil productsetc The oftenquotedUS oil productionof sub9m bbl/dayispart of the EIA data on WORLD OIL PRODUCTION,justthe blackstuff and around79m bbl/dayglobally. The gap is around18m bbl/dayspreadacrossthe globe.That’sa prettybignumber….. 6.1m bbl/dayin USA, 4.5m in OPEC,1m CANADA The chart belowshowsthe yearonyearchangesin these definitions,withCRUDEOIL fallingby -700/- , TOTAL OIL SUPPLY up +300/- andall due toa stunningyearonyear +1.0m bbl/dayincrease inthis“near oil”category. So we have thishighlyseasonal but very recentlyrapidlygrowing “near oil” maskingthe decline in global crude oil production. PRODUCTION GROWTH IN GLOBAL CRUDE OIL,NGL & TOTAL OIL SUPPLY In the USA the picture isthe same – rapidlyfallingCRUDEOIL productionbeingmaskedby the growthin NGL.
- 5. If it was justdownto Crude Oil Productionandif NGL’shad grownin line withCrude Oil,we would probablybe in-balance bynow. Thisrapid growthinNGL has gone underthe radar somewhat. ItislinkedtoGasproductionlevels,but the importantpointto make isthat WORLD CRUDE OIL PRODUCTIONis falling year onyear,even before the recentOPECagreement. If we have resilientdemandgrowthaddingtoglobal demandeachandeverymonth.If global crude oil productionisnowdownyearon year (whichmayexplainwhyUScrude oil inventoryhasstartedtofall), thenunlessNGL’scontinue torise yearonyear (andtheyfell backbothinUSA and the World onthe latestdata),the marketisalready startingto balance itself out. So howquicklyare thingsmoving? Thishorriblycomplicatedcharttriestoshow lookingatthe annual change in demandoversupplyto gauge justhow quicklythe glutisdisappearing.
- 6. Here I’m usingthe latestmonthly‘flash’numbersforglobal crude oil production. (BLUELINE) andthe latestestimate forGlobal Oil supply(incNGL) The current 1m bbl/daygrowthinNGL explainsthe gapbetweenthe 2lines. DAILY RATE AT WHICH DEMAND GROWTH EXCEEDS SUPPLY GROWTH So the questiontoaskthe Oil analystsiswhatisdrivingthe rapidcurrentgrowthin NGL and whatdo we assume forthisrate of growth goingforward? Because withoutthe NGLgrowthwe’dbe veryquicklyheadingintodeficitintermsof the global oil demand/supplybalance giventhatcrude oil productionisalreadyfallingyearonyear. BM 4/10/16