This document summarizes a study that examined the effects of adapting homework instructions to match the characteristics of Dutch HAVO 4 students. The study found:
1) Adapting homework instructions to fit students' characteristics significantly increased students' homework motivation, primarily by increasing their expectancy of success.
2) Effects varied by subject, with mathematics and economics students reporting significantly higher motivation, while history and chemistry students showed no significant changes.
3) Pre-existing differences in students' planning skills and relationships with teachers significantly impacted their homework expectancy levels. Students with below-average scores on these characteristics had lower expectancy.
The results suggest adapting homework instructions based on student characteristics can increase motivation and that teachers should differentiate instructions

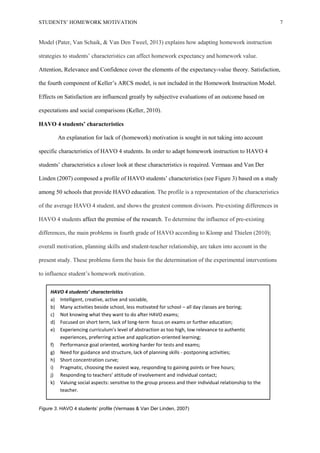
![STUDENTS’ HOMEWORK MOTIVATION 16
Results
Manipulation check
The switching replications design implicates that caution should be exercised regarding the
occurrence of an order effect. An independent samples t test was used to compare the differences on
the measurement score of participants (n = 40) receiving the experimental intervention in week 1 (M
= 0.11, SD = 0.55) and participants (n = 41) receiving the experimental intervention in week 2 (M =
0.31, SD = 0.77). The t test was non-significant, t(71.98) = 1.37, p = .174, two-tailed, d = 0.45, 95%
CI [-0.92, 0.50]. Absence of an order effect implicated that scores on students’ questionnaires on
measurement 1 and 2 can be combined and partitioned in test scores on traditional homework (or
control group) and test scores on experimental homework.
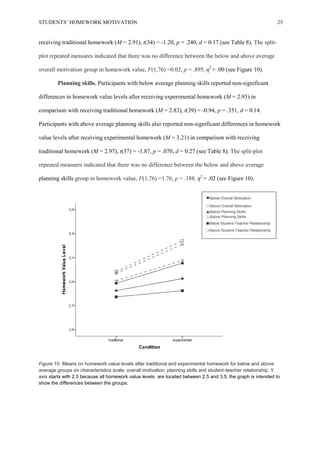
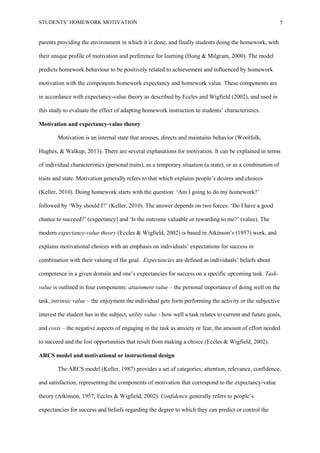
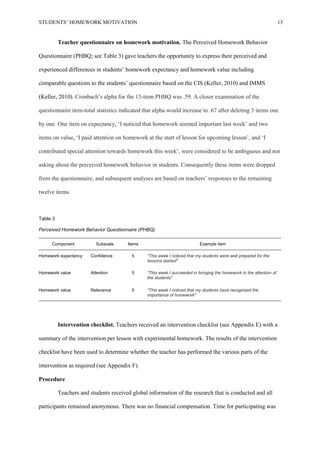
Homework motivation
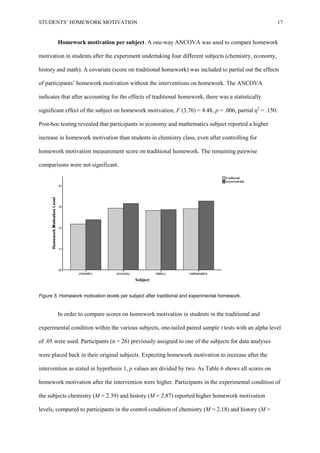
A one-way repeated measures ANOVA was used to investigate the impact of the
experimental intervention. The repeated measures ANOVA indicates there is a significant increase on
homework motivation levels after the experimental intervention (M = 2.91, SD = 0.78) in comparison
with traditional homework (M = 2.71, SD = 0.74), F (1, 80) = 7.71, p = .007, partial η2
= .09.
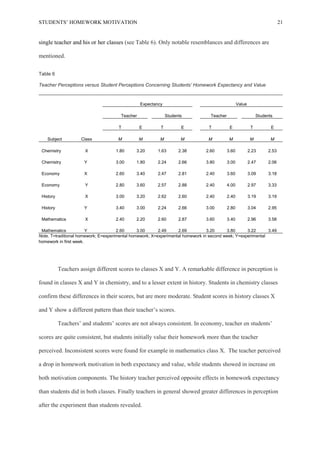
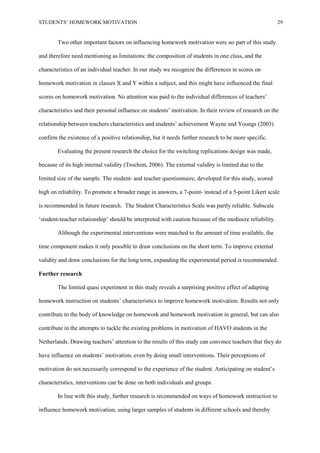
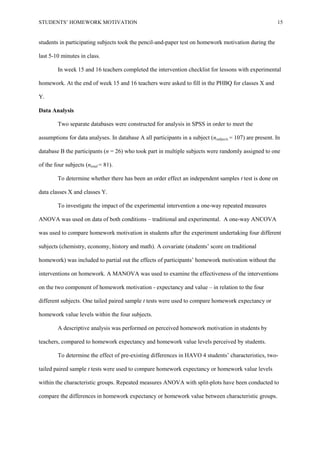
Table 5
Summary of scores on measurements on HEVS in different subjects
Homework Motivation Homework Expectancy Homework Value
Traditional Experimental Traditional Experimental Traditional Experimental
Subject n M SD M SD M SD M SD M SD M SD
Chemistry 15 2.18 0.59 2.39 0.88 1.76 0.47 2.19 0.84 2.39 0.72 2.49 0.91
Economy 36 2.94 0.62 3.16 0.61 2.59 0.77 2.90 0.83 3.10 0.60 3.29 0.57
History 30 2.82 0.70 2.87 0.61 2.45 0.85 2.57 0.76 3.01 0.70 3.02 0.59
Math 26 2.92 0.76 3.27 0.60 2.65 0.80 2.87 0.68 3.05 0.77 3.48 0.64
Totala
81 2.71 0.74 2.91 0.78 2.32 0.80 2.61 0.82 2.90 0.77 3.06 0.82
Note. a
Ntotal = 81; chemistry (n = 14); economy (n=28); history (n = 19); mathematics (n = 18); 26 students participate in multiple
subjects.](https://image.slidesharecdn.com/77711770-e8f1-44c4-af52-3ca82d3bce8d-161031111328/85/Thesis-Students-Homework-Motivation-16-320.jpg)