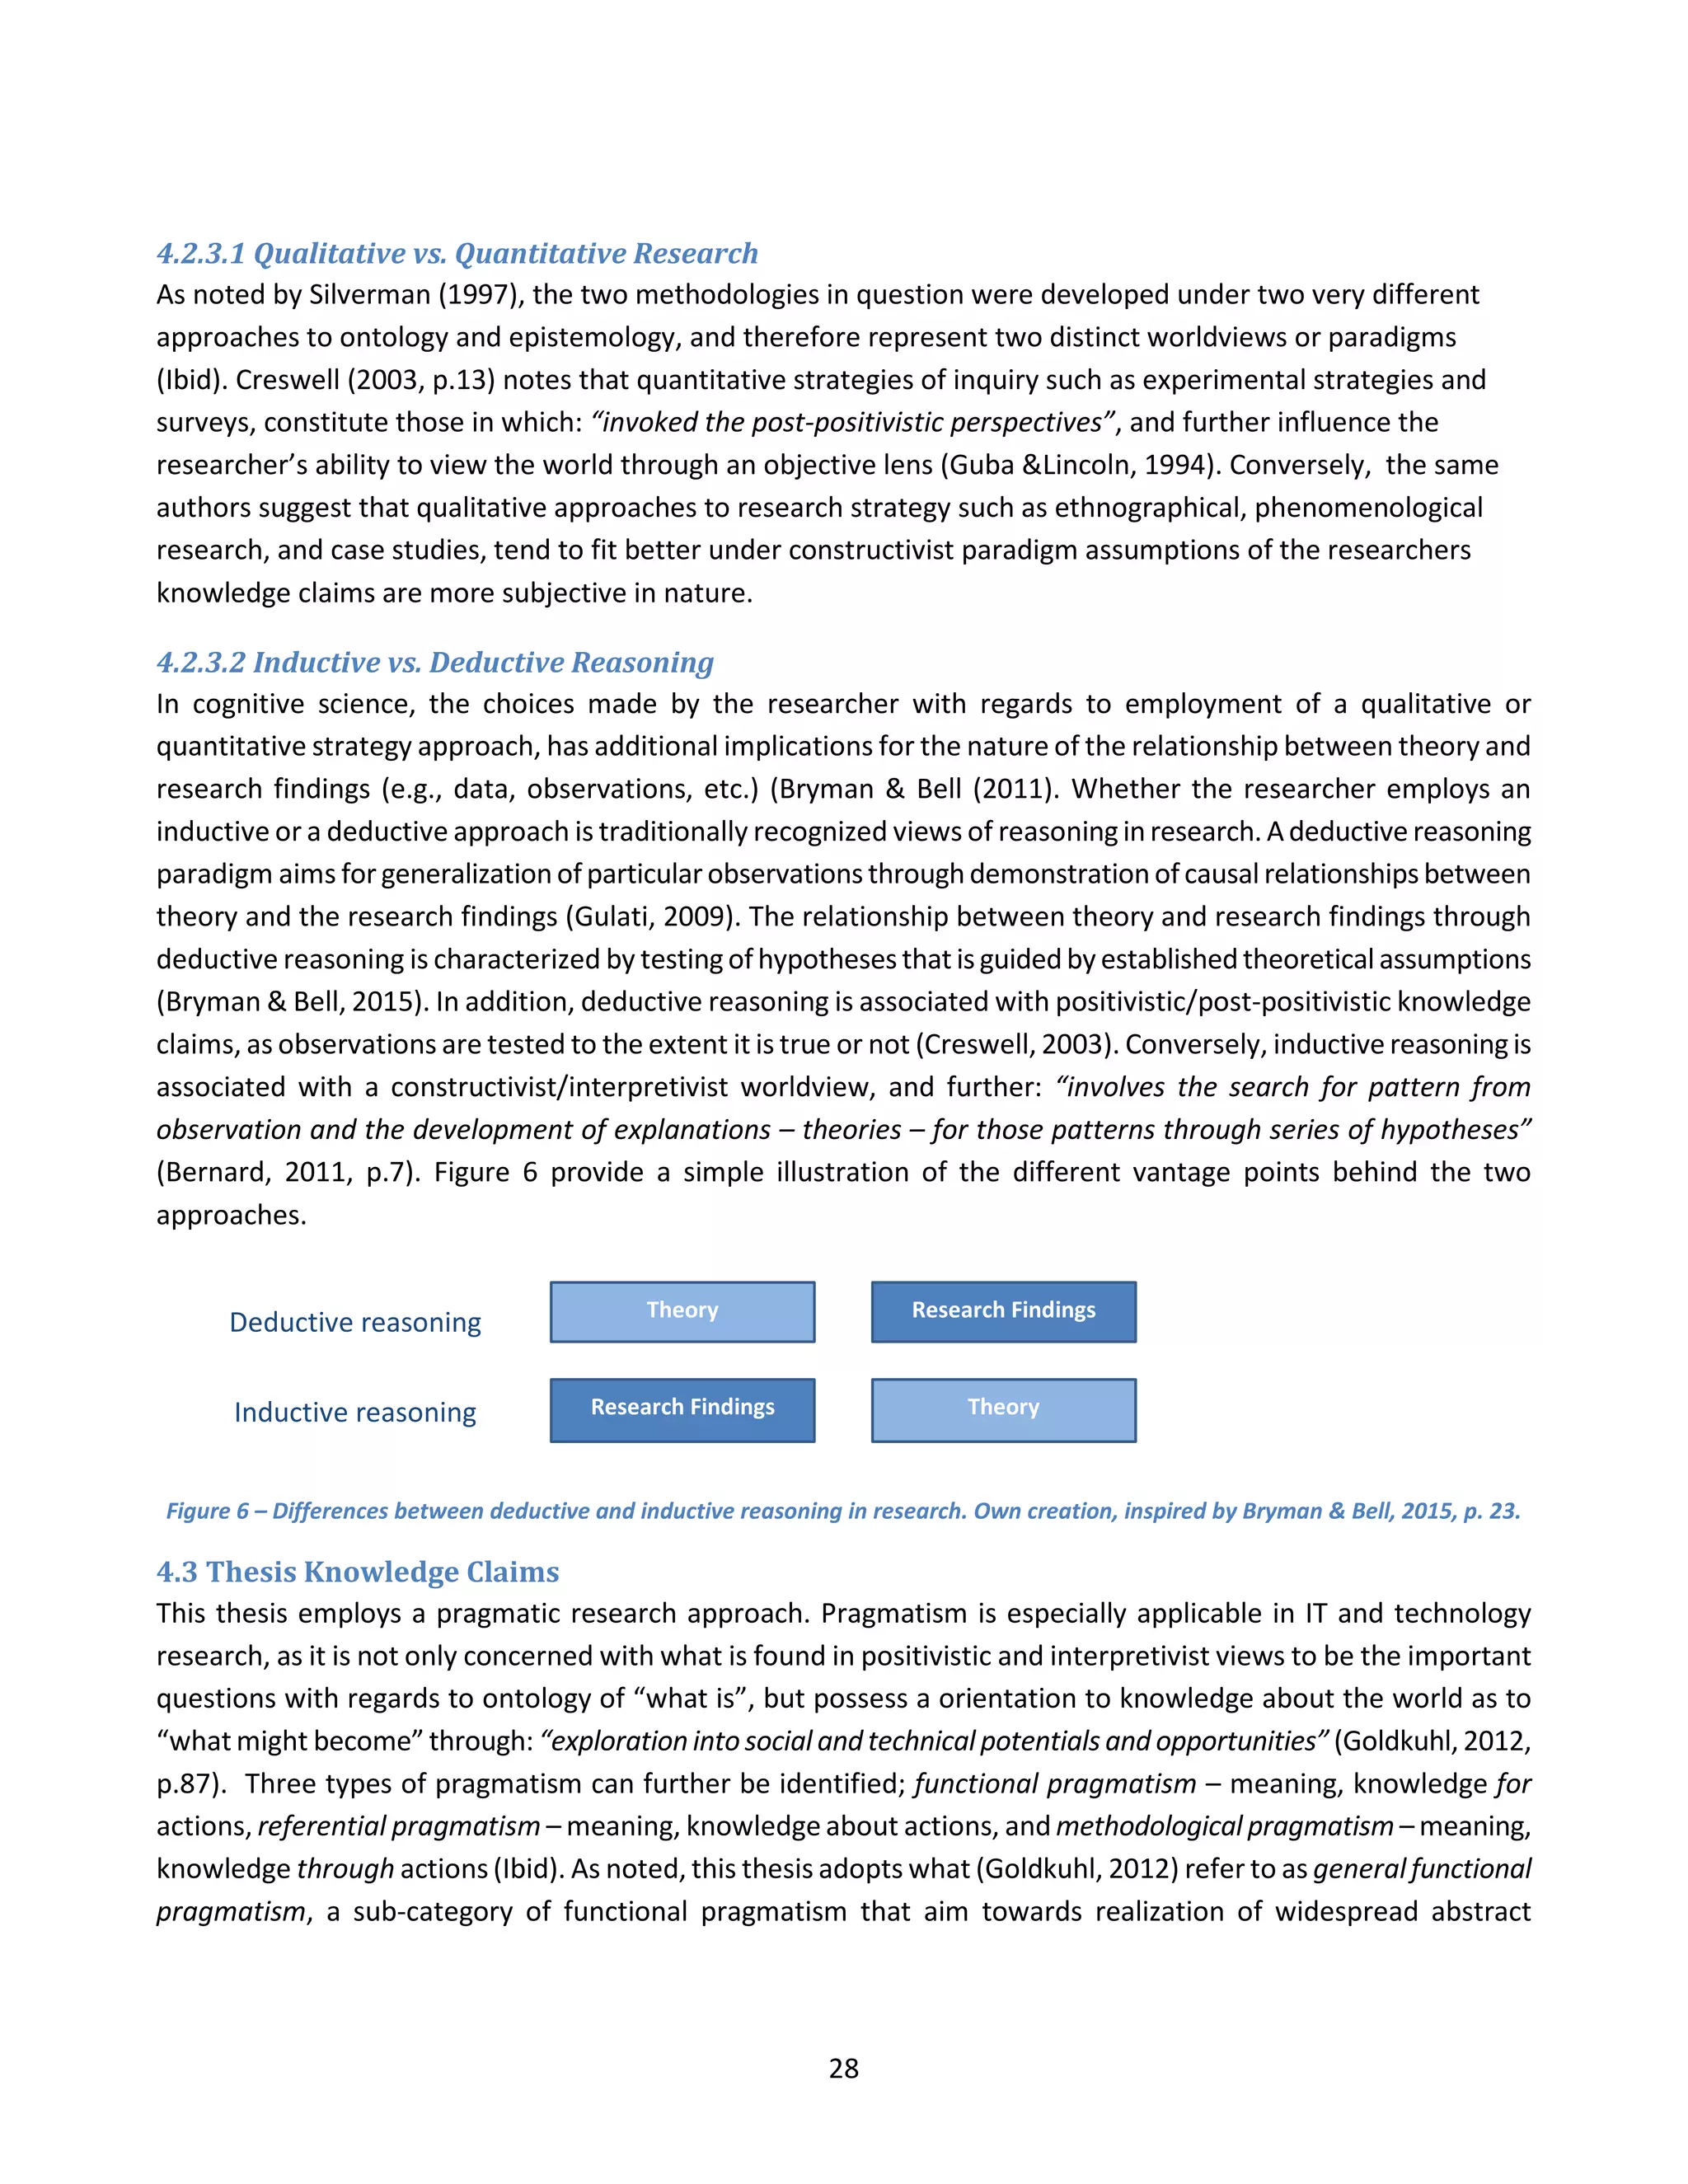
SlideShare a Scribd company logo
Abstract
Background: The industrial introduction of additive manufacturing technologies (AMT) in direct processing
activities of finished goods have by many been called a hype as its longstanding area of purpose have been limited
to prototyping activities innew product development. However, muchindicate that the performance capabilities of
AMT has reached a certain point in its technological maturity, in which may allow for strategic capitalization of
manufacturing organizations as a viable adoption-alternative.
Purpose: This thesis provides a preliminary adoptiondecisiontool for managers exploringthe potential of industrial
additive manufacturing (AM). Through explanation of contemporary performance capabilities of various AMT
processes, it aims to pinpoint the contemporary areas of application and future direction of strategic purpose by
reconciling these findings with theoretical concepts.
Methodology: As the novelty and potential disruptive force of the process technology not necessarily provideda fit
with pure positivist and/or interpretivist research paradigms, a pragmatic, mixed methods approach was chosen.
Hence, abductive reasoning, allowing the researcher to “fill in the blanks” with observations from the empirical
reality and match these with concepts from theory, was chosen.
Results: Based on a comparative performance capability analysis utilizingfive generic performance objectives, and
an analysis of AMT systems manufacturing, and business strategic boundaries, this thesis suggests contemporary
viability of AM in high flexibility oriented manufacturing environments where requirements for low-medium
volumes of production, and highly complex and customized parts are prevalent conditions.
Moreover, the thesis propose that contemporary viability of AM is closely linkedwithtechnology maturity, and the
results point to a proposition that when AM is proven ready for mass-adoption, established theorems within
manufacturing and supply chain operations must be taken under advisement for reconsiderations.
Conclusions: In line with predicted advances in technology maturity, the thesis further propose a development
trend of system typology from intermittent systems to concurrent systems. This shift suggests anexpansionof the
purpose boundaries for strategic areas of application. It is further suggestedthat these advances holdthe potential
to support a new, more sustainable manufacturing operations and supply chain paradigm without compromising
the ability to achieve cost efficiency.
1
Acknowledgements
This section is dedicated to those who have helped and inspired me to finish this milestone achievement of my
academic journey. Without you, I could not have made it.
First, I would like to offer my eternal gratitude to Juliana Hsuan, my supervisor, mentor, andfriendthroughout this
journey. Without your brilliant expertise and motivating encouragement the journey would not have been as
rewarding as it has. Thank you, Juliana.
Second, I would like to thank my family for their support and belief in my ability to thrive on this journey by myself.
Special thanks to my Mom, Dad, Tore, Grandmother Martha, and Grandfather Kåre for all your love and support.
Third, I would like to thank my friends and classmates for your guidance, encouragement and insight in situations
where a third eye was needed to move forward. You all know who you are, thank you. Special thanks to Jørgen,
who helped be with the formalities before handing in.
Last, but not least I would like to offer a special thanks to my girlfriend Lotte. Your patience, encouragement,
overwhelming kindness and belief in me has guided me through this process. Thank you, Lotte.
Abbreviations
Terms
Abbreviation Explanation
3DP Three-dimensional printing
AM Additive Manufacturing
AMT Additive Manufacturing Technologies
BB Research Building Block(s)
CAD Computer-aided Design
CAGR Compound Annual Growth
CAM Computer-aided Manufacturing
CNC Computerized-Numerically Controlled Machine Automation
ERP Enterprise Resource Planning
IPR Intellectual Property Rights
MO Manufacturing Organization(s)
NPD New Product Development
PO Performance Objective(s)
PT Process Technology(ies)
R&D Research & Development
RBV Resource-based View
RFID Radio Frequency Identification
S&OP Sales & Operations Planning
SC Supply Chain(s)
SCM Supply Chain Management
SL Stereolithography
TM Traditional Manufacturing
TMT Traditional Manufacturing Technologies
2
Table of Contents
ABSTRACT..........................................................................................................................................................................1
ACKNOWLEDGEMENTS......................................................................................................................................................2
ABBREVIATIONS ................................................................................................................................................................2
TABLE OF CONTENTS .........................................................................................................................................................3
TABLE OF FIGURES.............................................................................................................................................................6
1.0 INTRODUCTION ...........................................................................................................................................................8
1.1 BACKGROUND......................................................................................................................................................................8
1.1.2 Introduction to 3D Printing & Additive Manufacturing............................................................................................8
1.2 PROBLEM DISCUSSION...........................................................................................................................................................9
1.2.1 Developments in Macro-trends................................................................................................................................9
1.2.2 Challenges in the Current Manufacturing Operations & Supply Chain Paradigm………………………………………........10
1.3 THESIS PURPOSE ................................................................................................................................................................11
1.4 RESEARCH GAP & THESIS STRUCTURE.....................................................................................................................................12
1.5 DELIMITATIONS..................................................................................................................................................................12
2.0 RESEARCH FRAMEWORK............................................................................................................................................13
2.1 CONCEPTUAL RESEARCH FRAMEWORK....................................................................................................................................13
2.1.1 Block 1: Market Outlook & Technology Readiness.................................................................................................13
2.1.2 Building Block 2: Technology Features & Performance Capabilities ......................................................................14
2.1.3 Building Block 3: AM Strategic Purpose & Paradigmatic Appropriateness............................................................14
2.1.4 Building Block 4 Discussion: Operations & Supply Chain Performance..................................................................14
2.2 CHOICE OF THEORY.............................................................................................................................................................14
3.0 LITERATURE REVIEW..................................................................................................................................................15
3.1 GENERAL BUSINESS STRATEGY VS. OPERATIONS STRATEGY .........................................................................................................15
3.2 MANUFACTURING STRATEGY ................................................................................................................................................16
3.2.1 Scope and Definitions.............................................................................................................................................16
3.2.2 The Strategic Choice Paradigm ..............................................................................................................................16
3.3 MANUFACTURING STRATEGY TYPOLOGIES...............................................................................................................................18
3.3.1 Typologies of Generic Business Strategy & Manufacturing Strategy.....................................................................18
3.3.2 The Relationship between Generic Business Strategy &Manufacturing Strategy..................................................19
3.3.3 Primary Dimensions & Underlying Variables of Manufacturing Strategy..............................................................20
3.4 ACCOMMODATING TYPOLOGIES FOR PROCESS-TECHNOLOGY STRATEGY IN MANUFACTURING...........................................................22
3.4.1 Technical Complexity & Technical Flexibility..........................................................................................................22
3.5 MANUFACTURING & OPERATIONS PERFORMANCE....................................................................................................................23
3.5.1 Generic Performance Objectives............................................................................................................................23
3
4.0 METHODOLOGY.........................................................................................................................................................26
4.1 THE NATURE OF BUSINESS RESEARCH.....................................................................................................................................26
4.2 PHILOSOPHICAL PARADIGMS & CONSTITUENTS OF SCIENTIFIC RESEARCH ......................................................................................26
4.2.1 Philosophical Paradigms in Research.....................................................................................................................26
4.2.2 Knowledge claims...................................................................................................................................................27
4.2.3 Research Strategies................................................................................................................................................27
4.3 Thesis Knowledge Claims ..........................................................................................................................................28
4.4 THE DYNAMIC RESEARCH PROCESS ........................................................................................................................................30
4.4.1 Conceptual Framework ..........................................................................................................................................31
4.4.2 Conceptual Literature – Theoretical Frame of Reference vs. the Empirical World – Evidence from Reality ..........31
4.4.3 Matching................................................................................................................................................................31
4.5 RESEARCH APPROACHES & RELATED RESEARCH STRATEGIES .......................................................................................................32
4.5.1. Building-block 1 – Market Outlook & Technology Readiness................................................................................32
4.5.2 Building-block 2 – Technology Performance Capabilities.......................................................................................32
4.5.3 Building-block 3 – Strategic Focus & Paradigmatic Appropriateness ....................................................................32
4.5.4 Building-block 4 – Strategic and Performance Implications for Operations & Supply Chains................................32
4.6 DATA SOURCES & DATA COLLECTION STRATEGY.......................................................................................................................33
4.6.1 Data Sources – Primary vs. Secondary Data ..........................................................................................................33
4.6.2 Data Collection Strategy ........................................................................................................................................33
4.7 OPERATIONALIZATION TABLES & METHODS OF ANALYSIS...........................................................................................................35
4.7.1 Building Block 2 –Process Technology Performance & Operational Capabilities...................................................35
4.8 Building Block 3 –Process Technological Manufacturing and Business Strategic Mapping......................................37
4.8.1 Building Block 4 – Operations & Supply Chain Strategy and Performance Discussion...........................................38
4.9 RESEARCH LIMITATIONS.......................................................................................................................................................38
4.10 PRESENTATION OF DATA & FINDINGS...................................................................................................................................38
5.0 PRESENTATION OF DATA & FINDINGS........................................................................................................................39
5.1 BUILDING-BLOCK 1: TECHNOLOGY & MARKET OVERVIEW..........................................................................................................39
5.2 3DP/AM PROCESS TECHNOLOGY OVERVIEW ..........................................................................................................................39
5.2.1 The Nature of Additive Manufacturing ..................................................................................................................39
5.2.2 3DP/AM Technology Definitions ............................................................................................................................39
5.2.3 Different Purposes of ALM Process Technologies ..................................................................................................39
5.3 SYSTEM CLASSIFICATION FOR DIFFERENT 3DP/AM PROCESSES...................................................................................................40
5.3.1 Process Technologies for Industrial Application.....................................................................................................41
5.3.2 Materials for Industrial Application .......................................................................................................................41
5.4 CURRENT STATE OF 3DP/AM INDUSTRY AND MARKET OVERVIEW ..............................................................................................41
5.4.1 Market Trends & Developments (Check for double statements in numbers).........................................................41
5.4.2 Public Initiatives facilitating Industry Growth........................................................................................................42
5.4.3 3D Printing Industry Value Chain ...........................................................................................................................42
5.4.4 Additive Manufacturing – Technology Life Cycle Assessment................................................................................43
5.5 FUTURE INDUSTRY OUTLOOK ................................................................................................................................................44
5.5.1 Technology Maturity Cycle.....................................................................................................................................44
5.5.2 Academic Research Contributions and Cooperative Initiatives Driving Development ...........................................44
5.5.3 Industry Development in Numbers.........................................................................................................................44
4
5.5.4 Challenges & Skepticism ........................................................................................................................................45
5.6 BUILDING-BLOCK 2: PROCESS TECHNOLOGY PERFORMANCE & CAPABILITIES .................................................................................46
5.6.1 Comparative Frame of Reference...........................................................................................................................46
5.7 QUALITY PERFORMANCE......................................................................................................................................................46
5.8 PRODUCT QUALITIES ...........................................................................................................................................................47
5.8.1 Geometric Properties .............................................................................................................................................47
5.8.2 Mechanical Properties............................................................................................................................................48
5.8.3 Physical Properties .................................................................................................................................................49
5.9 PROCESS SPEED..................................................................................................................................................................50
5.9.1 Processing Speed –Build Rates...............................................................................................................................50
5.9.2 Set-up & Post-processing time ...............................................................................................................................50
5.10 COST EFFICIENCY..............................................................................................................................................................51
5.10.1 Material Costs ......................................................................................................................................................52
5.10.3 Machine Energy Consumption .............................................................................................................................55
5.10.4 Labor Costs...........................................................................................................................................................56
5.11 FLEXIBILITY......................................................................................................................................................................56
5.11.1 Product Flexibility.................................................................................................................................................56
5.11.2 Mix Flexibility .......................................................................................................................................................57
5.11.3 Volume Flexibility .................................................................................................................................................58
5.12 Dependability ..........................................................................................................................................................59
5.13 BUILDING-BLOCK 3: STRATEGIC PURPOSE & PARADIGMATIC APPROPRIATENESS...........................................................................60
5.13.1 Aerospace.............................................................................................................................................................60
5.13.2 Automotive...........................................................................................................................................................61
5.13.3 Medical.................................................................................................................................................................61
5.13.4 Consumer Goods ..................................................................................................................................................61
6.0 ANALYSIS & DISCUSSION OF FINDINGS ......................................................................................................................62
6.1 BUILDING-BLOCK 2: PROCESS TECHNOLOGY PERFORMANCE & CAPABILITY ANALYSIS ......................................................................62
6.1.1 Quality....................................................................................................................................................................62
6.1.2 Speed/Time ............................................................................................................................................................64
6.1.3 Cost Efficiency Performance...................................................................................................................................64
6.1.4 Flexibility Performance...........................................................................................................................................67
6.1.5 Dependability Performance....................................................................................................................................69
6.1.6 Summary of Results for Building-block 2: Analysis.................................................................................................70
6.1.7 Concluding Implications from BB-2 Analysis ..........................................................................................................71
6.2 BUILDING BLOCK 3 – STRATEGIC PURPOSE & PARADIGMATIC APPROPRIATENESS............................................................................71
6.2.1 Analysis of Manufacturing System Classification of AM........................................................................................72
6.2.2 Analysis of Appropriate Manufacturing & Business Strategic “fit”........................................................................72
6.2.3 Concluding Implications from building-block 3 – Analysis .....................................................................................74
6.3 BUILDING-BLOCK 4: DISCUSSION ON IMPLICATIONS FOR AM-ADAPTED SUPPLY CHAINS..........................................75
6.3.1 The Re-distribution of Manufacturing....................................................................................................................75
6.3.2 Performance Implications for Re-distributing the Geographical Landscape of Manufacturing.............................76
6.3.3 Impact on Cost Performance..................................................................................................................................77
5
6.4 Supply Chain Design & Configuration Strategies ......................................................................................................78
6.5 Concluding implications from BB4-Discussion...........................................................................................................79
7.0 CONCLUSIONS............................................................................................................................................................80
7.1 ADDITIONAL CONSIDERATIONS & FUTURE RESEARCH PROPOSALS ................................................................................................83
7.2 CLOSING REMARKS .............................................................................................................................................................84
8.0 LIST OF REFERENCES ..................................................................................................................................................85
9.0 TABLE OF APPENDICES...............................................................................................................................................98
Table of Figures
Figure 1 – Conceptual research framework of the thesis. Source: Own construction........................................... 13
Figure 2 – Strategic ambition and operational reality. Source: own creation, Inspired by Paton et al, 2011, p.380.
............................................................................................................................................................................... 15
Figure 3 – Generic manufacturing Strategies. Own creation, adapted from Kim & Lee, 1993 p. 9. ..................... 19
Figure 4 – A synthesized strategic framework: a conceptual representation. Source: Own creation, adapted from
Kotha & Orne, 1989, p. 225. .................................................................................................................................. 21
Figure 5 – Typology of Production systems & practical examples- Own creation, adapted from Kim & Lee, 1993,
p. 6-7...................................................................................................................................................................... 22
Figure 6 – Differences between deductive and inductive reasoning in research. Own creation, inspired by
Bryman & Bell, 2015, p. 23.................................................................................................................................... 28
Figure 7 – Dynamics of the research process. Source: Own creation, adapted and configured from Dubois &
Gadde, 2002, p. 555............................................................................................................................................... 30
Figure 8 – Value of the AM/3DP market worldwide from 2011-2014. Own creation, adapted from Wohlers
Associates (2013, 2015)......................................................................................................................................... 41
Figure 9 – 3D Printing Industry value chain. Source: Own creation, inspired by Business insider 2012, Marketline
2013, and Frost & .................................................................................................................................................. 42
Figure 10 – Technology adoption Life Cycle. Own creation, adapted from Rogers 1995, and Moore 2007, – as
illustrated in Mellor, 2015, p. 20. .......................................................................................................................... 43
Figure 11 – Hype cycle for emerging technologies. Source: Gartner Inc., 2015.................................................... 44
Figure 12 – Quality Control Measurement Procedures for AM. Source: Own creation, adapted from Mani et al,
2015, p. 3............................................................................................................................................................... 46
Figure 13 – Cost model comparison. Source: Own creation, adapted from Hopkinson & Dickens, 2003, p. 38. .. 51
Figure 14a – The energy breakdown comparison for IM and SLS fabricated paintball handle. Source Telenko &
Seepersad, 2012, p. 477......................................................................................................................................... 55
Figure 14b – The energy breakdown comparison for IM and SLS fabricated paintball handle including mold
production. Source Telenko & Seepersad, 2012, p. 477. ....................................................................................... 55
Figure 15 – The relationships between costs vs. complexity for AM vs. TM. Source: Own creation, adapted from
Conner et al., 2014, p. 71....................................................................................................................................... 57
Figure 16a – Shop floor process flow for AM systems. Source: Own creation, adapted from Lee, 2013.............. 57
6
Figure 16b – Shop floor process flow for AM systems. Source: Own creation, adapted from Lee, 2013.............. 57
Figure 17a - Output volume comparison AM vs. PIM. Source: Atzeni et al., 2010, p. 315.................................... 58
Figure 17b - Output volume comparison AM vs.HPDC. Source: Atzeni & Salmi 2012, p.1154.............................. 58
Figure 18 - AM industrial application based on AM service provider industry revenue generation in 2014. Source:
own creation, adapted from Wohlers, 2014. ........................................................................................................ 60
Figure 19 – Radar diagram of contemporary in performance capabilities between AM vs. TM. Source: Own
creation.................................................................................................................................................................. 70
Figure 20a – Analysis of AM typological system classification. Source: Based on the proposed Typology by Kim &
Lee, 1993................................................................................................................................................................ 72
Figure 20b – Analysis of AM typological system classification compared with other systems. Source: Based on
the proposed typology by Kim & Lee, 1993........................................................................................................... 72
Figure 21 – Different strategic scenarios for AM in between different industries. Source: Own creation,
conceptual typologies adopted from Kim & Lee, 1993 and Porter 1980............................................................... 73
Figure 22 – Contemporary & future manufacturing & business strategic scenario for AM. Source: Own creation,
conceptual typologies adopted from Kim & Lee, 1993 and Porter 1980............................................................... 74
Figure 23a – Digital supply chain scenario. Source: Own creation, adapted from Lee, 2013. .............................. 76
Figure 23b – Conventional Supply Chain Scenario. Source: Own creation, adapted from Lee, 2013.................... 76
Figure 24a – Lead times for AM scenario. Source: Mashhddi et al., 2015, p 8. .................................................... 76
Figure 24b – Lead times for TM scenario. Source: Mashhddi et al., 2015, p 8...................................................... 76
Figure 25 - Net benefit comparison of traditional vs. digital manufacturing supply chain. Own creation, adapted
from Lee, 2013....................................................................................................................................................... 77
Figure 26 – New supply chain pipeline selection paradigm. Source: Own creation, a revised version of the
original by Christopher et al., 2006, p. 9. .............................................................................................................. 78
Figure 27 - Strategic roadmap for AM purpose boundaries. Source: own creation, inspired and adapted from
Kotha & Orne (1989).............................................................................................................................................. 79
Figure 28 – Updated conceptual framework including key determinants for each building block. Source: Own
creation.................................................................................................................................................................. 80
7
1.0 Introduction
1.1 Background
In the wake of the emerging global challenges addressed by keynote speaker Tom Goldsby at the 5th
Copenhagen
SCM summit in 2013, there were several key takeaways that inspired this thesis to explore sustainable operational
solutions that shapes the future of manufacturing operations and supply chain management (SCM).
Among the many challenges that increasing pressures from macro trends, represented by major socio-economic
forces and developments such as continued population growth and migration, rising economies’ growing buying
power, resource scarcity, and environmental climate change pose in shaping the future global business
environment, underline the fundamental need for manufacturing process innovation – defined as the steps and
activities in the improvement of the concurrent organizational processes and practices (Patton et al., 2011).
In the quest of meeting these challenges, the ever-increasing importance of technological innovation such as
integrated IT-solutions in daily operations cannot be underestimated as the emergence of computer-aided-
manufacturing (CAM), Enterprise Resource Planning(ERP) systems, Radio Frequency Identification(RFID) chips, just
to mention a few, are testaments to the revolutionary impact on the manner in which organizations manage their
operations to cope with the emerging macro-challenges. In that sense, the enabling impact of technology has
become a strategically important weapon that ensures continuous flow of value creation for its customers, and
further aid organizations to meet their goals (Ibid).
One can therefore argue that successful employment of operational innovation in manufacturing organizations
(MO) should be considered a key success factor in meeting these challenges in a sustainable and competitive
manner (SCM Summit, 2013). In addition, companies that adapt and grow through innovation, will therefore be
winners in a future paradigm characterized by enduring structural shifts that will set the business agenda for the
foreseeable future (Bain, 2011 p. 3).
1.1.2 Introduction to 3D Printing & Additive Manufacturing
3D-Printing (3DP) or Additive Manufacturing (AM) holds many of the key features of a manufacturing process-
technology-innovation that may possibly even trigger a paradigm innovation that has the potential to facilitate a
new supply chain strategies, and even: (…) change how companies frame what they do (Patton et al., 2011).
Ever since being introduced as the influx to the third industrial revolution back in 2012 (The Economist, 2012), the
publicity surrounding3D printing(3DP), Additive Manufacturing(AM), RapidPrototyping(RP), RapidManufacturing
(RM) or Stereolithography (SL) – as it initially was namedby the founder of the first RP technology, Charles Hull who
filed his patent in 1984 and later went on to found what is now considered the market leading systems provider,
3D Systems in 1986 – has sky-rocketed, leadingto anexplosioninthe fieldof researchonthe technology’s potential
in terms of industrial application and on the future implications it may have on - and within multiple areas of
production and manufacturing industries (Price, 2012).
8
Regardless of what can be described as quantum leaps in 3DP/AM technological advancements the last decade,
there have been conflicting opinions among scholars and industry experts with regards to the maturity rate of AM,
and more importantly its viability and readiness to be applied in direct manufacturing of finished goods (Berman,
2012).
1.2 Problem Discussion
The following problem discussion is structured into sequential sub-sections of contemporary issues andchallenges
that have motivated this thesis. Each sub-section constitutes a natural phenomenological order inwhichthe causal
relationship between them is discussed. First, contemporary macro-trends will be addressed and discussed (the
macro-external phenomenological problem), followed by the implications these macro-trends pose for
manufacturing, operations and supply chains of organizations (the internal phenomenological problem), before the
discussion will end with a brief introduction to the proposed implications of the thesis topic of industrial additive
manufacturing (the potential solution).
1.2.1 Developments in Macro-trends
As the global economy has accelerated during the last couple of decades, creatinga global economic system where
globalization – understood as and characterized by Holton (2005) as the : (1) rising exchange of people, goods,
information, values and habits, (2) an increased degree of interdependence between national and regional
economies, and (3) a rising awareness that the world is made up of a closed system with a certain amount of
resources in which needs divided in a sustainable way to avoid risks of wide-scale consequences (as notedinHesse
& Rodrigue, 2006 p.1) – has been the key drivers for the development of a globally integrated marketplace. There
are particularly three macro-trend developments that pose challenges for the manner in which organizations
employ and utilize their pool of resources.
1.2.1.1 Globalization and global population growth
There is a general consensus that global population growth will pose a major challenge for the global community in
the near future. According to the most recent development report on forecasted population growthby the United
Nations (appendix 1), the world population reached 7.3 billion in 2015, in which imply a growth of 1 billion people
only during the last 12 years. As most populationgrowthwill come from developingandemergingeconomies (Bain,
2011), new market opportunities will rise as increased buying power among the worlds most populated emerging
economies.
1.2.1.2 Urbanization & growing middle-class in emerging economies
Urbanization and expanding prosperity in emerging economies will see leading industries shift their focus from
advanced markets to developing ones (Bain, 2011; McKinsey, 2013). As most consumption occurs in cities
(Rodrigue, 2012), traditional geopolitical and economic powerhouses such as London and New York will see
themselves surpassed in terms of consumption, as buying power in emerging and developing economies will
represent a larger share of global consumption (appendix 1). Simultaneous population and urbanizationgrowthin
developing markets such Brazil and the MINT countries; Mexico, Indonesia, Nigeria and Turkey in which according
to Goldman Sachs’ head of economic research Jim O’neill will have the potential economic and demographic
landscape to shape and further dominate the future of consumption (Business insider, 2013).
9
1.2.1.3 Resource Scarcity & Environmental Change
Resource scarcity and environmental change has become a major challenge for the global community, with
potential developments such as scarcity of essential natural resources vital to the very existence of life becominga
real threat. Consequently, external legislative pressures from international political institutions such as new long
term oriented environmental sustainability initiatives exemplified by the Obama administrations “Clean Power
Plan” that aims to reduce carbon emissions from U.S. power plants to 32% below the registered 2005 levels by the
year 2030 (epa.gov, 2015), may very well mark the beginning of an era where political institutions actively
participates in an effort of increased focus on global resource scarcity and environmental sustainability, as fossil
fuels still remains the primary energy source inthe highest final energy-consumingtransport sector (Kojima & Ryan,
2010), the necessity for innovative solutions can not be underestimated.
1.2.2 Challenges in the Current Manufacturing Operations & Supply Chain Paradigm
The above-mentioned Macro-trend developments all pose major challenges for international operations
management and global supply chains defined as: “a minimum of 3 supply chain actors dispersed in different
locations of the world, involved in sequential value creation activities” (Mentzer, et.al, 2001; Stabell & Fjeldstadt,
1998, as cited in slides by Aseem Kinra in; managing global supply chains course).
Due to the rapid integration of global markets enabled by the internet eras partial erasing of cultural borders for
goods and services, evidential patterns and trends suggest an increased disintegration of production and
manufacturing, meaninga phenomenoninwhichwhere organizations findit beneficial to outsource non-core value
adding activities resulting incross-border physical separationof different parts of the productionprocess (Feenstra,
1998, Arndt & Kierzkowski, 2001).For instance, predicted forecasts on productionand manufacturing outsourcing
suggests that by the year 2020, 80 % of all goods in the world will be manufactured in a country different from
where they are consumed, compared with 20 % in the year the report was presented (Balou, 2007).
Thus, by adding up these macro-trends, a lot of indicators suggesting that manufacturers are now faced with a
paradox when trying to balance traditional location-specific advantages such as the access to cheaper factors of
production (Dunning, 2001; Guisinger, 2001) found for instance in Asia, with the ability to meet demand and
flexibility requirements for new product introductions in a time-to-market sense, that satisfy the ever-increasing
time-sensitive customers as for instance found in the fashion and apparel industry (Christopher et.al, 2006). Doing
all of this, while simultaneously satisfying what is considered every supply chains objective; profit maximization
(Manuj & Mentzer, 2008), leave MO´s in a situation where trade-offs in focus is becoming an increasingly difficult
task.
1.2.2.1 The Manufacturing & Operational Challenge
Paton et al (2011) propose the following external factors as drivers of innovation that enhance internal efficiency:
1. Increased competition: in cost and quality due to increasedglobal competition, posingchallenges for ever-
increasing standards of performance requirements
2. Increasing complexity: through the dynamics of customer pull – meaning increased demand for
differentiated, customized and functional products and technology push – meaning the ability of R&D to
continuously create more sophisticated products that conforms to the customer pull.
10
3. Increased focus on sustainability:suchas environmental issues, labor exploitation, tighter political policies
related to factory pollution and carbon emission fee programs impacting the transport economy.
Putting the external factors into the equation, underlines the importance of the MO´s ability to design processes
that: “produce the greatest output for the least input” (Paton et al., 2011 p. 4).
1.2.2.2 The Industrial Emergence of Additive Manufacturing
The driving characteristics of 3DP/AM that have spurred enthusiasm among industry experts as the most exciting
disruptive process technology (PT) in manufacturing, is derived from its ability to provide almost unconstrained
design freedom for the user. The computerized technology software applied in 3DP/AM known as 3-dimensional
computer-aided design (3D-CAD) is only limited by physical attributes of materials available for the printer system,
allowing almost unconstrained geometrical flexibility (Gibson et al., 2010; Holmström et al., 2010).
Regardless of the fascinating future prospects of 3DP/AM as a method of Direct Digital Manufacturing(DDM) may
hold, the existing consensus among researchers and industry experts alike, is that AM is not yet ready for mass
adoption due to the technology’s inability to support high-volume production of end-use products (AM Platform,
2014). That being claimed, industry reports indicate that companies are already exploring the technology to a
greater extent than what is being expressed (Deloitte, 2015). For instance, it is arguedthat by 2019, 10% of discrete
manufacturers will apply 3DP/AM in their part-manufacturing operations (Gartner, 2015).
1.3 Thesis Purpose
Based on the above discussion, the purpose of this thesis to provide a preliminary decision-making tool for
managers that are exploring the potential impact, implications anddisruptive force embeddedinthe emergence of
industrial AM. The manner, in which the author goes about this task, is throughidentificationandaddressingof key
adoption determinants that stimulate the decision process. The thesis further has both academic and practical
implications through the four following focus points:
(1) Technology & market overview: Identification of challenges and opportunities of AM through an
exploratory market analysis.
(2) Technology performance & capabilities: Identification of the contemporary performance capabilities of
AMT on a conversion process basis.
(3) Strategic focus & paradigmatic fit: Identification of current purpose areas and strategic fit withregards to
the following levels of strategic influence: (1) manufacturing operations, (2) general business, and supply
chain strategic orientations.
(4) Implications for operations & supply chains: Identificationof managerial implications and impact that AM
may have on operations and supply chain performance.
11
1.4 Research Gap & Thesis Structure
The research gap of this thesis is defined by the author’s acknowledgement of the importance of systemsthinking
in managerial decision-making and operations management, characterized by a holistic approach to process-
oriented optimization of internal cross-functional business processes. Thus, the research gap is guided by
communication of the potential impact of AM on system properties, as it is assumed that provision of better
understanding of process improvement is integral to operational efficiency as: “all business processes and
operations are systems” (Paton et al., 2011, p. 171).
This implies that the research gap and structure of the thesis follows a reversed sequential order to that found in
the problem discussion, simultaneously recognizing the importance of the resource-based view (RBV) originally
proposed by Penrose (1959). According to the RBV, everything that happens inside the organization is just as
significant as what is happening on the outside (Paton et al., 2011). Thus, the logical vantage point of the thesis is
clarification and assessment of AM characteristics, features and capabilities, referred to in this context as the
manufacturing & operational solution – involving optimal utilization of organizational resources.
The internal phenomenological consequence is two-folded. First, this thesis explore the degree to which internal
capabilities, organizational processes, and firm attributes may be influenced by AM adoption. Second, it aims to
identify which manufacturing environments that are more supportive of the adoption-decision.
Finally, the external phenomenological consequence look at how the general disruptive characteristics of AM may
influence the manner in which organizations manage their supply chain activities.
1.5 Delimitations
Drawing on the notion by Voss (1986, 1988), this thesis distinguishbetweenadoptiondecisions andimplementation
of industrial systems. While adoption decisions is more strategically oriented and concerned with mapping of the
impact of that an adoption decision may have on current operational processes, the implementation process is
more concerned with: “early usage activities immediately followingthe decisiontoadopt aninnovationandending
when the use of innovation becomes routine practice” (Meyers et al., 1999, p.297).
This thesis is dedicated to explore the former.
12
2.0 Research Framework
This thesis takes a multi-dimensional holistic approach to answering of the following driving research question:
“What are the most important considerations and key determinants for industrial AM adoption?”
2.1 Conceptual Research Framework
In order to answer the driving research question, a thorough multi-disciplinary research proposal is necessary to
explore potential capabilities and impact of AM. This section presents the conceptual framework in which the
research departures from.The framework consists of four sequential “building blocks” (BB), in whichserves as the
guiding structure in answering the main research question. These four blocks further provide a categorical
visualization of the main constituent areas of the conducted research.
Figure 1 – Conceptual research framework of the thesis. Source: Own construction.
The proposed multi-dimensional framework illustrated above involve both internal and external decision-
influencing factors, requiring utilization of trans-disciplinary data sources, empiric evidence from existingresearch
and peer-reviewed literature from an extensive body of academic journals. The following building block are
considered most important to explore when considering adoption of AMT´s.
2.1.1 Block 1: Market Outlook & Technology Readiness
In order to make strategic adoption decisions with regards to choice of PT, it is considered important to gain
preliminary understanding of the technology´s maturity and readiness through a careful exploratory assessment
and monitoring of technology – and market developments. This sectiontherefore takes anexploratory approachin
order to identify patter of opportunities and challenges noted by academics, practitioners andindustry specialists.
Main Research Question: What are
the the most important considerations
and key determinants for industrial AM
adoption?
Building-block 1:
Technology
&Market Overview
Building-block 2:
Process-Technology
Performance &
Process Capabilities
Building-block 3:
Strategic Purpose
& Paradigmatic
Appropriateness
Building-block
4:
Operations &
Supply Chain
Implications
13
In addition, the investigation of historical and topical growth indicators will be looked at to assess the predicted
future outlook for the industry.
2.1.2 Building Block 2: Technology Features & Performance Capabilities
In line with the proposition by Kim & Lee (1993), it is assumed that identification of distinguishingcharacteristics of
manufacturing technologies is of high importance in the adoption decision process. Hence, identifying these
characteristics, features and performance capabilities for AM, is considered a key determinant for adoption. It is
further proposed that that an analysis of a new PT’s potential value or worth can be identifiedthrough: “exploring,
understanding and describing the strategic consequences of adopting alternatives” (Slack & Lewis 2011, p. 201).
Therefore, an investigation of the ability of AM to conform to the same processing standards set by traditional
manufacturing technologies (TMT) on a conversion process level is considered an important constituent for AM
adoption.
2.1.3 Building Block 3: AM Strategic Purpose & Paradigmatic Appropriateness
As operations can be described as: “the engine that drives the business” (Paton et al., 2011, p. 53), in which where
operations strategy constitutes the long-term guidelines, the PT’s fit withoverall business - andoperations strategy
is considered an important determinant in the adoption-decision process. Hence, the knowledge andinsight found
in BB-1 and BB-2 with regards to AM´s distinguishing features, characteristics, technology readiness and
conversion-process performance capabilities, will coupledwithobservations oncontemporary areas of application
to determine the strategic conditions under which AM adoption is most viable.
2.1.4 Building Block 4 Discussion: Operations & Supply Chain Performance
It is assumed that the potential positive impact on operations and supply chain performance constitutes the
ultimate key adoption determinant of a new manufacturing system. Hence, this section investigates the extent to
which AM may impact the current paradigm of supply chain strategy and performance.
2.2 Choice of Theory
According to Strauss & Corbin (1990) the researcher’s choice of theoretical frameworks applied in the respective
research project, are dependent on the nature and purpose of the research. For instance, in confirmatory studies,
literature may involve conceptual frameworks, in which aid in identification of “important variables, suggest
relationships among them, and direct interpretation of findings” (Dubois & Gadde, 2002, p. 559). Conversely,
theory-generating studies aim to discover new dimensions of a phenomenon. Hence, existing theory must be
viewed under scrutiny of the novel findings. Strauss & Corbin(1990) claim that the manner, inwhichthe researcher
approaches the latter, is less constrained.
As theoretical frameworks is supposedto drive the answeringof the proposedresearchquestion(s), the preliminary
literary framework for this thesis draws upon well-established concepts derived from operations, manufacturing
and process-technology strategy. The most important contributors within each area are illustrated in table 1.
14
Theoretical Concepts Authors
General business strategies Porter (1980, 1985)
Manufacturing operations
strategies
Woodward (1958, 1965), Skinner (1969), Hayes & Weelwright (1984), Kotha & Orne (1989),
Platts & Gregory (1992), Miller & Roth (1994)
Operations Strategy Paton et al (2011), Slack & Lewis (2011)
Operations performance
dimensions
Paton et al (2011), Slack & Lewis (2011)
Table 1 – Overview of driving contributions & authors from the literature review. Source: Own creation.
3.0 Literature Review
This section of the thesis includes the introduction of different theoretical concepts driving the thesis. In addition,
the literature presented forms the basis for each of the identified BB in the conceptual framework foundinsection
2.1. Each BB – with the exception of BB-1, in which is restricted to explorationanddescription– has its ownspecific
theoretical literature that holds relevance in answering of the main-research question.
3.1 General Business Strategy vs. Operations Strategy
Figure 2 – Strategic ambition and operational reality. Source: own creation, Inspired by Paton et al, 2011, p.380.
Paton et al (2011) defines operations management (OM) as: “the activity of managing the resources of the
organization that delivers goods and services”. Further, Hayes (2005) argues that efficient OM is followed by an
effective operations strategy andmust support corporate strategy inorder to contribute to competitive advantage.
There are three generally acknowledged levels in which strategies are formulated within an organization. These
include: (1) the corporate level – in which where strategic guiding principles of value creation, unique to the
individual organization is defined (2) business level – in which where strategic goals and objectives related to the
competition basis of a specific business unit within its specific industry is defined, and (3) function level – in which
relates to how individual functions such as operations, marketing, finance, etc. creates a plan of action (Barnes,
2008; Paton et al, 2011).
(1) Corporate:
Top management
Mission
Values
Policies
Competitive basis
Vision
(2) Corporate:
Success Criteria
Goals
Strategies
(3) Business
unit:
Strategic
conditions
(4) Business unit:
Mission
Policies specific to
divisions
Competition basis
Vision (5) Function:
Objectives
Success criteria
Strategies
Projects
(6) Function:
Operational action plan
Financial plan
15
3.2 Manufacturing Strategy
Operations strategy is concernedwithsuccessful management of resource capabilities that meets the requirements
of the market, and the manner in which organizations deploys and utilizes its resources, is further dependent onits
ability to: “successfully pursue specific performance objectives” characterized as: “(…) criterions against which to
evaluate the performance of operations”(Barnes, 2008). However, as operations take many shapes, the nature in
which the resource capabilities that are being managed, deployed and utilized varies a lot depending on which
perspective that is employed (Swink & Hegarty, 1998). This section therefore seeks to identify the relevant
concepts of manufacturing strategy.
3.2.1 Scope and Definitions
Voss (2005) argues that literature on manufacturing operations and related strategic decisions that provide
guidelines for exceptional performance can be separated into “three distinct, but, related paradigms of
manufacturing strategy” (Voss, 2005, p.1216), including: (1) competing through manufacturing, (2) strategic
choices in manufacturing, and (3) best practices. An important distinction is that all these paradigms all have
different approaches to manufacturing strategy content, rather than the process itself.
For instance, Hill (1993) argues that competition through manufacturing is done through focus on what he defines
as order winning criteria in the specific market, including: price, delivery, quality, product designandvariety. Platts
& Gregory (1992) also provide an external approach, stating that market requirements such as delivery lead time,
reliability, product features, quality, design flexibility, output volume and price are the vantage point in which
organizations should develop their internal capabilities.
Conversely, elements of the strategic choice paradigm was first discussed in the pioneering work by Woodward
(1965) and Skinner (1969), but has later been further developed into what is considered the dominant model in
manufacturing strategy by Hayes & Wheelwright (1984). The strategic choice paradigm buildthe process structure
based on internal resource capabilities such as plant and equipment, production planning and control, labor and
staffing, product design and engineering, and organizationandmanagement (Skinner 1969; Voss; 2005). The most
recent of the three paradigms, is the best practices paradigm derived from the Japanese car-making industry. Its
emphasis is focused on world-class manufacturing throughbenchmarkingof best industry practices andcontinuous
improvement through process re-engineering (Voss, 2005).
3.2.2 The Strategic Choice Paradigm
According to Voss (2005), the strategic choice paradigm carries the highest potential for the pursuingMO. Givenits
contingency-based approaches, as for instance embeddedinHill (1993) – inwhichemphasize that process choice is
based on the interdependent requirements between market strategy, and the order winning criteria that nurture
internal and external consistency.
However the differences and commonalities between the paradigms exist. The key similarity is that all emphasize
that exceptional performance is achieved differently for each individual organization, as they all have different
prerequisites in terms of external market conditions, and internal resource availability.
16
3.2.2.1 Competitive Priorities
Hayes & Wheelwright (1984) propose two constituents of manufacturing strategy, competitive priorities and
decision categories. Competitive priorities consider manufacturing strategy from the market-based view (Porter,
1980). This view interprets manufacturing operations as an adjustable system that can be tailored to meet
customer values and expectations, and relates to the idea that all companies at least compete on the basis of one
out of the four following priorities: quality, lead-time, cost or flexibility, each priority satisfyingdifferent dimension
of market requirements. These competitive priorities are all derived from manufacturing operations, and are still
valid today, although more contemporary literature has included more dimensions. Table 2 illustrate the originally
proposed competitive priorities
Competitive priorities Description
Quality Manufacture of products with high quality and performance
standards
Delivery Reliable (on time) and fast (short delivery lead time) delivery
of products
Cost Production and distribution of the product at low cost
Flexibility Ability to handle volume and product mix changes
Table 2 - General competitive priorities. Source: Hayes & Wheelwright, 1984; Rudberg & Olhager, 2003
3.2.2.2 Decision Categories
The second constituent, involve eight decision categories that was further defined and divided into structural
and infrastructural categories by Rudberg & Olhager (2003), with four categories in each sub-category found in
table 3..
Decision categories Policy areas
Structural:
• Process choice
• Facilities
• Capacity
• Vertical integration
Process choice, technology, integration
Size, location, focus
Amount, timing, increments
Direction, extent, balance
Infrastructural:
• Manufacturing planning
and control
• Performance
measurement
• Organization
• Quality
System design, decision support
Measurements, methods of measure
Human resources, design
Definition, role, tools
Table 3 - Decision categories and related policy areas. Source: Hayes & Wheelwright, 1984; Rudberg & Olhager, 2003.
Decision categories consider manufacturing strategy from the approach of the resource-based view (RBV). In that
sense, the RBV is an integral part of manufacturing strategy. Hayes & Pisano (1994) further claim that decisions
made with regards to structural and infrastructural decision categories, impact the manner in whichorganizations
utilize their resources and dictate what types of practices the organizationchoose to employ. Tanet al (2007) refers
to these operating characteristics as manufacturing capabilities.
17
3.2.2.3 Manufacturing Capabilities
According to Größler & Grübner (2006), the two aforementioned constituents of manufacturingstrategy makes up
what is defined as the manufacturing capabilities. Hallgren (2007) elaborates on this notion and states that
manufacturing capabilities relates to “the set of practices inuse” withinthe manufacturingoperation.Inadditionto
decisional alignment between the set of practices in use such those related to choice PT, Voss (1986) argue that
market specific, order winning criteria, is key to maximize organizational performance.
Although traditional manufacturing literature often assess the achieved level of operational performance and
utilization of organizational capabilities through the lens of the four Performance objectives (PO) derived from
competitive priorities discussed above, the current body of literature is inconsistent in terms of how many, and
further which manufacturing capabilities that should be given most attention. For instance, Ferdows & de Meyer
(1990) proposed in their “sand-cone model” that all performance is rooted in the ability to provide exceptional
quality. Furthermore, Größler & Grübner (2006) has suggested that these four are interrelated, and that an
organizations ability to pursue exceptional delivery performance is dependent on its ability to achieve equally
outstanding performance in quality, and so on. Table 4 illustrate those capabilities in which Größler & Grübner
(2006) suggest to be most important
Manufacturing capability Description
Quality:
Manufacturing conformance
Product quality and reliability
Delivery:
Delivery speed
Delivery reliability
Manufacturing lead time
Flexibility:
Volume flexibility
Mix flexibility
Cost:
Labor productivity
Inventory turnover
Capacity utilization
The ability to produce in accordance with specification and
without error
The ability to deliver products quickly, and in accordance with
customer requirements
The ability to change volume, manufacturing processing time,
product mix and to innovate through new product introduction
The ability to produce at low cost
Table 4 - Manufacturing capabilities and related dimensions. Source Größler & Grübner, 2006; Barnes, 2008.
3.3 Manufacturing Strategy Typologies
Muchcontemporary work onbusiness andmanufacturingstrategy departures from the dominant business strategy
paradigm proposed by Porter (1980; 1985) in which where he suggest three generic approaches to competitive
strategy that place organizations competitive priorities into a strategic context.
3.3.1 Typologies of Generic Business Strategy & Manufacturing Strategy
Miller & Roth (1994) provideda generic taxonomy for manufacturingstrategies. Throughdevelopment of capability
profiles based on competitive capabilities identified inthe work of skinner (1969) andHayes & Wheelwright (1984),
they pooled manufacturers into three strategic categories, including: (1) caretakers – are predominantly focusedon
low prices as the dominant capability, followed by time-based competitive capabilities, (2) marketeers – seek to
obtain broad distribution and offer broad product lines and to be responsive to changing volume requirements.
18
Priorities withinthe marketeer cluster were conformance quality, dependable deliveries, andproduct performance.
The Innovators – place highest emphasis on differentiation through uniqueness in designandrate of new products
introduced. Price is not considered an important variable in this category.
3.3.2 The Relationship between Generic Business Strategy &Manufacturing Strategy
Although the generic taxonomy by Miller & Roth (1994) provides a simple classification of manufacturingstrategic
orientations, based on well-known characteristic focus of performance (e.g. cost as a competitive priority), it does
not consider the importance of alignment between structural and infrastructural decision categories with generic
business strategy. For instance, Swamidass & Newell (1987) first proposed two dimensions of generic
manufacturing strategy, namely cost efficiency – and differentiation.
These two dimensions has later been the focal point for multiple authors in the development of conceptual
taxonomies that describe typologies of generic manufacturingstrategic approaches. As notedinthe sectionabove,
PO’s such as cost, quality, flexibility and delivery have dominated much of the literature involving competitive
dimensions (Kim & Lee, 1993). However, the 2x2 taxonomy proposed by Kim and Lee (1993), illustrated in fig.3
below, provide an adapted typology that place generic business strategies into the context of manufacturing. The
taxonomy is further based on the three generic approaches to business strategy proposed by Porter (1980, 1985),
including: (1) cost leadership, (2) differentiation, and (3) focus.
Figure 3 – Generic manufacturing Strategies. Own creation, adapted from Kim & Lee, 1993 p. 9.
(1) Cost leadership strategy: is first and foremost aimed towards optimizing the output volumes of non-discrete
products. Pursuant MO´s may thereby gain competitive edge in industries where scale of production is
symbolic for increased relative market share (Kotha & Orne, 1989). Two types of cost leadership is further
recognized by Porter (1980), namely; industry-wide and segment-oriented.
(2) Differentiation strategy: is associated with the goal of differentiation through for instance appealing to
customer expectations of high variations in the product mix, superior product quality, and/or short leadtimes
(Kim & lee, 1993). According to Kotha & Orne (1989), the strategic target is usually more segmenteddue to the
more customized and discrete nature of products offered. Porter (1980) emphasizes that industry-wide and
segment-oriented approach is also viable for differentiation strategies.
(3) Cost & differentiation strategy: was previously not conceivedto holdany potential strategic advantage (Kim &
Lee, 1993). However, as integration between process technologies andIT-solutions suchas CAM, CAD andFMS
have paved way for mixing cost anddifferentiationstrategy at corporate level, but also betweenbusiness units.
Pure
Differentiation
High Cost &
Differentiation
No Intended
Strategy
Pure Cost
Leadership
Low
HighLow Cost Efficiency
Differentiation
19
In more recent times, anadditional fourthstrategic orientation has openedupnew business opportunities for MO’s
(Paton et al., 2011). First proposed and popularized by Pine (1993), mass-customization is a relatively new
manufacturing strategic approach, in which first and foremost has been driven by rapid advances in machine
technology enabling increased personalization of products. In contrast to focusing on production of high volume,
standardized products as found in mass-production, where manufacturers are leveraging on the concept of
economies of scale, mass customization is more focused on achieving economies of scope, the economic concept
that place emphasis on “high variety of outputs from a single process” (Paton et al., 2011 p. 149).
3.3.3 Primary Dimensions & Underlying Variables of Manufacturing Strategy
From an internal organizational perspective, it is further assumedthat primary dimensions andunderlyingvariables
of the manufacturing structure typology proposed by Kotha & Orne (1989), dictates the appropriate external
strategic focus of the organization.
The authors propose a manufacturing structure framework composedof three structural constituents illustratedin
table 5. When combined with Porters typology of generic business strategy (Porter 1980; 1985), and/or the
adapted model by Kim & Lee (1993), form a conceptual synthesis. In addition, the synthesis distinguish itself in the
way that it in addition to the traditionally proposed dimensions: (1) process structure complexity, and (2) product
line complexity, employs a third perspective (3) organizational scope, in which takes factors related to the
geographic scope of operational activities into consideration.
Primary
dimension
Underlying Variable Dimension of underlying variable
Process
Structure
Complexity
Level of mechanization (1) Manual, (2) Machine, (3) Fixed program, (4) Programmable
Level of systemization (1) Data collection, Event reporting, (3) Tracking, (4) Monitoring, (5) Guide, (6) Control
Level of interconnection (1) Discontinuities, (2) Technological interdependences, (3) Operational flexibility
Product Line
Complexity
End product complexity (1) High product line complexity (complexity/variety/volume/maturity)
(2) Medium product line complexity (complexity/variety/volume/maturity)
(3) Low product line complexity (complexity/variety/volume/maturity)
Variety of final product
Individual product volumes
End-product maturity
Organization
al Scope
Geographic manufacturing
scope
(1) High organizational scope (global)
(2) Medium – high organizational scope (multinational)
(3) Medium organizational scope (national)
(4) Medium – low (regional)
(5) Low organizational scope (undefined)
Geographic market focus
Vertical integration
Customer – market scope
Scale
Table 5 - Manufacturing structure typology: primary dimensions and underlying variable. Source: Own creation, adapted from Kotha
& Orne, 1989.
3.3.3.1 Process structure complexities
Process structure complexity, is concerned with the capabilities of the process flow, and include elements suchas:
(1) the level of mechanization, meaning the degree to which a process is able to repeatedly perform tasks with a
satisfying degree of automation; (2) level of systemization, meaning the level to which platform interdependent
integration between direct technology applied in the conversionprocess andindirect process technologies process
technologies such as ERP systems, that facilitates high connectivity exists (Paton et al., 2011; Slack & Lewis, 2011);
20
and (3) the level of interconnection, meaning the degree to which the process flow on the shop floors are
characterized by fluency or discontinuity.
3.3.3.2 Product line complexities
Product line complexity is concerned with bridging internal resource capabilities and external markets
requirements. Elements in this dimension include: (1) end product complexity, (2) variety of final products (3)
individual product volumes, and (4) end-product maturity.
3.3.3.3 Organizational Scope
As a dimension, the organizational scope of the organization includes additional elements not traditionally foundin
other strategic typologies (Kotha & Orne, 1989). For instance, it includes structural characteristics missing in the
first two, such as considerations with regards to location-specific advantages related to easier access to factor s of
production (e.g. raw materials and labor), and factors involving proximity to the marketplace, supplier and
distribution networks.
3.3.3.4 Conceptual Synthesis
The conceptual synthesis is built on two primary assumptions. First, it is assumed that MO’s in which pursue
cost leadership, place considerable emphasis on reducing the costs associated with each step in the process
flow. Hence, the related manufacturing structure characteristics are suggested to be “low product line
complexity and high process structure complexity” (Kotha & Orne, 1989, p. 225). Conversely, the second
assumption suggests that that MO’s pursuing differentiation strategy “tend to have more complex product lines
and more discontinuities in the process structure” (Kotha & Orne, 1989, p. 225). Between these two
assumptions, the author identifies eight different manufacturing structures.
(1) Segment, neither cost nor differentiation
strategy
(2) Segment, differentiation strategy
(3) Segment, cost leadership strategy
(4) Segment, mixed strategy
(5) Industry-wide, mixed strategy
(6) Industry-wide, differentiation strategy
(7) Industry-wide cost leadership strategy
(8) Industry-wide, cost and differentiation
strategy
Figure 4 – A synthesized strategic framework: a conceptual
representation. Source: Own creation, adapted from Kotha & Orne,
1989, p. 225.
It is further noted by the authors, that: “within the context of the manufacturing structure framework, BU’s can
generate structural uniqueness – through generic strategies – by moving to the corners labeled 2, 3, 6 and 7”
(Kotha & Orne, 1989, p. 225).
7
5 6
8
3 4
21
Low
High
HighLow
Low
High
Process Structure
Complexity
Product Line
Complexity
Organizational
Scope
21
3.4 Accommodating Typologies for Process-Technology Strategy in Manufacturing
There is a general consensus among scholars that different types of process technologies thrive under different
strategic conditions (Kim & Lee, 1993). Hence, in the case of PT adoption decisions, MO´s shouldfirst andforemost
place emphasis on its operational “fit” with strategic perspective of the organization, and related guidelines found
in overall operations strategy (Slack & Lewis, 2011).
3.4.1 Technical Complexity & Technical Flexibility
One of the more recognized typologies for manufacturing system classification is that of Kim & Lee (1993). The
typology demonstrates a direct link between MO’s applied production system and manufacturing strategy. The
typology further propose two independent dimensions of process technologies and manufacturing systems, in
which recognize structural decision categories with regards to a PT’s fit with overall strategic orientation.
3.4.1.1Technical Complexity
The first dimension, technical complexity is defined as the: “complexity of the process technology”, and is further
composed of three characteristic elements, including: (1) the level of mechanization, (2) the level of predictability
and (3) the level of systematization, all somewhat corresponding with the elements included in process structure
complexity proposed by Kotha & Orne (1989).
3.4.1.2 Technical Flexibility
The second dimension, technical flexibility includes several variables including machine-, process-, product-, and
volume-flexibility. These elements are more related to product line complexity (Ibid), but also incorporate what is
considered “the most prevalent word in the manufacturing lexicon today”, flexibility (Kim & Lee, 1993, p. 6), noted
to be a key facilitating concept in mass-customization strategy and the achievement of economies of scope (Paton
et al., 2011).
3.4.1.3 Systems & Accommodating Order Types
Figure 5 – Typology of Production systems & practical examples- Own creation, adapted from Kim & Lee, 1993, p. 6-7.
Technical
Flexibility
Technical Complexity
High
High
Low
Low
Intermittent
system
Degenerate
system
Continuous
system
Concurrent
system
Technical
Flexibilit
Technical Complexity
High
High
Low
Low
Job Shop
Batch FMC
FMS
Anachronistic
factory Assembly
Line
Flexible
Assembly
Line
Transfer
LineContinuous
Flow Process
22
The figures above illustrate what Kim & Lee (1993) proposes to be four classifications of manufacturing and
production systems, and the corresponding operational process flow set-ups. The same authors elaborate that
certain system types more appropriately accommodates specific manufacturingstrategies. Patonet al (2011) notes
that certain customer order types are more appropriate for different manufacturing processing systems. Table 6
contains the key characteristics of, and relationships between type of system and accommodating orders.
Type of
manufacturing system
Characteristics Type of customer orders Characteristics
Continuous systems High volume capabilities
High levels of automation
High task specificity
High set-up costs
Make to stock (MTS) Standardized products
Made for inventory
Low customization
Forecast driven
Intermittent systems Low volume capabilities
Low task specificity
Low set-up costs
High process flexibility
High customization
Make to Order (MTO) Highly customized products
Complex products
Low levels of inventory
Concurrent systems Predefined medium lot volumes
Highly IT integrated
High levels of automation
medium task specificity
Assemble to order (ATO) “Hybrid” order type
Modular Inventory
Medium/high customization
Degenerate systems Outdated system without any
specific characteristics
N/a N/a
Table 6 – Key characteristics and relationship between system and order types. Source: Own creation, adapted from Kim & Lee, 1993
and Paton et al., 2011.
3.5 Manufacturing & Operations Performance
There is a strong link between an organizations strategic focus – understood in this context as: “the guiding
principle that differentiates one company from another” – and performance management, defined as the:
“systematic measuring, monitoringanddecision-makinggearedtowards fulfillingorganizational objectives through
operations management” (Paton et al., 2011, p. 377). However, it is noted by the same authors that because:
“measuring performance provide little value in itself”, it is the manner in which the organization selects and reacts
to performance data that aid in the creation of a future plan of action that contribute to the final value-creation.
3.5.1 Generic Performance Objectives
Contemporary performance management frameworks such as that of Slack & Lewis (2011) illustrated in table 7,
takes a generic approach of viewing operational performance based on the following five PO’s: (1) quality, (2)
speed, (3) cost, (4) dependability and, (5) flexibility.
23
Operations resources
Internal benefits include…
Performance
objective
Market requirements
External benefits include…
Error-free processes
Less disruption and complexity
More internal reliability
Lower processing costs
Quality Higher specification products
Error-free products
Reliable products
Faster throughput times
Less queuing and/or inventory
Lower overheads
Lower processing costs
Speed Short delivery queuing times
Fast response requests
Higher confidence in the operation
Fewer contingencies needed
More internal stability
Lower processing costs
Dependability On-time delivery of products
Knowledge of delivery times
Better response to unpredicted events
Better response to variety of activities
Lower processing costs
Flexibility Frequent new products
Wide range of products
Volume adjustment
Delivery adjustment
Productive processes
Higher margins
Cost Low prices
Table 7 - Internal and external benefits of excelling at each performance objective. Source: Slack & Lewis, 2011, p. 53.
What differentiates this framework from other is that it – in addition to enable establishment of relationships
between internal performance of processes and external response from the market, thereby recognizing the
relative importance of both the MBV and the RBV – also consider the fact that: “not all measures of performance
will have equal importance for an individual operation.” (Slack & Lewis, 2011, p. 66).
3.5.1.1 Quality Performance
Quality is relatively difficult to grasp as it involves many facets, is relatively subjective in nature, and is dependent
on the perceived interpretation and the contextual setting it relates to (Paton et al., 2011). Hence, several
philosophical approaches has been developed in literature, some building the central notion of quality around
customer expectations (Deming, 1986, Juran, 1988), while others have stated that product quality is a result of
exceptional management practices and high internal coordination (Crosby, 1979, Feigenbaum, 1986).
However, the most recognized conceptual classification of quality, is that of Garvin (1987), in which proposed 8
different perspectives of quality including: (1) performance, (2) features, (3) reliability, (4) conformance, (5)
durability, (6) serviceability, (7) aesthetics and, (8) perceived quality. For operations suchas manufacturing, it is the
conformance perspective of quality, understood as; “the degree to which a product’s design and operating
characteristics meet established standards” (As noted in Paton et al., 2011, p. 429), that is considered the most
important.
3.5.1.2 Speed Performance
In simple terms, speed refers to the operations ability to optimize the time-spanbetweenthe initial customer order
and the final delivery of the product or service (Slack & Lewis, 2011). In that sense speed has both internal as well
as external performance implications. From an external customer perspective the process already starts withwhat
is known as the enquiry decision time, in which relates to point when the decision to acquire a new product or
service is made. This step is followed up by the enquiry lead-time – in which is where the customer gathers
information about the ability of a provider to meet the specifications of the product they intendto purchase. As the
24
order is placed, it is what is generally understood as lead-time that unifies both perspectives that is important
(Paton et al., 2011).
From an internal operations resource perspective, speed relate to every fragmented step after the order is placed.
These steps include the service waiting time, where designing of the product in accordance with customer
expectations occurs, or the core processing time – meaning the time it takes to process the input materials to
output products, to the actual time from the product is shipped until delivery, referred to as the installation time
(Slack & Lewis, 2011).
3.5.1.3 Dependability Performance
Dependability is the other constituent of total delivery performance together with speed, in which indicate that its
contribution to performance are mainly focusedaroundsatisfyingexternal customer expectations by providingon-
time delivery of products (Slack & Lewis, 2011). The relative importance of dependability performance can be
argued to vary depending on the manufacturing strategy or competitive position taken by the individual
organization (Hallgren, 2007). For instance, anorganizationthat pursue pure cost leadershipstrategy – where order
types are typically made on a MTS basis – would most likely not relate to dependability as an important PO, as
delivery is instant and without customer involvement, while those pursuing an MTO strategy would place
considerable emphasis on high dependability performance.
3.5.1.4 Flexibility Performance
In an operational context, the definition of flexibility may relate to either an operations’ ability to: “adopt different
states – take up different positions or do different things”, or describe: “an operation that moves quickly, smoothly
and cheaply from doing one thing to doing another” (Slack & Lewis, 2011 p. 50)
The authors further distinguish betweenfour categories of flexibility, including: (1) product flexibility – the extent to
which an operation has the ability to introduce new products or modify existingones, (2) mix flexibility – the extent
to which an operation has the ability to change the variety offered within a given time period, (3) volume flexibility
the extent to which an operation has the ability to change the output of an operation quickly and, (4) delivery
flexibility – the extent to which an operation has the ability to change planned and assumed delivery dates,
respectively. According to Hallgren (2007), flexibility distinguishes itself, as it measures potential rather than
achieved performance.
3.5.1.5 Cost Performance
Cost performance – meaning the ability to produce at low costs, is widely acknowledged in academic literature as
the most significant PO, especially for those who compete onprice (Slack & Lewis, 2011). Inanoperational context,
Slack & Lewis propose a broad definition of cost to be: “any financial input to the operation that enables it to
produce its products andservices”. They further distinguishbetweenthree different dimensions or classifications of
costs. These include: (1) Operating expenditure – financial inputs needed to fund the operation (e.g. labor,
materials, rent and energy consumption), (2) Capital expenditure – relates to the financial inputs neededto acquire
the necessary equipment used in the transformationprocess (e.g. facilities, systems andprocessingmachinery), (3)
working capital – relates to the financial inputs needed to support the timeframe difference between cash inflow-
outflow from outgoing operating expenditures and received product payment.
25
4.0 Methodology
This chapter presents the framework of methodological approach aiming to aid the step-by-step maneuvering in
the answering of the main research question. In order to this, this chapter will define the guidingstructure indoing
so by elaborating on decisions made by the author with regards to philosophical paradigm, research design,
research approach, methodology for collection of data, and instruments applied in the collection of the data.
4.1 The Nature of Business Research
First, the research approach in this thesis is acknowledged by the importance of achieving evidence-based
management, understood as: “the systematic use of the best available evidence toimprove management practice”
(Reay et al., 2009, as cited in Bryman & Bell, 2015, p. 8).
The authors further emphasize a combination of four different information sources in which constitutes and
contributes to evidence-based management
• Practitioner expertise and judgement
• Evidence from the local context
• Critical evaluation of the best available research evidence
• Perspectives of those who may be affected by the decisions (Briner, Denyer, and Rousseau, 2009)
Gibbons et al., (2004) suggest that the production of scientific knowledge has two different approaches, or
“modes”. The first mode builds on the assumption that: “all knowledge production is driven primarily by an
academic agenda”(As cited in Bryman & Bell, 2015, p. 9), meaning that new knowledge should primarily take
departure from established concepts found in an existing knowledge base. The secondmode, focus more ontrans-
disciplinarity, meaning that in order to provide a holistic understanding of the research topic under scrutiny, the
problem at hand has to be viewed through a multi-disciplinary lens, as the productionof knowledge is assumednot
to be “confined to academic institutions” (Bryman & Bell, 2015, p. 9). According to Tranfield & Starkey (1998),
business research tends to be better suited for “mode 2”, as it involves several knowledge creators, including:
academics, policy-makers and practitioners. This thesis aim to reconcile bothmodes, as the evolutionof the fieldof
research holds different maturity stages from a technology perspective and business/operations management
perspective, calling for multiple approaches to answering of the research question at hand.
4.2 Philosophical Paradigms & Constituents of Scientific Research
In business research, the researcher often encounters several questions related to the: “basic belief system or
worldview that guides the investigator” in the creation of knowledge or interpretation of social phenomena
(Guba & Lincoln, 1994, p. 105). The following section address differences between philosophical paradigms,
and their business research relevance.
4.2.1 Philosophical Paradigms in Research
Guba & Lincoln (1994) suggest are three influencing elements that define a researcher´s belief system. The so-
called philosophical basis of the researcher is further determined by his/her approach to the following three
questions:
26
• Ontology: – meaning, “form and nature of reality and, therefore, what is there that can be known about it?”
• Epistemology: – meaning, “the relationship between the knower or would-be knower and what can be
known?”
• Methodology: – meaning, “How the inquirer (would-be knower) go about finding out whatever he or she
believes can be known?” (Guba & Lincoln, 1994, p.108).
Crotty (1998) proposed that the design of a research proposal should departure from a set of predefined and
interrelated elements, dictating the course of the research at hand. These elements include: epistemic position to
knowledge (objectivism or subjectivism, etc.), philosophical stance (positivism, interpretivist, etc.), and
methodological practices or instruments (interviews, conceptual modeling, content analysis, etc.) applied in the
process (as noted in Creswell, 2003, p. 4-5).
These guiding elements can according to Creswell (2003) further be translated into three sequential questions is
also referred to as elements of inquiry and include three interrelated inquiries (knowledge claims, strategies, and
methodology) that dictate the course of the researcher project (Ibid). The relationship between the elements and
their relative importance with regards to structuring of the research design framework are discussed in the
following sections.
4.2.2 Knowledge claims
The concept of knowledge claims is rooted in the predetermined set of the researcher´s assumptions with regards
to ontology, epistemology and methodology, embedded in the approach to learning aspect as well as the creation
of knowledge through the research project (Ibid). Traditional knowledge claims or so-calledparadigms inresearch,
include, post-positivism, critical theory, constructivism, and advocacy/participatory (Guba & Lincoln, 1994;
Creswell, 2003). In more recent times, an additional paradigm called pragmatism has been given increasing
attention in business, as well as social science research, domains that traditionally has been dominated by
positivistic and interpretivist approaches (Orlikowski & Baroudi, 1991). Table 8 includes some of the most relevant
knowledge claims, relevant paradigms and methodological approaches in business research.
Knowledge claim Ontology Epistemology Methodology
Post-positivism Conjectural Desired objectivity, however, the relationship between the
researcher and research problem indicate subjectivity
Quantitative
Constructivism Relativistic Subjectivity, as knowledge is created through the relationship
between the researcher and what is being researched.
Qualitative
Pragmatism Situational Consequence oriented, problem centered and pluralistic Mixed methods
Table 8 - The relationship between different philosophical paradigms and respective knowledge claims. Own creation, inspired by
Creswell, 2003.
4.2.3 Research Strategies
The approach taken by the researcher with regards to research strategy defined as: “the general plan of how the
researcher will go about answering the research questions” (Saunders et al., 2009, p. 600), is to a great extent
dependent on the knowledge claims and related philosophical perspectives of the researcher (Creswell, 2003).
Fundamentally, there are two different strategic research approaches, quantitative andqualitative research(Ibid).
27
4.2.3.1 Qualitative vs. Quantitative Research
As noted by Silverman (1997), the two methodologies in question were developed under two very different
approaches to ontology and epistemology, and therefore represent two distinct worldviews or paradigms
(Ibid). Creswell (2003, p.13) notes that quantitative strategies of inquiry such as experimental strategies and
surveys, constitute those in which: “invoked the post-positivistic perspectives”, and further influence the
researcher’s ability to view the world through an objective lens (Guba &Lincoln, 1994). Conversely, the same
authors suggest that qualitative approaches to research strategy such as ethnographical, phenomenological
research, and case studies, tend to fit better under constructivist paradigm assumptions of the researchers
knowledge claims are more subjective in nature.
4.2.3.2 Inductive vs. Deductive Reasoning
In cognitive science, the choices made by the researcher with regards to employment of a qualitative or
quantitative strategy approach, has additional implications for the nature of the relationship between theory and
research findings (e.g., data, observations, etc.) (Bryman & Bell (2011). Whether the researcher employs an
inductive or a deductive approach is traditionally recognized views of reasoninginresearch. Adeductive reasoning
paradigm aims for generalizationof particular observations throughdemonstrationof causal relationships between
theory and the research findings (Gulati, 2009). The relationship between theory and research findings through
deductive reasoning is characterized by testingof hypotheses that is guidedby establishedtheoretical assumptions
(Bryman & Bell, 2015). In addition, deductive reasoning is associated with positivistic/post-positivistic knowledge
claims, as observations are tested to the extent it is true or not (Creswell, 2003). Conversely, inductive reasoningis
associated with a constructivist/interpretivist worldview, and further: “involves the search for pattern from
observation and the development of explanations – theories – for those patterns through series of hypotheses”
(Bernard, 2011, p.7). Figure 6 provide a simple illustration of the different vantage points behind the two
approaches.
Figure 6 – Differences between deductive and inductive reasoning in research. Own creation, inspired by Bryman & Bell, 2015, p. 23.
4.3 Thesis Knowledge Claims
This thesis employs a pragmatic research approach. Pragmatism is especially applicable in IT and technology
research, as it is not only concerned with what is found in positivistic and interpretivist views to be the important
questions with regards to ontology of “what is”, but possess a orientation to knowledge about the world as to
“what might become” through: “explorationintosocial andtechnical potentials andopportunities” (Goldkuhl, 2012,
p.87). Three types of pragmatism can further be identified; functional pragmatism – meaning, knowledge for
actions, referential pragmatism – meaning, knowledge about actions, andmethodological pragmatism – meaning,
knowledge through actions (Ibid). As noted, this thesis adopts what (Goldkuhl, 2012) refer to as general functional
pragmatism, a sub-category of functional pragmatism that aim towards realization of widespread abstract
Theory Research Findings
TheoryResearch Findings
Deductive reasoning
Inductive reasoning
28
knowledge creation that not only provide value for a specific scientific community, but benefits cross-disciplinary
practitioners.
4.3.1 Thesis’ Pragmatic Approach to Ontology
The relationships between technology and social world has been a widely discussed as a complicated subject
among scholars (Lawson, 2007). With regards to the pragmatic ontological position, the thesis recognizes the
proposition that: “the essence of society lies in an ongoing process of action– not inapositedstructure of relations”
(Blumer, 1969, p. 71). This imply that explanation of abstract relationships between the artefact (AM) and social
reality are not driving progress, but is rather the basis from which where plans of action that encourage and
supports continuous improvement.
4.3.2 Thesis’ Pragmatic Approach to Epistemology
As discussed by Goldkuhl (2012), knowledge of “what is”, is found more important to positivists andinterpretivists
as it is limited to description, explanation and understanding. These elements are also of vital importance in this
thesis, as they are embedded in the author´s communication of the new and abstract knowledge, created for the
reader. However, they are only pillars in which potential solutions to a “world to-be” are built on. A “world to-be”,
in which the manager/practitioner, may or may not find favorable based on their interpretation of the
communicated knowledge.
Hence, the pragmatic epistemic foundation of this thesis can be characterized by its purpose of contributing a
possible/desirable solution to a practical problem (Ibid) through demonstration of evidence from reality that
supports the described, explained and understood.This canbe exemplifiedby the different types of knowledge that
each building-block attempts to create, illustrated in table 9.
Building-block Description of pragmatic epistemology
BB-1 Deviate from pure pragmatic knowledge creation, as its purpose is more in line with the
constructivist/interpretivist viewofunderstandingandexplainingcurrentphenomenological
relationship between the technological artefact (AM), and its relationship to the socially
constructed reality.
BB-2 Takes a combined approach recognized by Goldkuhl (2012) as the creation of evaluative
knowledge – meaning, diagnostic judgements through grounded reasoning, and attributive
knowledge – meaning, characterization of properties related to an object. The evaluative
knowledge creation in this thesis being the technology capability and performance
assessment of AM compared with TM methodologies, while the attributive knowledge
creation is part of the diagnostic assessment, as neither are mutually exclusive.
BB-3 Aim for the development of explanatory knowledge, meaning establishment of cause-to-
effect relationships of the implicationsofthe formertypesof communicated knowledgewith
regards to the object / technological artefact (AM). This logic derives from the assumption
that technology features, characteristics and performance assessment provide an
explanatory basis from which the strategic purpose boundaries of AM can be determined.
Table 9 – Overview of epistemic approaches, and knowledge contributions for each respective “building-block”. Source: Own
creation, Inspired by Goldkuhl, 2012.
29
Thesis incl. appendices

More Related Content

What's hot

Pagkakaiba ng Pangungusap at Di-pangungusap
Pagkakaiba ng Pangungusap at Di-pangungusapPagkakaiba ng Pangungusap at Di-pangungusap
Pagkakaiba ng Pangungusap at Di-pangungusap
JessaMarieVeloria1
 
Action plan-filipino
Action plan-filipinoAction plan-filipino
Action plan-filipino
MARY JEAN DACALLOS
 
Philippine Literature - The Rural Maid
Philippine Literature - The Rural MaidPhilippine Literature - The Rural Maid
Philippine Literature - The Rural Maid
Kenzie Ancheta
 
Halimbawa ng mga Lathalain 2
Halimbawa ng mga Lathalain 2Halimbawa ng mga Lathalain 2
Halimbawa ng mga Lathalain 2
JustinJiYeon
 
Iba't Ibang Uri ng Salapi o Pera
Iba't Ibang Uri ng Salapi o PeraIba't Ibang Uri ng Salapi o Pera
Iba't Ibang Uri ng Salapi o Pera
Nikka Jean Orbes
 
Saranggola
SaranggolaSaranggola
Saranggola
keanziril
 
Praymer hinggil sa Pambansang industriyalisasyon
Praymer hinggil sa Pambansang industriyalisasyonPraymer hinggil sa Pambansang industriyalisasyon
Praymer hinggil sa Pambansang industriyalisasyon
AGHAM - Advocates of Science and Technology for the People
 
Pagsusuri ng Maikling Kwento
Pagsusuri ng Maikling KwentoPagsusuri ng Maikling Kwento
Pagsusuri ng Maikling KwentoFerdos Mangindla
 
maikling kwento.pptx
maikling kwento.pptxmaikling kwento.pptx
maikling kwento.pptx
AngelicaMManaga
 
PYRAMUS AND THISBE
PYRAMUS AND THISBEPYRAMUS AND THISBE
PYRAMUS AND THISBE
Hannah Grace de Guzman
 
Noli me tangere kabanata 2
Noli me tangere kabanata 2Noli me tangere kabanata 2
Noli me tangere kabanata 2
Sir Pogs
 
Pang-abay-na-Pamaraan.pptx
Pang-abay-na-Pamaraan.pptxPang-abay-na-Pamaraan.pptx
Pang-abay-na-Pamaraan.pptx
RitchenCabaleMadura
 
Filipino 9 DLL 3rd Quarter Week 5.docx
Filipino 9 DLL 3rd Quarter Week 5.docxFilipino 9 DLL 3rd Quarter Week 5.docx
Filipino 9 DLL 3rd Quarter Week 5.docx
DCISGradeTen
 
Noli me tangere kabanata 16
Noli me tangere kabanata 16Noli me tangere kabanata 16
Noli me tangere kabanata 16
Sir Pogs
 
Panghalip (Kami, Kayo..)
Panghalip (Kami, Kayo..)Panghalip (Kami, Kayo..)
Panghalip (Kami, Kayo..)Jov Pomada
 
Panitikan o literatura ng Rehiyon X
Panitikan o literatura ng Rehiyon XPanitikan o literatura ng Rehiyon X
Panitikan o literatura ng Rehiyon X
AaldousMatienzo
 
Fil 6 sanggunian
Fil 6   sanggunianFil 6   sanggunian
Fil 6 sanggunian
aizenikuta
 
Banghay ng maikling kuwento
Banghay ng maikling kuwentoBanghay ng maikling kuwento
Banghay ng maikling kuwento
girlie surabasquez
 
Maikling Kuwento ni Mabuti, gabay sa pagbasa
Maikling Kuwento ni Mabuti, gabay sa pagbasaMaikling Kuwento ni Mabuti, gabay sa pagbasa
Maikling Kuwento ni Mabuti, gabay sa pagbasaNeri Zara
 

What's hot (20)

Pagkakaiba ng Pangungusap at Di-pangungusap
Pagkakaiba ng Pangungusap at Di-pangungusapPagkakaiba ng Pangungusap at Di-pangungusap
Pagkakaiba ng Pangungusap at Di-pangungusap
 
Action plan-filipino
Action plan-filipinoAction plan-filipino
Action plan-filipino
 
Philippine Literature - The Rural Maid
Philippine Literature - The Rural MaidPhilippine Literature - The Rural Maid
Philippine Literature - The Rural Maid
 
Halimbawa ng mga Lathalain 2
Halimbawa ng mga Lathalain 2Halimbawa ng mga Lathalain 2
Halimbawa ng mga Lathalain 2
 
Iba't Ibang Uri ng Salapi o Pera
Iba't Ibang Uri ng Salapi o PeraIba't Ibang Uri ng Salapi o Pera
Iba't Ibang Uri ng Salapi o Pera
 
Saranggola
SaranggolaSaranggola
Saranggola
 
Praymer hinggil sa Pambansang industriyalisasyon
Praymer hinggil sa Pambansang industriyalisasyonPraymer hinggil sa Pambansang industriyalisasyon
Praymer hinggil sa Pambansang industriyalisasyon
 
Pagsusuri ng Maikling Kwento
Pagsusuri ng Maikling KwentoPagsusuri ng Maikling Kwento
Pagsusuri ng Maikling Kwento
 
maikling kwento.pptx
maikling kwento.pptxmaikling kwento.pptx
maikling kwento.pptx
 
PYRAMUS AND THISBE
PYRAMUS AND THISBEPYRAMUS AND THISBE
PYRAMUS AND THISBE
 
Noli me tangere kabanata 2
Noli me tangere kabanata 2Noli me tangere kabanata 2
Noli me tangere kabanata 2
 
Palatuldikan
PalatuldikanPalatuldikan
Palatuldikan
 
Pang-abay-na-Pamaraan.pptx
Pang-abay-na-Pamaraan.pptxPang-abay-na-Pamaraan.pptx
Pang-abay-na-Pamaraan.pptx
 
Filipino 9 DLL 3rd Quarter Week 5.docx
Filipino 9 DLL 3rd Quarter Week 5.docxFilipino 9 DLL 3rd Quarter Week 5.docx
Filipino 9 DLL 3rd Quarter Week 5.docx
 
Noli me tangere kabanata 16
Noli me tangere kabanata 16Noli me tangere kabanata 16
Noli me tangere kabanata 16
 
Panghalip (Kami, Kayo..)
Panghalip (Kami, Kayo..)Panghalip (Kami, Kayo..)
Panghalip (Kami, Kayo..)
 
Panitikan o literatura ng Rehiyon X
Panitikan o literatura ng Rehiyon XPanitikan o literatura ng Rehiyon X
Panitikan o literatura ng Rehiyon X
 
Fil 6 sanggunian
Fil 6   sanggunianFil 6   sanggunian
Fil 6 sanggunian
 
Banghay ng maikling kuwento
Banghay ng maikling kuwentoBanghay ng maikling kuwento
Banghay ng maikling kuwento
 
Maikling Kuwento ni Mabuti, gabay sa pagbasa
Maikling Kuwento ni Mabuti, gabay sa pagbasaMaikling Kuwento ni Mabuti, gabay sa pagbasa
Maikling Kuwento ni Mabuti, gabay sa pagbasa
 

Similar to Thesis incl. appendices

here-and-now-the-need-for-an-analytics-platform-110056.pdf
here-and-now-the-need-for-an-analytics-platform-110056.pdfhere-and-now-the-need-for-an-analytics-platform-110056.pdf
here-and-now-the-need-for-an-analytics-platform-110056.pdf
LuizBellato
 
Genpact_IPIE_an_analytics_foundation_v2
Genpact_IPIE_an_analytics_foundation_v2Genpact_IPIE_an_analytics_foundation_v2
Genpact_IPIE_an_analytics_foundation_v2
Growth Strategy Services, LLC.
 
Data analytics is a game changer for telcos in the digital era
Data analytics is a game changer for telcos in the digital eraData analytics is a game changer for telcos in the digital era
Data analytics is a game changer for telcos in the digital era
Flytxt
 
FASTER PROCESS DEVELOPMENT WITH HYBRID MODELING AND KNOWLEDGE TRANSFER
FASTER PROCESS DEVELOPMENT WITH HYBRID MODELING AND KNOWLEDGE TRANSFERFASTER PROCESS DEVELOPMENT WITH HYBRID MODELING AND KNOWLEDGE TRANSFER
FASTER PROCESS DEVELOPMENT WITH HYBRID MODELING AND KNOWLEDGE TRANSFER
iQHub
 
Advance with-analytics-guide-final
Advance with-analytics-guide-finalAdvance with-analytics-guide-final
Advance with-analytics-guide-final
erainbol
 
Putting Together the Pieces: Supply Chain Analytics - 2 SEP 2017
Putting Together the Pieces: Supply Chain Analytics - 2 SEP 2017Putting Together the Pieces: Supply Chain Analytics - 2 SEP 2017
Putting Together the Pieces: Supply Chain Analytics - 2 SEP 2017
Lora Cecere
 
Daniel UCT Technical Report
Daniel UCT Technical ReportDaniel UCT Technical Report
Daniel UCT Technical Report
Daniel Ackermann
 
ACTOR - "Il ruolo chiave degli Advanced Analytics per la Supply Chain. Intel...
ACTOR -  "Il ruolo chiave degli Advanced Analytics per la Supply Chain. Intel...ACTOR -  "Il ruolo chiave degli Advanced Analytics per la Supply Chain. Intel...
ACTOR - "Il ruolo chiave degli Advanced Analytics per la Supply Chain. Intel...
logisticaefficiente
 
Il ruolo chiave degli Advanced Analytics per la Supply Chain
Il ruolo chiave degli Advanced Analytics per la Supply ChainIl ruolo chiave degli Advanced Analytics per la Supply Chain
Il ruolo chiave degli Advanced Analytics per la Supply Chain
ACTOR
 
A Practical Approach for Power Utilities Seeking to Create Sustaining Busines...
A Practical Approach for Power Utilities Seeking to Create Sustaining Busines...A Practical Approach for Power Utilities Seeking to Create Sustaining Busines...
A Practical Approach for Power Utilities Seeking to Create Sustaining Busines...
Cognizant
 
Report- A knowledge based view of analytics capability in PSM.pptx
Report- A knowledge based view of analytics capability in PSM.pptxReport- A knowledge based view of analytics capability in PSM.pptx
Report- A knowledge based view of analytics capability in PSM.pptx
RimarkInhambre
 
Concept of Semantic Information Pool for manufacturing supply networks
Concept of Semantic Information Pool for manufacturing supply networksConcept of Semantic Information Pool for manufacturing supply networks
Concept of Semantic Information Pool for manufacturing supply networks
Milan Zdravković
 
Domains and data analytics
Domains and data analyticsDomains and data analytics
Domains and data analytics
Pratik Shukla
 
Comparative study of knowledge management and knowledge sharing culture in ph...
Comparative study of knowledge management and knowledge sharing culture in ph...Comparative study of knowledge management and knowledge sharing culture in ph...
Comparative study of knowledge management and knowledge sharing culture in ph...
jkgudaliya
 
Serialized Optimization Of Supply Chain Model Using Genetic Algorithm And Geo...
Serialized Optimization Of Supply Chain Model Using Genetic Algorithm And Geo...Serialized Optimization Of Supply Chain Model Using Genetic Algorithm And Geo...
Serialized Optimization Of Supply Chain Model Using Genetic Algorithm And Geo...
Jonathan Lobo
 
Advanced Operating Models Research Insights: Marketing
Advanced Operating Models  Research Insights: MarketingAdvanced Operating Models  Research Insights: Marketing
Advanced Operating Models Research Insights: Marketing
Genpact Ltd
 
supply chain risk management
supply chain risk managementsupply chain risk management
supply chain risk management
epoxyteam16
 
Evaluating the barriers for enhacing the utilization level of advanced manufa...
Evaluating the barriers for enhacing the utilization level of advanced manufa...Evaluating the barriers for enhacing the utilization level of advanced manufa...
Evaluating the barriers for enhacing the utilization level of advanced manufa...
IJERA Editor
 
Simplify Your Analytics Strategy
Simplify Your Analytics Strategy Simplify Your Analytics Strategy
Simplify Your Analytics Strategy
MEGHANA PONNURU
 
data-to-insight-to-action-taking-a-business-process-view-for-analytics-to-del...
data-to-insight-to-action-taking-a-business-process-view-for-analytics-to-del...data-to-insight-to-action-taking-a-business-process-view-for-analytics-to-del...
data-to-insight-to-action-taking-a-business-process-view-for-analytics-to-del...
Sokho TRINH
 

Similar to Thesis incl. appendices (20)

here-and-now-the-need-for-an-analytics-platform-110056.pdf
here-and-now-the-need-for-an-analytics-platform-110056.pdfhere-and-now-the-need-for-an-analytics-platform-110056.pdf
here-and-now-the-need-for-an-analytics-platform-110056.pdf
 
Genpact_IPIE_an_analytics_foundation_v2
Genpact_IPIE_an_analytics_foundation_v2Genpact_IPIE_an_analytics_foundation_v2
Genpact_IPIE_an_analytics_foundation_v2
 
Data analytics is a game changer for telcos in the digital era
Data analytics is a game changer for telcos in the digital eraData analytics is a game changer for telcos in the digital era
Data analytics is a game changer for telcos in the digital era
 
FASTER PROCESS DEVELOPMENT WITH HYBRID MODELING AND KNOWLEDGE TRANSFER
FASTER PROCESS DEVELOPMENT WITH HYBRID MODELING AND KNOWLEDGE TRANSFERFASTER PROCESS DEVELOPMENT WITH HYBRID MODELING AND KNOWLEDGE TRANSFER
FASTER PROCESS DEVELOPMENT WITH HYBRID MODELING AND KNOWLEDGE TRANSFER
 
Advance with-analytics-guide-final
Advance with-analytics-guide-finalAdvance with-analytics-guide-final
Advance with-analytics-guide-final
 
Putting Together the Pieces: Supply Chain Analytics - 2 SEP 2017
Putting Together the Pieces: Supply Chain Analytics - 2 SEP 2017Putting Together the Pieces: Supply Chain Analytics - 2 SEP 2017
Putting Together the Pieces: Supply Chain Analytics - 2 SEP 2017
 
Daniel UCT Technical Report
Daniel UCT Technical ReportDaniel UCT Technical Report
Daniel UCT Technical Report
 
ACTOR - "Il ruolo chiave degli Advanced Analytics per la Supply Chain. Intel...
ACTOR -  "Il ruolo chiave degli Advanced Analytics per la Supply Chain. Intel...ACTOR -  "Il ruolo chiave degli Advanced Analytics per la Supply Chain. Intel...
ACTOR - "Il ruolo chiave degli Advanced Analytics per la Supply Chain. Intel...
 
Il ruolo chiave degli Advanced Analytics per la Supply Chain
Il ruolo chiave degli Advanced Analytics per la Supply ChainIl ruolo chiave degli Advanced Analytics per la Supply Chain
Il ruolo chiave degli Advanced Analytics per la Supply Chain
 
A Practical Approach for Power Utilities Seeking to Create Sustaining Busines...
A Practical Approach for Power Utilities Seeking to Create Sustaining Busines...A Practical Approach for Power Utilities Seeking to Create Sustaining Busines...
A Practical Approach for Power Utilities Seeking to Create Sustaining Busines...
 
Report- A knowledge based view of analytics capability in PSM.pptx
Report- A knowledge based view of analytics capability in PSM.pptxReport- A knowledge based view of analytics capability in PSM.pptx
Report- A knowledge based view of analytics capability in PSM.pptx
 
Concept of Semantic Information Pool for manufacturing supply networks
Concept of Semantic Information Pool for manufacturing supply networksConcept of Semantic Information Pool for manufacturing supply networks
Concept of Semantic Information Pool for manufacturing supply networks
 
Domains and data analytics
Domains and data analyticsDomains and data analytics
Domains and data analytics
 
Comparative study of knowledge management and knowledge sharing culture in ph...
Comparative study of knowledge management and knowledge sharing culture in ph...Comparative study of knowledge management and knowledge sharing culture in ph...
Comparative study of knowledge management and knowledge sharing culture in ph...
 
Serialized Optimization Of Supply Chain Model Using Genetic Algorithm And Geo...
Serialized Optimization Of Supply Chain Model Using Genetic Algorithm And Geo...Serialized Optimization Of Supply Chain Model Using Genetic Algorithm And Geo...
Serialized Optimization Of Supply Chain Model Using Genetic Algorithm And Geo...
 
Advanced Operating Models Research Insights: Marketing
Advanced Operating Models  Research Insights: MarketingAdvanced Operating Models  Research Insights: Marketing
Advanced Operating Models Research Insights: Marketing
 
supply chain risk management
supply chain risk managementsupply chain risk management
supply chain risk management
 
Evaluating the barriers for enhacing the utilization level of advanced manufa...
Evaluating the barriers for enhacing the utilization level of advanced manufa...Evaluating the barriers for enhacing the utilization level of advanced manufa...
Evaluating the barriers for enhacing the utilization level of advanced manufa...
 
Simplify Your Analytics Strategy
Simplify Your Analytics Strategy Simplify Your Analytics Strategy
Simplify Your Analytics Strategy
 
data-to-insight-to-action-taking-a-business-process-view-for-analytics-to-del...
data-to-insight-to-action-taking-a-business-process-view-for-analytics-to-del...data-to-insight-to-action-taking-a-business-process-view-for-analytics-to-del...
data-to-insight-to-action-taking-a-business-process-view-for-analytics-to-del...
 

Thesis incl. appendices

  • 1. Abstract Background: The industrial introduction of additive manufacturing technologies (AMT) in direct processing activities of finished goods have by many been called a hype as its longstanding area of purpose have been limited to prototyping activities innew product development. However, muchindicate that the performance capabilities of AMT has reached a certain point in its technological maturity, in which may allow for strategic capitalization of manufacturing organizations as a viable adoption-alternative. Purpose: This thesis provides a preliminary adoptiondecisiontool for managers exploringthe potential of industrial additive manufacturing (AM). Through explanation of contemporary performance capabilities of various AMT processes, it aims to pinpoint the contemporary areas of application and future direction of strategic purpose by reconciling these findings with theoretical concepts. Methodology: As the novelty and potential disruptive force of the process technology not necessarily provideda fit with pure positivist and/or interpretivist research paradigms, a pragmatic, mixed methods approach was chosen. Hence, abductive reasoning, allowing the researcher to “fill in the blanks” with observations from the empirical reality and match these with concepts from theory, was chosen. Results: Based on a comparative performance capability analysis utilizingfive generic performance objectives, and an analysis of AMT systems manufacturing, and business strategic boundaries, this thesis suggests contemporary viability of AM in high flexibility oriented manufacturing environments where requirements for low-medium volumes of production, and highly complex and customized parts are prevalent conditions. Moreover, the thesis propose that contemporary viability of AM is closely linkedwithtechnology maturity, and the results point to a proposition that when AM is proven ready for mass-adoption, established theorems within manufacturing and supply chain operations must be taken under advisement for reconsiderations. Conclusions: In line with predicted advances in technology maturity, the thesis further propose a development trend of system typology from intermittent systems to concurrent systems. This shift suggests anexpansionof the purpose boundaries for strategic areas of application. It is further suggestedthat these advances holdthe potential to support a new, more sustainable manufacturing operations and supply chain paradigm without compromising the ability to achieve cost efficiency. 1
  • 2. Acknowledgements This section is dedicated to those who have helped and inspired me to finish this milestone achievement of my academic journey. Without you, I could not have made it. First, I would like to offer my eternal gratitude to Juliana Hsuan, my supervisor, mentor, andfriendthroughout this journey. Without your brilliant expertise and motivating encouragement the journey would not have been as rewarding as it has. Thank you, Juliana. Second, I would like to thank my family for their support and belief in my ability to thrive on this journey by myself. Special thanks to my Mom, Dad, Tore, Grandmother Martha, and Grandfather Kåre for all your love and support. Third, I would like to thank my friends and classmates for your guidance, encouragement and insight in situations where a third eye was needed to move forward. You all know who you are, thank you. Special thanks to Jørgen, who helped be with the formalities before handing in. Last, but not least I would like to offer a special thanks to my girlfriend Lotte. Your patience, encouragement, overwhelming kindness and belief in me has guided me through this process. Thank you, Lotte. Abbreviations Terms Abbreviation Explanation 3DP Three-dimensional printing AM Additive Manufacturing AMT Additive Manufacturing Technologies BB Research Building Block(s) CAD Computer-aided Design CAGR Compound Annual Growth CAM Computer-aided Manufacturing CNC Computerized-Numerically Controlled Machine Automation ERP Enterprise Resource Planning IPR Intellectual Property Rights MO Manufacturing Organization(s) NPD New Product Development PO Performance Objective(s) PT Process Technology(ies) R&D Research & Development RBV Resource-based View RFID Radio Frequency Identification S&OP Sales & Operations Planning SC Supply Chain(s) SCM Supply Chain Management SL Stereolithography TM Traditional Manufacturing TMT Traditional Manufacturing Technologies 2
  • 3. Table of Contents ABSTRACT..........................................................................................................................................................................1 ACKNOWLEDGEMENTS......................................................................................................................................................2 ABBREVIATIONS ................................................................................................................................................................2 TABLE OF CONTENTS .........................................................................................................................................................3 TABLE OF FIGURES.............................................................................................................................................................6 1.0 INTRODUCTION ...........................................................................................................................................................8 1.1 BACKGROUND......................................................................................................................................................................8 1.1.2 Introduction to 3D Printing & Additive Manufacturing............................................................................................8 1.2 PROBLEM DISCUSSION...........................................................................................................................................................9 1.2.1 Developments in Macro-trends................................................................................................................................9 1.2.2 Challenges in the Current Manufacturing Operations & Supply Chain Paradigm………………………………………........10 1.3 THESIS PURPOSE ................................................................................................................................................................11 1.4 RESEARCH GAP & THESIS STRUCTURE.....................................................................................................................................12 1.5 DELIMITATIONS..................................................................................................................................................................12 2.0 RESEARCH FRAMEWORK............................................................................................................................................13 2.1 CONCEPTUAL RESEARCH FRAMEWORK....................................................................................................................................13 2.1.1 Block 1: Market Outlook & Technology Readiness.................................................................................................13 2.1.2 Building Block 2: Technology Features & Performance Capabilities ......................................................................14 2.1.3 Building Block 3: AM Strategic Purpose & Paradigmatic Appropriateness............................................................14 2.1.4 Building Block 4 Discussion: Operations & Supply Chain Performance..................................................................14 2.2 CHOICE OF THEORY.............................................................................................................................................................14 3.0 LITERATURE REVIEW..................................................................................................................................................15 3.1 GENERAL BUSINESS STRATEGY VS. OPERATIONS STRATEGY .........................................................................................................15 3.2 MANUFACTURING STRATEGY ................................................................................................................................................16 3.2.1 Scope and Definitions.............................................................................................................................................16 3.2.2 The Strategic Choice Paradigm ..............................................................................................................................16 3.3 MANUFACTURING STRATEGY TYPOLOGIES...............................................................................................................................18 3.3.1 Typologies of Generic Business Strategy & Manufacturing Strategy.....................................................................18 3.3.2 The Relationship between Generic Business Strategy &Manufacturing Strategy..................................................19 3.3.3 Primary Dimensions & Underlying Variables of Manufacturing Strategy..............................................................20 3.4 ACCOMMODATING TYPOLOGIES FOR PROCESS-TECHNOLOGY STRATEGY IN MANUFACTURING...........................................................22 3.4.1 Technical Complexity & Technical Flexibility..........................................................................................................22 3.5 MANUFACTURING & OPERATIONS PERFORMANCE....................................................................................................................23 3.5.1 Generic Performance Objectives............................................................................................................................23 3
  • 4. 4.0 METHODOLOGY.........................................................................................................................................................26 4.1 THE NATURE OF BUSINESS RESEARCH.....................................................................................................................................26 4.2 PHILOSOPHICAL PARADIGMS & CONSTITUENTS OF SCIENTIFIC RESEARCH ......................................................................................26 4.2.1 Philosophical Paradigms in Research.....................................................................................................................26 4.2.2 Knowledge claims...................................................................................................................................................27 4.2.3 Research Strategies................................................................................................................................................27 4.3 Thesis Knowledge Claims ..........................................................................................................................................28 4.4 THE DYNAMIC RESEARCH PROCESS ........................................................................................................................................30 4.4.1 Conceptual Framework ..........................................................................................................................................31 4.4.2 Conceptual Literature – Theoretical Frame of Reference vs. the Empirical World – Evidence from Reality ..........31 4.4.3 Matching................................................................................................................................................................31 4.5 RESEARCH APPROACHES & RELATED RESEARCH STRATEGIES .......................................................................................................32 4.5.1. Building-block 1 – Market Outlook & Technology Readiness................................................................................32 4.5.2 Building-block 2 – Technology Performance Capabilities.......................................................................................32 4.5.3 Building-block 3 – Strategic Focus & Paradigmatic Appropriateness ....................................................................32 4.5.4 Building-block 4 – Strategic and Performance Implications for Operations & Supply Chains................................32 4.6 DATA SOURCES & DATA COLLECTION STRATEGY.......................................................................................................................33 4.6.1 Data Sources – Primary vs. Secondary Data ..........................................................................................................33 4.6.2 Data Collection Strategy ........................................................................................................................................33 4.7 OPERATIONALIZATION TABLES & METHODS OF ANALYSIS...........................................................................................................35 4.7.1 Building Block 2 –Process Technology Performance & Operational Capabilities...................................................35 4.8 Building Block 3 –Process Technological Manufacturing and Business Strategic Mapping......................................37 4.8.1 Building Block 4 – Operations & Supply Chain Strategy and Performance Discussion...........................................38 4.9 RESEARCH LIMITATIONS.......................................................................................................................................................38 4.10 PRESENTATION OF DATA & FINDINGS...................................................................................................................................38 5.0 PRESENTATION OF DATA & FINDINGS........................................................................................................................39 5.1 BUILDING-BLOCK 1: TECHNOLOGY & MARKET OVERVIEW..........................................................................................................39 5.2 3DP/AM PROCESS TECHNOLOGY OVERVIEW ..........................................................................................................................39 5.2.1 The Nature of Additive Manufacturing ..................................................................................................................39 5.2.2 3DP/AM Technology Definitions ............................................................................................................................39 5.2.3 Different Purposes of ALM Process Technologies ..................................................................................................39 5.3 SYSTEM CLASSIFICATION FOR DIFFERENT 3DP/AM PROCESSES...................................................................................................40 5.3.1 Process Technologies for Industrial Application.....................................................................................................41 5.3.2 Materials for Industrial Application .......................................................................................................................41 5.4 CURRENT STATE OF 3DP/AM INDUSTRY AND MARKET OVERVIEW ..............................................................................................41 5.4.1 Market Trends & Developments (Check for double statements in numbers).........................................................41 5.4.2 Public Initiatives facilitating Industry Growth........................................................................................................42 5.4.3 3D Printing Industry Value Chain ...........................................................................................................................42 5.4.4 Additive Manufacturing – Technology Life Cycle Assessment................................................................................43 5.5 FUTURE INDUSTRY OUTLOOK ................................................................................................................................................44 5.5.1 Technology Maturity Cycle.....................................................................................................................................44 5.5.2 Academic Research Contributions and Cooperative Initiatives Driving Development ...........................................44 5.5.3 Industry Development in Numbers.........................................................................................................................44 4
  • 5. 5.5.4 Challenges & Skepticism ........................................................................................................................................45 5.6 BUILDING-BLOCK 2: PROCESS TECHNOLOGY PERFORMANCE & CAPABILITIES .................................................................................46 5.6.1 Comparative Frame of Reference...........................................................................................................................46 5.7 QUALITY PERFORMANCE......................................................................................................................................................46 5.8 PRODUCT QUALITIES ...........................................................................................................................................................47 5.8.1 Geometric Properties .............................................................................................................................................47 5.8.2 Mechanical Properties............................................................................................................................................48 5.8.3 Physical Properties .................................................................................................................................................49 5.9 PROCESS SPEED..................................................................................................................................................................50 5.9.1 Processing Speed –Build Rates...............................................................................................................................50 5.9.2 Set-up & Post-processing time ...............................................................................................................................50 5.10 COST EFFICIENCY..............................................................................................................................................................51 5.10.1 Material Costs ......................................................................................................................................................52 5.10.3 Machine Energy Consumption .............................................................................................................................55 5.10.4 Labor Costs...........................................................................................................................................................56 5.11 FLEXIBILITY......................................................................................................................................................................56 5.11.1 Product Flexibility.................................................................................................................................................56 5.11.2 Mix Flexibility .......................................................................................................................................................57 5.11.3 Volume Flexibility .................................................................................................................................................58 5.12 Dependability ..........................................................................................................................................................59 5.13 BUILDING-BLOCK 3: STRATEGIC PURPOSE & PARADIGMATIC APPROPRIATENESS...........................................................................60 5.13.1 Aerospace.............................................................................................................................................................60 5.13.2 Automotive...........................................................................................................................................................61 5.13.3 Medical.................................................................................................................................................................61 5.13.4 Consumer Goods ..................................................................................................................................................61 6.0 ANALYSIS & DISCUSSION OF FINDINGS ......................................................................................................................62 6.1 BUILDING-BLOCK 2: PROCESS TECHNOLOGY PERFORMANCE & CAPABILITY ANALYSIS ......................................................................62 6.1.1 Quality....................................................................................................................................................................62 6.1.2 Speed/Time ............................................................................................................................................................64 6.1.3 Cost Efficiency Performance...................................................................................................................................64 6.1.4 Flexibility Performance...........................................................................................................................................67 6.1.5 Dependability Performance....................................................................................................................................69 6.1.6 Summary of Results for Building-block 2: Analysis.................................................................................................70 6.1.7 Concluding Implications from BB-2 Analysis ..........................................................................................................71 6.2 BUILDING BLOCK 3 – STRATEGIC PURPOSE & PARADIGMATIC APPROPRIATENESS............................................................................71 6.2.1 Analysis of Manufacturing System Classification of AM........................................................................................72 6.2.2 Analysis of Appropriate Manufacturing & Business Strategic “fit”........................................................................72 6.2.3 Concluding Implications from building-block 3 – Analysis .....................................................................................74 6.3 BUILDING-BLOCK 4: DISCUSSION ON IMPLICATIONS FOR AM-ADAPTED SUPPLY CHAINS..........................................75 6.3.1 The Re-distribution of Manufacturing....................................................................................................................75 6.3.2 Performance Implications for Re-distributing the Geographical Landscape of Manufacturing.............................76 6.3.3 Impact on Cost Performance..................................................................................................................................77 5
  • 6. 6.4 Supply Chain Design & Configuration Strategies ......................................................................................................78 6.5 Concluding implications from BB4-Discussion...........................................................................................................79 7.0 CONCLUSIONS............................................................................................................................................................80 7.1 ADDITIONAL CONSIDERATIONS & FUTURE RESEARCH PROPOSALS ................................................................................................83 7.2 CLOSING REMARKS .............................................................................................................................................................84 8.0 LIST OF REFERENCES ..................................................................................................................................................85 9.0 TABLE OF APPENDICES...............................................................................................................................................98 Table of Figures Figure 1 – Conceptual research framework of the thesis. Source: Own construction........................................... 13 Figure 2 – Strategic ambition and operational reality. Source: own creation, Inspired by Paton et al, 2011, p.380. ............................................................................................................................................................................... 15 Figure 3 – Generic manufacturing Strategies. Own creation, adapted from Kim & Lee, 1993 p. 9. ..................... 19 Figure 4 – A synthesized strategic framework: a conceptual representation. Source: Own creation, adapted from Kotha & Orne, 1989, p. 225. .................................................................................................................................. 21 Figure 5 – Typology of Production systems & practical examples- Own creation, adapted from Kim & Lee, 1993, p. 6-7...................................................................................................................................................................... 22 Figure 6 – Differences between deductive and inductive reasoning in research. Own creation, inspired by Bryman & Bell, 2015, p. 23.................................................................................................................................... 28 Figure 7 – Dynamics of the research process. Source: Own creation, adapted and configured from Dubois & Gadde, 2002, p. 555............................................................................................................................................... 30 Figure 8 – Value of the AM/3DP market worldwide from 2011-2014. Own creation, adapted from Wohlers Associates (2013, 2015)......................................................................................................................................... 41 Figure 9 – 3D Printing Industry value chain. Source: Own creation, inspired by Business insider 2012, Marketline 2013, and Frost & .................................................................................................................................................. 42 Figure 10 – Technology adoption Life Cycle. Own creation, adapted from Rogers 1995, and Moore 2007, – as illustrated in Mellor, 2015, p. 20. .......................................................................................................................... 43 Figure 11 – Hype cycle for emerging technologies. Source: Gartner Inc., 2015.................................................... 44 Figure 12 – Quality Control Measurement Procedures for AM. Source: Own creation, adapted from Mani et al, 2015, p. 3............................................................................................................................................................... 46 Figure 13 – Cost model comparison. Source: Own creation, adapted from Hopkinson & Dickens, 2003, p. 38. .. 51 Figure 14a – The energy breakdown comparison for IM and SLS fabricated paintball handle. Source Telenko & Seepersad, 2012, p. 477......................................................................................................................................... 55 Figure 14b – The energy breakdown comparison for IM and SLS fabricated paintball handle including mold production. Source Telenko & Seepersad, 2012, p. 477. ....................................................................................... 55 Figure 15 – The relationships between costs vs. complexity for AM vs. TM. Source: Own creation, adapted from Conner et al., 2014, p. 71....................................................................................................................................... 57 Figure 16a – Shop floor process flow for AM systems. Source: Own creation, adapted from Lee, 2013.............. 57 6
  • 7. Figure 16b – Shop floor process flow for AM systems. Source: Own creation, adapted from Lee, 2013.............. 57 Figure 17a - Output volume comparison AM vs. PIM. Source: Atzeni et al., 2010, p. 315.................................... 58 Figure 17b - Output volume comparison AM vs.HPDC. Source: Atzeni & Salmi 2012, p.1154.............................. 58 Figure 18 - AM industrial application based on AM service provider industry revenue generation in 2014. Source: own creation, adapted from Wohlers, 2014. ........................................................................................................ 60 Figure 19 – Radar diagram of contemporary in performance capabilities between AM vs. TM. Source: Own creation.................................................................................................................................................................. 70 Figure 20a – Analysis of AM typological system classification. Source: Based on the proposed Typology by Kim & Lee, 1993................................................................................................................................................................ 72 Figure 20b – Analysis of AM typological system classification compared with other systems. Source: Based on the proposed typology by Kim & Lee, 1993........................................................................................................... 72 Figure 21 – Different strategic scenarios for AM in between different industries. Source: Own creation, conceptual typologies adopted from Kim & Lee, 1993 and Porter 1980............................................................... 73 Figure 22 – Contemporary & future manufacturing & business strategic scenario for AM. Source: Own creation, conceptual typologies adopted from Kim & Lee, 1993 and Porter 1980............................................................... 74 Figure 23a – Digital supply chain scenario. Source: Own creation, adapted from Lee, 2013. .............................. 76 Figure 23b – Conventional Supply Chain Scenario. Source: Own creation, adapted from Lee, 2013.................... 76 Figure 24a – Lead times for AM scenario. Source: Mashhddi et al., 2015, p 8. .................................................... 76 Figure 24b – Lead times for TM scenario. Source: Mashhddi et al., 2015, p 8...................................................... 76 Figure 25 - Net benefit comparison of traditional vs. digital manufacturing supply chain. Own creation, adapted from Lee, 2013....................................................................................................................................................... 77 Figure 26 – New supply chain pipeline selection paradigm. Source: Own creation, a revised version of the original by Christopher et al., 2006, p. 9. .............................................................................................................. 78 Figure 27 - Strategic roadmap for AM purpose boundaries. Source: own creation, inspired and adapted from Kotha & Orne (1989).............................................................................................................................................. 79 Figure 28 – Updated conceptual framework including key determinants for each building block. Source: Own creation.................................................................................................................................................................. 80 7
  • 8. 1.0 Introduction 1.1 Background In the wake of the emerging global challenges addressed by keynote speaker Tom Goldsby at the 5th Copenhagen SCM summit in 2013, there were several key takeaways that inspired this thesis to explore sustainable operational solutions that shapes the future of manufacturing operations and supply chain management (SCM). Among the many challenges that increasing pressures from macro trends, represented by major socio-economic forces and developments such as continued population growth and migration, rising economies’ growing buying power, resource scarcity, and environmental climate change pose in shaping the future global business environment, underline the fundamental need for manufacturing process innovation – defined as the steps and activities in the improvement of the concurrent organizational processes and practices (Patton et al., 2011). In the quest of meeting these challenges, the ever-increasing importance of technological innovation such as integrated IT-solutions in daily operations cannot be underestimated as the emergence of computer-aided- manufacturing (CAM), Enterprise Resource Planning(ERP) systems, Radio Frequency Identification(RFID) chips, just to mention a few, are testaments to the revolutionary impact on the manner in which organizations manage their operations to cope with the emerging macro-challenges. In that sense, the enabling impact of technology has become a strategically important weapon that ensures continuous flow of value creation for its customers, and further aid organizations to meet their goals (Ibid). One can therefore argue that successful employment of operational innovation in manufacturing organizations (MO) should be considered a key success factor in meeting these challenges in a sustainable and competitive manner (SCM Summit, 2013). In addition, companies that adapt and grow through innovation, will therefore be winners in a future paradigm characterized by enduring structural shifts that will set the business agenda for the foreseeable future (Bain, 2011 p. 3). 1.1.2 Introduction to 3D Printing & Additive Manufacturing 3D-Printing (3DP) or Additive Manufacturing (AM) holds many of the key features of a manufacturing process- technology-innovation that may possibly even trigger a paradigm innovation that has the potential to facilitate a new supply chain strategies, and even: (…) change how companies frame what they do (Patton et al., 2011). Ever since being introduced as the influx to the third industrial revolution back in 2012 (The Economist, 2012), the publicity surrounding3D printing(3DP), Additive Manufacturing(AM), RapidPrototyping(RP), RapidManufacturing (RM) or Stereolithography (SL) – as it initially was namedby the founder of the first RP technology, Charles Hull who filed his patent in 1984 and later went on to found what is now considered the market leading systems provider, 3D Systems in 1986 – has sky-rocketed, leadingto anexplosioninthe fieldof researchonthe technology’s potential in terms of industrial application and on the future implications it may have on - and within multiple areas of production and manufacturing industries (Price, 2012). 8
  • 9. Regardless of what can be described as quantum leaps in 3DP/AM technological advancements the last decade, there have been conflicting opinions among scholars and industry experts with regards to the maturity rate of AM, and more importantly its viability and readiness to be applied in direct manufacturing of finished goods (Berman, 2012). 1.2 Problem Discussion The following problem discussion is structured into sequential sub-sections of contemporary issues andchallenges that have motivated this thesis. Each sub-section constitutes a natural phenomenological order inwhichthe causal relationship between them is discussed. First, contemporary macro-trends will be addressed and discussed (the macro-external phenomenological problem), followed by the implications these macro-trends pose for manufacturing, operations and supply chains of organizations (the internal phenomenological problem), before the discussion will end with a brief introduction to the proposed implications of the thesis topic of industrial additive manufacturing (the potential solution). 1.2.1 Developments in Macro-trends As the global economy has accelerated during the last couple of decades, creatinga global economic system where globalization – understood as and characterized by Holton (2005) as the : (1) rising exchange of people, goods, information, values and habits, (2) an increased degree of interdependence between national and regional economies, and (3) a rising awareness that the world is made up of a closed system with a certain amount of resources in which needs divided in a sustainable way to avoid risks of wide-scale consequences (as notedinHesse & Rodrigue, 2006 p.1) – has been the key drivers for the development of a globally integrated marketplace. There are particularly three macro-trend developments that pose challenges for the manner in which organizations employ and utilize their pool of resources. 1.2.1.1 Globalization and global population growth There is a general consensus that global population growth will pose a major challenge for the global community in the near future. According to the most recent development report on forecasted population growthby the United Nations (appendix 1), the world population reached 7.3 billion in 2015, in which imply a growth of 1 billion people only during the last 12 years. As most populationgrowthwill come from developingandemergingeconomies (Bain, 2011), new market opportunities will rise as increased buying power among the worlds most populated emerging economies. 1.2.1.2 Urbanization & growing middle-class in emerging economies Urbanization and expanding prosperity in emerging economies will see leading industries shift their focus from advanced markets to developing ones (Bain, 2011; McKinsey, 2013). As most consumption occurs in cities (Rodrigue, 2012), traditional geopolitical and economic powerhouses such as London and New York will see themselves surpassed in terms of consumption, as buying power in emerging and developing economies will represent a larger share of global consumption (appendix 1). Simultaneous population and urbanizationgrowthin developing markets such Brazil and the MINT countries; Mexico, Indonesia, Nigeria and Turkey in which according to Goldman Sachs’ head of economic research Jim O’neill will have the potential economic and demographic landscape to shape and further dominate the future of consumption (Business insider, 2013). 9
  • 10. 1.2.1.3 Resource Scarcity & Environmental Change Resource scarcity and environmental change has become a major challenge for the global community, with potential developments such as scarcity of essential natural resources vital to the very existence of life becominga real threat. Consequently, external legislative pressures from international political institutions such as new long term oriented environmental sustainability initiatives exemplified by the Obama administrations “Clean Power Plan” that aims to reduce carbon emissions from U.S. power plants to 32% below the registered 2005 levels by the year 2030 (epa.gov, 2015), may very well mark the beginning of an era where political institutions actively participates in an effort of increased focus on global resource scarcity and environmental sustainability, as fossil fuels still remains the primary energy source inthe highest final energy-consumingtransport sector (Kojima & Ryan, 2010), the necessity for innovative solutions can not be underestimated. 1.2.2 Challenges in the Current Manufacturing Operations & Supply Chain Paradigm The above-mentioned Macro-trend developments all pose major challenges for international operations management and global supply chains defined as: “a minimum of 3 supply chain actors dispersed in different locations of the world, involved in sequential value creation activities” (Mentzer, et.al, 2001; Stabell & Fjeldstadt, 1998, as cited in slides by Aseem Kinra in; managing global supply chains course). Due to the rapid integration of global markets enabled by the internet eras partial erasing of cultural borders for goods and services, evidential patterns and trends suggest an increased disintegration of production and manufacturing, meaninga phenomenoninwhichwhere organizations findit beneficial to outsource non-core value adding activities resulting incross-border physical separationof different parts of the productionprocess (Feenstra, 1998, Arndt & Kierzkowski, 2001).For instance, predicted forecasts on productionand manufacturing outsourcing suggests that by the year 2020, 80 % of all goods in the world will be manufactured in a country different from where they are consumed, compared with 20 % in the year the report was presented (Balou, 2007). Thus, by adding up these macro-trends, a lot of indicators suggesting that manufacturers are now faced with a paradox when trying to balance traditional location-specific advantages such as the access to cheaper factors of production (Dunning, 2001; Guisinger, 2001) found for instance in Asia, with the ability to meet demand and flexibility requirements for new product introductions in a time-to-market sense, that satisfy the ever-increasing time-sensitive customers as for instance found in the fashion and apparel industry (Christopher et.al, 2006). Doing all of this, while simultaneously satisfying what is considered every supply chains objective; profit maximization (Manuj & Mentzer, 2008), leave MO´s in a situation where trade-offs in focus is becoming an increasingly difficult task. 1.2.2.1 The Manufacturing & Operational Challenge Paton et al (2011) propose the following external factors as drivers of innovation that enhance internal efficiency: 1. Increased competition: in cost and quality due to increasedglobal competition, posingchallenges for ever- increasing standards of performance requirements 2. Increasing complexity: through the dynamics of customer pull – meaning increased demand for differentiated, customized and functional products and technology push – meaning the ability of R&D to continuously create more sophisticated products that conforms to the customer pull. 10
  • 11. 3. Increased focus on sustainability:suchas environmental issues, labor exploitation, tighter political policies related to factory pollution and carbon emission fee programs impacting the transport economy. Putting the external factors into the equation, underlines the importance of the MO´s ability to design processes that: “produce the greatest output for the least input” (Paton et al., 2011 p. 4). 1.2.2.2 The Industrial Emergence of Additive Manufacturing The driving characteristics of 3DP/AM that have spurred enthusiasm among industry experts as the most exciting disruptive process technology (PT) in manufacturing, is derived from its ability to provide almost unconstrained design freedom for the user. The computerized technology software applied in 3DP/AM known as 3-dimensional computer-aided design (3D-CAD) is only limited by physical attributes of materials available for the printer system, allowing almost unconstrained geometrical flexibility (Gibson et al., 2010; Holmström et al., 2010). Regardless of the fascinating future prospects of 3DP/AM as a method of Direct Digital Manufacturing(DDM) may hold, the existing consensus among researchers and industry experts alike, is that AM is not yet ready for mass adoption due to the technology’s inability to support high-volume production of end-use products (AM Platform, 2014). That being claimed, industry reports indicate that companies are already exploring the technology to a greater extent than what is being expressed (Deloitte, 2015). For instance, it is arguedthat by 2019, 10% of discrete manufacturers will apply 3DP/AM in their part-manufacturing operations (Gartner, 2015). 1.3 Thesis Purpose Based on the above discussion, the purpose of this thesis to provide a preliminary decision-making tool for managers that are exploring the potential impact, implications anddisruptive force embeddedinthe emergence of industrial AM. The manner, in which the author goes about this task, is throughidentificationandaddressingof key adoption determinants that stimulate the decision process. The thesis further has both academic and practical implications through the four following focus points: (1) Technology & market overview: Identification of challenges and opportunities of AM through an exploratory market analysis. (2) Technology performance & capabilities: Identification of the contemporary performance capabilities of AMT on a conversion process basis. (3) Strategic focus & paradigmatic fit: Identification of current purpose areas and strategic fit withregards to the following levels of strategic influence: (1) manufacturing operations, (2) general business, and supply chain strategic orientations. (4) Implications for operations & supply chains: Identificationof managerial implications and impact that AM may have on operations and supply chain performance. 11
  • 12. 1.4 Research Gap & Thesis Structure The research gap of this thesis is defined by the author’s acknowledgement of the importance of systemsthinking in managerial decision-making and operations management, characterized by a holistic approach to process- oriented optimization of internal cross-functional business processes. Thus, the research gap is guided by communication of the potential impact of AM on system properties, as it is assumed that provision of better understanding of process improvement is integral to operational efficiency as: “all business processes and operations are systems” (Paton et al., 2011, p. 171). This implies that the research gap and structure of the thesis follows a reversed sequential order to that found in the problem discussion, simultaneously recognizing the importance of the resource-based view (RBV) originally proposed by Penrose (1959). According to the RBV, everything that happens inside the organization is just as significant as what is happening on the outside (Paton et al., 2011). Thus, the logical vantage point of the thesis is clarification and assessment of AM characteristics, features and capabilities, referred to in this context as the manufacturing & operational solution – involving optimal utilization of organizational resources. The internal phenomenological consequence is two-folded. First, this thesis explore the degree to which internal capabilities, organizational processes, and firm attributes may be influenced by AM adoption. Second, it aims to identify which manufacturing environments that are more supportive of the adoption-decision. Finally, the external phenomenological consequence look at how the general disruptive characteristics of AM may influence the manner in which organizations manage their supply chain activities. 1.5 Delimitations Drawing on the notion by Voss (1986, 1988), this thesis distinguishbetweenadoptiondecisions andimplementation of industrial systems. While adoption decisions is more strategically oriented and concerned with mapping of the impact of that an adoption decision may have on current operational processes, the implementation process is more concerned with: “early usage activities immediately followingthe decisiontoadopt aninnovationandending when the use of innovation becomes routine practice” (Meyers et al., 1999, p.297). This thesis is dedicated to explore the former. 12
  • 13. 2.0 Research Framework This thesis takes a multi-dimensional holistic approach to answering of the following driving research question: “What are the most important considerations and key determinants for industrial AM adoption?” 2.1 Conceptual Research Framework In order to answer the driving research question, a thorough multi-disciplinary research proposal is necessary to explore potential capabilities and impact of AM. This section presents the conceptual framework in which the research departures from.The framework consists of four sequential “building blocks” (BB), in whichserves as the guiding structure in answering the main research question. These four blocks further provide a categorical visualization of the main constituent areas of the conducted research. Figure 1 – Conceptual research framework of the thesis. Source: Own construction. The proposed multi-dimensional framework illustrated above involve both internal and external decision- influencing factors, requiring utilization of trans-disciplinary data sources, empiric evidence from existingresearch and peer-reviewed literature from an extensive body of academic journals. The following building block are considered most important to explore when considering adoption of AMT´s. 2.1.1 Block 1: Market Outlook & Technology Readiness In order to make strategic adoption decisions with regards to choice of PT, it is considered important to gain preliminary understanding of the technology´s maturity and readiness through a careful exploratory assessment and monitoring of technology – and market developments. This sectiontherefore takes anexploratory approachin order to identify patter of opportunities and challenges noted by academics, practitioners andindustry specialists. Main Research Question: What are the the most important considerations and key determinants for industrial AM adoption? Building-block 1: Technology &Market Overview Building-block 2: Process-Technology Performance & Process Capabilities Building-block 3: Strategic Purpose & Paradigmatic Appropriateness Building-block 4: Operations & Supply Chain Implications 13
  • 14. In addition, the investigation of historical and topical growth indicators will be looked at to assess the predicted future outlook for the industry. 2.1.2 Building Block 2: Technology Features & Performance Capabilities In line with the proposition by Kim & Lee (1993), it is assumed that identification of distinguishingcharacteristics of manufacturing technologies is of high importance in the adoption decision process. Hence, identifying these characteristics, features and performance capabilities for AM, is considered a key determinant for adoption. It is further proposed that that an analysis of a new PT’s potential value or worth can be identifiedthrough: “exploring, understanding and describing the strategic consequences of adopting alternatives” (Slack & Lewis 2011, p. 201). Therefore, an investigation of the ability of AM to conform to the same processing standards set by traditional manufacturing technologies (TMT) on a conversion process level is considered an important constituent for AM adoption. 2.1.3 Building Block 3: AM Strategic Purpose & Paradigmatic Appropriateness As operations can be described as: “the engine that drives the business” (Paton et al., 2011, p. 53), in which where operations strategy constitutes the long-term guidelines, the PT’s fit withoverall business - andoperations strategy is considered an important determinant in the adoption-decision process. Hence, the knowledge andinsight found in BB-1 and BB-2 with regards to AM´s distinguishing features, characteristics, technology readiness and conversion-process performance capabilities, will coupledwithobservations oncontemporary areas of application to determine the strategic conditions under which AM adoption is most viable. 2.1.4 Building Block 4 Discussion: Operations & Supply Chain Performance It is assumed that the potential positive impact on operations and supply chain performance constitutes the ultimate key adoption determinant of a new manufacturing system. Hence, this section investigates the extent to which AM may impact the current paradigm of supply chain strategy and performance. 2.2 Choice of Theory According to Strauss & Corbin (1990) the researcher’s choice of theoretical frameworks applied in the respective research project, are dependent on the nature and purpose of the research. For instance, in confirmatory studies, literature may involve conceptual frameworks, in which aid in identification of “important variables, suggest relationships among them, and direct interpretation of findings” (Dubois & Gadde, 2002, p. 559). Conversely, theory-generating studies aim to discover new dimensions of a phenomenon. Hence, existing theory must be viewed under scrutiny of the novel findings. Strauss & Corbin(1990) claim that the manner, inwhichthe researcher approaches the latter, is less constrained. As theoretical frameworks is supposedto drive the answeringof the proposedresearchquestion(s), the preliminary literary framework for this thesis draws upon well-established concepts derived from operations, manufacturing and process-technology strategy. The most important contributors within each area are illustrated in table 1. 14
  • 15. Theoretical Concepts Authors General business strategies Porter (1980, 1985) Manufacturing operations strategies Woodward (1958, 1965), Skinner (1969), Hayes & Weelwright (1984), Kotha & Orne (1989), Platts & Gregory (1992), Miller & Roth (1994) Operations Strategy Paton et al (2011), Slack & Lewis (2011) Operations performance dimensions Paton et al (2011), Slack & Lewis (2011) Table 1 – Overview of driving contributions & authors from the literature review. Source: Own creation. 3.0 Literature Review This section of the thesis includes the introduction of different theoretical concepts driving the thesis. In addition, the literature presented forms the basis for each of the identified BB in the conceptual framework foundinsection 2.1. Each BB – with the exception of BB-1, in which is restricted to explorationanddescription– has its ownspecific theoretical literature that holds relevance in answering of the main-research question. 3.1 General Business Strategy vs. Operations Strategy Figure 2 – Strategic ambition and operational reality. Source: own creation, Inspired by Paton et al, 2011, p.380. Paton et al (2011) defines operations management (OM) as: “the activity of managing the resources of the organization that delivers goods and services”. Further, Hayes (2005) argues that efficient OM is followed by an effective operations strategy andmust support corporate strategy inorder to contribute to competitive advantage. There are three generally acknowledged levels in which strategies are formulated within an organization. These include: (1) the corporate level – in which where strategic guiding principles of value creation, unique to the individual organization is defined (2) business level – in which where strategic goals and objectives related to the competition basis of a specific business unit within its specific industry is defined, and (3) function level – in which relates to how individual functions such as operations, marketing, finance, etc. creates a plan of action (Barnes, 2008; Paton et al, 2011). (1) Corporate: Top management Mission Values Policies Competitive basis Vision (2) Corporate: Success Criteria Goals Strategies (3) Business unit: Strategic conditions (4) Business unit: Mission Policies specific to divisions Competition basis Vision (5) Function: Objectives Success criteria Strategies Projects (6) Function: Operational action plan Financial plan 15
  • 16. 3.2 Manufacturing Strategy Operations strategy is concernedwithsuccessful management of resource capabilities that meets the requirements of the market, and the manner in which organizations deploys and utilizes its resources, is further dependent onits ability to: “successfully pursue specific performance objectives” characterized as: “(…) criterions against which to evaluate the performance of operations”(Barnes, 2008). However, as operations take many shapes, the nature in which the resource capabilities that are being managed, deployed and utilized varies a lot depending on which perspective that is employed (Swink & Hegarty, 1998). This section therefore seeks to identify the relevant concepts of manufacturing strategy. 3.2.1 Scope and Definitions Voss (2005) argues that literature on manufacturing operations and related strategic decisions that provide guidelines for exceptional performance can be separated into “three distinct, but, related paradigms of manufacturing strategy” (Voss, 2005, p.1216), including: (1) competing through manufacturing, (2) strategic choices in manufacturing, and (3) best practices. An important distinction is that all these paradigms all have different approaches to manufacturing strategy content, rather than the process itself. For instance, Hill (1993) argues that competition through manufacturing is done through focus on what he defines as order winning criteria in the specific market, including: price, delivery, quality, product designandvariety. Platts & Gregory (1992) also provide an external approach, stating that market requirements such as delivery lead time, reliability, product features, quality, design flexibility, output volume and price are the vantage point in which organizations should develop their internal capabilities. Conversely, elements of the strategic choice paradigm was first discussed in the pioneering work by Woodward (1965) and Skinner (1969), but has later been further developed into what is considered the dominant model in manufacturing strategy by Hayes & Wheelwright (1984). The strategic choice paradigm buildthe process structure based on internal resource capabilities such as plant and equipment, production planning and control, labor and staffing, product design and engineering, and organizationandmanagement (Skinner 1969; Voss; 2005). The most recent of the three paradigms, is the best practices paradigm derived from the Japanese car-making industry. Its emphasis is focused on world-class manufacturing throughbenchmarkingof best industry practices andcontinuous improvement through process re-engineering (Voss, 2005). 3.2.2 The Strategic Choice Paradigm According to Voss (2005), the strategic choice paradigm carries the highest potential for the pursuingMO. Givenits contingency-based approaches, as for instance embeddedinHill (1993) – inwhichemphasize that process choice is based on the interdependent requirements between market strategy, and the order winning criteria that nurture internal and external consistency. However the differences and commonalities between the paradigms exist. The key similarity is that all emphasize that exceptional performance is achieved differently for each individual organization, as they all have different prerequisites in terms of external market conditions, and internal resource availability. 16
  • 17. 3.2.2.1 Competitive Priorities Hayes & Wheelwright (1984) propose two constituents of manufacturing strategy, competitive priorities and decision categories. Competitive priorities consider manufacturing strategy from the market-based view (Porter, 1980). This view interprets manufacturing operations as an adjustable system that can be tailored to meet customer values and expectations, and relates to the idea that all companies at least compete on the basis of one out of the four following priorities: quality, lead-time, cost or flexibility, each priority satisfyingdifferent dimension of market requirements. These competitive priorities are all derived from manufacturing operations, and are still valid today, although more contemporary literature has included more dimensions. Table 2 illustrate the originally proposed competitive priorities Competitive priorities Description Quality Manufacture of products with high quality and performance standards Delivery Reliable (on time) and fast (short delivery lead time) delivery of products Cost Production and distribution of the product at low cost Flexibility Ability to handle volume and product mix changes Table 2 - General competitive priorities. Source: Hayes & Wheelwright, 1984; Rudberg & Olhager, 2003 3.2.2.2 Decision Categories The second constituent, involve eight decision categories that was further defined and divided into structural and infrastructural categories by Rudberg & Olhager (2003), with four categories in each sub-category found in table 3.. Decision categories Policy areas Structural: • Process choice • Facilities • Capacity • Vertical integration Process choice, technology, integration Size, location, focus Amount, timing, increments Direction, extent, balance Infrastructural: • Manufacturing planning and control • Performance measurement • Organization • Quality System design, decision support Measurements, methods of measure Human resources, design Definition, role, tools Table 3 - Decision categories and related policy areas. Source: Hayes & Wheelwright, 1984; Rudberg & Olhager, 2003. Decision categories consider manufacturing strategy from the approach of the resource-based view (RBV). In that sense, the RBV is an integral part of manufacturing strategy. Hayes & Pisano (1994) further claim that decisions made with regards to structural and infrastructural decision categories, impact the manner in whichorganizations utilize their resources and dictate what types of practices the organizationchoose to employ. Tanet al (2007) refers to these operating characteristics as manufacturing capabilities. 17
  • 18. 3.2.2.3 Manufacturing Capabilities According to Größler & Grübner (2006), the two aforementioned constituents of manufacturingstrategy makes up what is defined as the manufacturing capabilities. Hallgren (2007) elaborates on this notion and states that manufacturing capabilities relates to “the set of practices inuse” withinthe manufacturingoperation.Inadditionto decisional alignment between the set of practices in use such those related to choice PT, Voss (1986) argue that market specific, order winning criteria, is key to maximize organizational performance. Although traditional manufacturing literature often assess the achieved level of operational performance and utilization of organizational capabilities through the lens of the four Performance objectives (PO) derived from competitive priorities discussed above, the current body of literature is inconsistent in terms of how many, and further which manufacturing capabilities that should be given most attention. For instance, Ferdows & de Meyer (1990) proposed in their “sand-cone model” that all performance is rooted in the ability to provide exceptional quality. Furthermore, Größler & Grübner (2006) has suggested that these four are interrelated, and that an organizations ability to pursue exceptional delivery performance is dependent on its ability to achieve equally outstanding performance in quality, and so on. Table 4 illustrate those capabilities in which Größler & Grübner (2006) suggest to be most important Manufacturing capability Description Quality: Manufacturing conformance Product quality and reliability Delivery: Delivery speed Delivery reliability Manufacturing lead time Flexibility: Volume flexibility Mix flexibility Cost: Labor productivity Inventory turnover Capacity utilization The ability to produce in accordance with specification and without error The ability to deliver products quickly, and in accordance with customer requirements The ability to change volume, manufacturing processing time, product mix and to innovate through new product introduction The ability to produce at low cost Table 4 - Manufacturing capabilities and related dimensions. Source Größler & Grübner, 2006; Barnes, 2008. 3.3 Manufacturing Strategy Typologies Muchcontemporary work onbusiness andmanufacturingstrategy departures from the dominant business strategy paradigm proposed by Porter (1980; 1985) in which where he suggest three generic approaches to competitive strategy that place organizations competitive priorities into a strategic context. 3.3.1 Typologies of Generic Business Strategy & Manufacturing Strategy Miller & Roth (1994) provideda generic taxonomy for manufacturingstrategies. Throughdevelopment of capability profiles based on competitive capabilities identified inthe work of skinner (1969) andHayes & Wheelwright (1984), they pooled manufacturers into three strategic categories, including: (1) caretakers – are predominantly focusedon low prices as the dominant capability, followed by time-based competitive capabilities, (2) marketeers – seek to obtain broad distribution and offer broad product lines and to be responsive to changing volume requirements. 18
  • 19. Priorities withinthe marketeer cluster were conformance quality, dependable deliveries, andproduct performance. The Innovators – place highest emphasis on differentiation through uniqueness in designandrate of new products introduced. Price is not considered an important variable in this category. 3.3.2 The Relationship between Generic Business Strategy &Manufacturing Strategy Although the generic taxonomy by Miller & Roth (1994) provides a simple classification of manufacturingstrategic orientations, based on well-known characteristic focus of performance (e.g. cost as a competitive priority), it does not consider the importance of alignment between structural and infrastructural decision categories with generic business strategy. For instance, Swamidass & Newell (1987) first proposed two dimensions of generic manufacturing strategy, namely cost efficiency – and differentiation. These two dimensions has later been the focal point for multiple authors in the development of conceptual taxonomies that describe typologies of generic manufacturingstrategic approaches. As notedinthe sectionabove, PO’s such as cost, quality, flexibility and delivery have dominated much of the literature involving competitive dimensions (Kim & Lee, 1993). However, the 2x2 taxonomy proposed by Kim and Lee (1993), illustrated in fig.3 below, provide an adapted typology that place generic business strategies into the context of manufacturing. The taxonomy is further based on the three generic approaches to business strategy proposed by Porter (1980, 1985), including: (1) cost leadership, (2) differentiation, and (3) focus. Figure 3 – Generic manufacturing Strategies. Own creation, adapted from Kim & Lee, 1993 p. 9. (1) Cost leadership strategy: is first and foremost aimed towards optimizing the output volumes of non-discrete products. Pursuant MO´s may thereby gain competitive edge in industries where scale of production is symbolic for increased relative market share (Kotha & Orne, 1989). Two types of cost leadership is further recognized by Porter (1980), namely; industry-wide and segment-oriented. (2) Differentiation strategy: is associated with the goal of differentiation through for instance appealing to customer expectations of high variations in the product mix, superior product quality, and/or short leadtimes (Kim & lee, 1993). According to Kotha & Orne (1989), the strategic target is usually more segmenteddue to the more customized and discrete nature of products offered. Porter (1980) emphasizes that industry-wide and segment-oriented approach is also viable for differentiation strategies. (3) Cost & differentiation strategy: was previously not conceivedto holdany potential strategic advantage (Kim & Lee, 1993). However, as integration between process technologies andIT-solutions suchas CAM, CAD andFMS have paved way for mixing cost anddifferentiationstrategy at corporate level, but also betweenbusiness units. Pure Differentiation High Cost & Differentiation No Intended Strategy Pure Cost Leadership Low HighLow Cost Efficiency Differentiation 19
  • 20. In more recent times, anadditional fourthstrategic orientation has openedupnew business opportunities for MO’s (Paton et al., 2011). First proposed and popularized by Pine (1993), mass-customization is a relatively new manufacturing strategic approach, in which first and foremost has been driven by rapid advances in machine technology enabling increased personalization of products. In contrast to focusing on production of high volume, standardized products as found in mass-production, where manufacturers are leveraging on the concept of economies of scale, mass customization is more focused on achieving economies of scope, the economic concept that place emphasis on “high variety of outputs from a single process” (Paton et al., 2011 p. 149). 3.3.3 Primary Dimensions & Underlying Variables of Manufacturing Strategy From an internal organizational perspective, it is further assumedthat primary dimensions andunderlyingvariables of the manufacturing structure typology proposed by Kotha & Orne (1989), dictates the appropriate external strategic focus of the organization. The authors propose a manufacturing structure framework composedof three structural constituents illustratedin table 5. When combined with Porters typology of generic business strategy (Porter 1980; 1985), and/or the adapted model by Kim & Lee (1993), form a conceptual synthesis. In addition, the synthesis distinguish itself in the way that it in addition to the traditionally proposed dimensions: (1) process structure complexity, and (2) product line complexity, employs a third perspective (3) organizational scope, in which takes factors related to the geographic scope of operational activities into consideration. Primary dimension Underlying Variable Dimension of underlying variable Process Structure Complexity Level of mechanization (1) Manual, (2) Machine, (3) Fixed program, (4) Programmable Level of systemization (1) Data collection, Event reporting, (3) Tracking, (4) Monitoring, (5) Guide, (6) Control Level of interconnection (1) Discontinuities, (2) Technological interdependences, (3) Operational flexibility Product Line Complexity End product complexity (1) High product line complexity (complexity/variety/volume/maturity) (2) Medium product line complexity (complexity/variety/volume/maturity) (3) Low product line complexity (complexity/variety/volume/maturity) Variety of final product Individual product volumes End-product maturity Organization al Scope Geographic manufacturing scope (1) High organizational scope (global) (2) Medium – high organizational scope (multinational) (3) Medium organizational scope (national) (4) Medium – low (regional) (5) Low organizational scope (undefined) Geographic market focus Vertical integration Customer – market scope Scale Table 5 - Manufacturing structure typology: primary dimensions and underlying variable. Source: Own creation, adapted from Kotha & Orne, 1989. 3.3.3.1 Process structure complexities Process structure complexity, is concerned with the capabilities of the process flow, and include elements suchas: (1) the level of mechanization, meaning the degree to which a process is able to repeatedly perform tasks with a satisfying degree of automation; (2) level of systemization, meaning the level to which platform interdependent integration between direct technology applied in the conversionprocess andindirect process technologies process technologies such as ERP systems, that facilitates high connectivity exists (Paton et al., 2011; Slack & Lewis, 2011); 20
  • 21. and (3) the level of interconnection, meaning the degree to which the process flow on the shop floors are characterized by fluency or discontinuity. 3.3.3.2 Product line complexities Product line complexity is concerned with bridging internal resource capabilities and external markets requirements. Elements in this dimension include: (1) end product complexity, (2) variety of final products (3) individual product volumes, and (4) end-product maturity. 3.3.3.3 Organizational Scope As a dimension, the organizational scope of the organization includes additional elements not traditionally foundin other strategic typologies (Kotha & Orne, 1989). For instance, it includes structural characteristics missing in the first two, such as considerations with regards to location-specific advantages related to easier access to factor s of production (e.g. raw materials and labor), and factors involving proximity to the marketplace, supplier and distribution networks. 3.3.3.4 Conceptual Synthesis The conceptual synthesis is built on two primary assumptions. First, it is assumed that MO’s in which pursue cost leadership, place considerable emphasis on reducing the costs associated with each step in the process flow. Hence, the related manufacturing structure characteristics are suggested to be “low product line complexity and high process structure complexity” (Kotha & Orne, 1989, p. 225). Conversely, the second assumption suggests that that MO’s pursuing differentiation strategy “tend to have more complex product lines and more discontinuities in the process structure” (Kotha & Orne, 1989, p. 225). Between these two assumptions, the author identifies eight different manufacturing structures. (1) Segment, neither cost nor differentiation strategy (2) Segment, differentiation strategy (3) Segment, cost leadership strategy (4) Segment, mixed strategy (5) Industry-wide, mixed strategy (6) Industry-wide, differentiation strategy (7) Industry-wide cost leadership strategy (8) Industry-wide, cost and differentiation strategy Figure 4 – A synthesized strategic framework: a conceptual representation. Source: Own creation, adapted from Kotha & Orne, 1989, p. 225. It is further noted by the authors, that: “within the context of the manufacturing structure framework, BU’s can generate structural uniqueness – through generic strategies – by moving to the corners labeled 2, 3, 6 and 7” (Kotha & Orne, 1989, p. 225). 7 5 6 8 3 4 21 Low High HighLow Low High Process Structure Complexity Product Line Complexity Organizational Scope 21
  • 22. 3.4 Accommodating Typologies for Process-Technology Strategy in Manufacturing There is a general consensus among scholars that different types of process technologies thrive under different strategic conditions (Kim & Lee, 1993). Hence, in the case of PT adoption decisions, MO´s shouldfirst andforemost place emphasis on its operational “fit” with strategic perspective of the organization, and related guidelines found in overall operations strategy (Slack & Lewis, 2011). 3.4.1 Technical Complexity & Technical Flexibility One of the more recognized typologies for manufacturing system classification is that of Kim & Lee (1993). The typology demonstrates a direct link between MO’s applied production system and manufacturing strategy. The typology further propose two independent dimensions of process technologies and manufacturing systems, in which recognize structural decision categories with regards to a PT’s fit with overall strategic orientation. 3.4.1.1Technical Complexity The first dimension, technical complexity is defined as the: “complexity of the process technology”, and is further composed of three characteristic elements, including: (1) the level of mechanization, (2) the level of predictability and (3) the level of systematization, all somewhat corresponding with the elements included in process structure complexity proposed by Kotha & Orne (1989). 3.4.1.2 Technical Flexibility The second dimension, technical flexibility includes several variables including machine-, process-, product-, and volume-flexibility. These elements are more related to product line complexity (Ibid), but also incorporate what is considered “the most prevalent word in the manufacturing lexicon today”, flexibility (Kim & Lee, 1993, p. 6), noted to be a key facilitating concept in mass-customization strategy and the achievement of economies of scope (Paton et al., 2011). 3.4.1.3 Systems & Accommodating Order Types Figure 5 – Typology of Production systems & practical examples- Own creation, adapted from Kim & Lee, 1993, p. 6-7. Technical Flexibility Technical Complexity High High Low Low Intermittent system Degenerate system Continuous system Concurrent system Technical Flexibilit Technical Complexity High High Low Low Job Shop Batch FMC FMS Anachronistic factory Assembly Line Flexible Assembly Line Transfer LineContinuous Flow Process 22
  • 23. The figures above illustrate what Kim & Lee (1993) proposes to be four classifications of manufacturing and production systems, and the corresponding operational process flow set-ups. The same authors elaborate that certain system types more appropriately accommodates specific manufacturingstrategies. Patonet al (2011) notes that certain customer order types are more appropriate for different manufacturing processing systems. Table 6 contains the key characteristics of, and relationships between type of system and accommodating orders. Type of manufacturing system Characteristics Type of customer orders Characteristics Continuous systems High volume capabilities High levels of automation High task specificity High set-up costs Make to stock (MTS) Standardized products Made for inventory Low customization Forecast driven Intermittent systems Low volume capabilities Low task specificity Low set-up costs High process flexibility High customization Make to Order (MTO) Highly customized products Complex products Low levels of inventory Concurrent systems Predefined medium lot volumes Highly IT integrated High levels of automation medium task specificity Assemble to order (ATO) “Hybrid” order type Modular Inventory Medium/high customization Degenerate systems Outdated system without any specific characteristics N/a N/a Table 6 – Key characteristics and relationship between system and order types. Source: Own creation, adapted from Kim & Lee, 1993 and Paton et al., 2011. 3.5 Manufacturing & Operations Performance There is a strong link between an organizations strategic focus – understood in this context as: “the guiding principle that differentiates one company from another” – and performance management, defined as the: “systematic measuring, monitoringanddecision-makinggearedtowards fulfillingorganizational objectives through operations management” (Paton et al., 2011, p. 377). However, it is noted by the same authors that because: “measuring performance provide little value in itself”, it is the manner in which the organization selects and reacts to performance data that aid in the creation of a future plan of action that contribute to the final value-creation. 3.5.1 Generic Performance Objectives Contemporary performance management frameworks such as that of Slack & Lewis (2011) illustrated in table 7, takes a generic approach of viewing operational performance based on the following five PO’s: (1) quality, (2) speed, (3) cost, (4) dependability and, (5) flexibility. 23
  • 24. Operations resources Internal benefits include… Performance objective Market requirements External benefits include… Error-free processes Less disruption and complexity More internal reliability Lower processing costs Quality Higher specification products Error-free products Reliable products Faster throughput times Less queuing and/or inventory Lower overheads Lower processing costs Speed Short delivery queuing times Fast response requests Higher confidence in the operation Fewer contingencies needed More internal stability Lower processing costs Dependability On-time delivery of products Knowledge of delivery times Better response to unpredicted events Better response to variety of activities Lower processing costs Flexibility Frequent new products Wide range of products Volume adjustment Delivery adjustment Productive processes Higher margins Cost Low prices Table 7 - Internal and external benefits of excelling at each performance objective. Source: Slack & Lewis, 2011, p. 53. What differentiates this framework from other is that it – in addition to enable establishment of relationships between internal performance of processes and external response from the market, thereby recognizing the relative importance of both the MBV and the RBV – also consider the fact that: “not all measures of performance will have equal importance for an individual operation.” (Slack & Lewis, 2011, p. 66). 3.5.1.1 Quality Performance Quality is relatively difficult to grasp as it involves many facets, is relatively subjective in nature, and is dependent on the perceived interpretation and the contextual setting it relates to (Paton et al., 2011). Hence, several philosophical approaches has been developed in literature, some building the central notion of quality around customer expectations (Deming, 1986, Juran, 1988), while others have stated that product quality is a result of exceptional management practices and high internal coordination (Crosby, 1979, Feigenbaum, 1986). However, the most recognized conceptual classification of quality, is that of Garvin (1987), in which proposed 8 different perspectives of quality including: (1) performance, (2) features, (3) reliability, (4) conformance, (5) durability, (6) serviceability, (7) aesthetics and, (8) perceived quality. For operations suchas manufacturing, it is the conformance perspective of quality, understood as; “the degree to which a product’s design and operating characteristics meet established standards” (As noted in Paton et al., 2011, p. 429), that is considered the most important. 3.5.1.2 Speed Performance In simple terms, speed refers to the operations ability to optimize the time-spanbetweenthe initial customer order and the final delivery of the product or service (Slack & Lewis, 2011). In that sense speed has both internal as well as external performance implications. From an external customer perspective the process already starts withwhat is known as the enquiry decision time, in which relates to point when the decision to acquire a new product or service is made. This step is followed up by the enquiry lead-time – in which is where the customer gathers information about the ability of a provider to meet the specifications of the product they intendto purchase. As the 24
  • 25. order is placed, it is what is generally understood as lead-time that unifies both perspectives that is important (Paton et al., 2011). From an internal operations resource perspective, speed relate to every fragmented step after the order is placed. These steps include the service waiting time, where designing of the product in accordance with customer expectations occurs, or the core processing time – meaning the time it takes to process the input materials to output products, to the actual time from the product is shipped until delivery, referred to as the installation time (Slack & Lewis, 2011). 3.5.1.3 Dependability Performance Dependability is the other constituent of total delivery performance together with speed, in which indicate that its contribution to performance are mainly focusedaroundsatisfyingexternal customer expectations by providingon- time delivery of products (Slack & Lewis, 2011). The relative importance of dependability performance can be argued to vary depending on the manufacturing strategy or competitive position taken by the individual organization (Hallgren, 2007). For instance, anorganizationthat pursue pure cost leadershipstrategy – where order types are typically made on a MTS basis – would most likely not relate to dependability as an important PO, as delivery is instant and without customer involvement, while those pursuing an MTO strategy would place considerable emphasis on high dependability performance. 3.5.1.4 Flexibility Performance In an operational context, the definition of flexibility may relate to either an operations’ ability to: “adopt different states – take up different positions or do different things”, or describe: “an operation that moves quickly, smoothly and cheaply from doing one thing to doing another” (Slack & Lewis, 2011 p. 50) The authors further distinguish betweenfour categories of flexibility, including: (1) product flexibility – the extent to which an operation has the ability to introduce new products or modify existingones, (2) mix flexibility – the extent to which an operation has the ability to change the variety offered within a given time period, (3) volume flexibility the extent to which an operation has the ability to change the output of an operation quickly and, (4) delivery flexibility – the extent to which an operation has the ability to change planned and assumed delivery dates, respectively. According to Hallgren (2007), flexibility distinguishes itself, as it measures potential rather than achieved performance. 3.5.1.5 Cost Performance Cost performance – meaning the ability to produce at low costs, is widely acknowledged in academic literature as the most significant PO, especially for those who compete onprice (Slack & Lewis, 2011). Inanoperational context, Slack & Lewis propose a broad definition of cost to be: “any financial input to the operation that enables it to produce its products andservices”. They further distinguishbetweenthree different dimensions or classifications of costs. These include: (1) Operating expenditure – financial inputs needed to fund the operation (e.g. labor, materials, rent and energy consumption), (2) Capital expenditure – relates to the financial inputs neededto acquire the necessary equipment used in the transformationprocess (e.g. facilities, systems andprocessingmachinery), (3) working capital – relates to the financial inputs needed to support the timeframe difference between cash inflow- outflow from outgoing operating expenditures and received product payment. 25
  • 26. 4.0 Methodology This chapter presents the framework of methodological approach aiming to aid the step-by-step maneuvering in the answering of the main research question. In order to this, this chapter will define the guidingstructure indoing so by elaborating on decisions made by the author with regards to philosophical paradigm, research design, research approach, methodology for collection of data, and instruments applied in the collection of the data. 4.1 The Nature of Business Research First, the research approach in this thesis is acknowledged by the importance of achieving evidence-based management, understood as: “the systematic use of the best available evidence toimprove management practice” (Reay et al., 2009, as cited in Bryman & Bell, 2015, p. 8). The authors further emphasize a combination of four different information sources in which constitutes and contributes to evidence-based management • Practitioner expertise and judgement • Evidence from the local context • Critical evaluation of the best available research evidence • Perspectives of those who may be affected by the decisions (Briner, Denyer, and Rousseau, 2009) Gibbons et al., (2004) suggest that the production of scientific knowledge has two different approaches, or “modes”. The first mode builds on the assumption that: “all knowledge production is driven primarily by an academic agenda”(As cited in Bryman & Bell, 2015, p. 9), meaning that new knowledge should primarily take departure from established concepts found in an existing knowledge base. The secondmode, focus more ontrans- disciplinarity, meaning that in order to provide a holistic understanding of the research topic under scrutiny, the problem at hand has to be viewed through a multi-disciplinary lens, as the productionof knowledge is assumednot to be “confined to academic institutions” (Bryman & Bell, 2015, p. 9). According to Tranfield & Starkey (1998), business research tends to be better suited for “mode 2”, as it involves several knowledge creators, including: academics, policy-makers and practitioners. This thesis aim to reconcile bothmodes, as the evolutionof the fieldof research holds different maturity stages from a technology perspective and business/operations management perspective, calling for multiple approaches to answering of the research question at hand. 4.2 Philosophical Paradigms & Constituents of Scientific Research In business research, the researcher often encounters several questions related to the: “basic belief system or worldview that guides the investigator” in the creation of knowledge or interpretation of social phenomena (Guba & Lincoln, 1994, p. 105). The following section address differences between philosophical paradigms, and their business research relevance. 4.2.1 Philosophical Paradigms in Research Guba & Lincoln (1994) suggest are three influencing elements that define a researcher´s belief system. The so- called philosophical basis of the researcher is further determined by his/her approach to the following three questions: 26
  • 27. • Ontology: – meaning, “form and nature of reality and, therefore, what is there that can be known about it?” • Epistemology: – meaning, “the relationship between the knower or would-be knower and what can be known?” • Methodology: – meaning, “How the inquirer (would-be knower) go about finding out whatever he or she believes can be known?” (Guba & Lincoln, 1994, p.108). Crotty (1998) proposed that the design of a research proposal should departure from a set of predefined and interrelated elements, dictating the course of the research at hand. These elements include: epistemic position to knowledge (objectivism or subjectivism, etc.), philosophical stance (positivism, interpretivist, etc.), and methodological practices or instruments (interviews, conceptual modeling, content analysis, etc.) applied in the process (as noted in Creswell, 2003, p. 4-5). These guiding elements can according to Creswell (2003) further be translated into three sequential questions is also referred to as elements of inquiry and include three interrelated inquiries (knowledge claims, strategies, and methodology) that dictate the course of the researcher project (Ibid). The relationship between the elements and their relative importance with regards to structuring of the research design framework are discussed in the following sections. 4.2.2 Knowledge claims The concept of knowledge claims is rooted in the predetermined set of the researcher´s assumptions with regards to ontology, epistemology and methodology, embedded in the approach to learning aspect as well as the creation of knowledge through the research project (Ibid). Traditional knowledge claims or so-calledparadigms inresearch, include, post-positivism, critical theory, constructivism, and advocacy/participatory (Guba & Lincoln, 1994; Creswell, 2003). In more recent times, an additional paradigm called pragmatism has been given increasing attention in business, as well as social science research, domains that traditionally has been dominated by positivistic and interpretivist approaches (Orlikowski & Baroudi, 1991). Table 8 includes some of the most relevant knowledge claims, relevant paradigms and methodological approaches in business research. Knowledge claim Ontology Epistemology Methodology Post-positivism Conjectural Desired objectivity, however, the relationship between the researcher and research problem indicate subjectivity Quantitative Constructivism Relativistic Subjectivity, as knowledge is created through the relationship between the researcher and what is being researched. Qualitative Pragmatism Situational Consequence oriented, problem centered and pluralistic Mixed methods Table 8 - The relationship between different philosophical paradigms and respective knowledge claims. Own creation, inspired by Creswell, 2003. 4.2.3 Research Strategies The approach taken by the researcher with regards to research strategy defined as: “the general plan of how the researcher will go about answering the research questions” (Saunders et al., 2009, p. 600), is to a great extent dependent on the knowledge claims and related philosophical perspectives of the researcher (Creswell, 2003). Fundamentally, there are two different strategic research approaches, quantitative andqualitative research(Ibid). 27
  • 28. 4.2.3.1 Qualitative vs. Quantitative Research As noted by Silverman (1997), the two methodologies in question were developed under two very different approaches to ontology and epistemology, and therefore represent two distinct worldviews or paradigms (Ibid). Creswell (2003, p.13) notes that quantitative strategies of inquiry such as experimental strategies and surveys, constitute those in which: “invoked the post-positivistic perspectives”, and further influence the researcher’s ability to view the world through an objective lens (Guba &Lincoln, 1994). Conversely, the same authors suggest that qualitative approaches to research strategy such as ethnographical, phenomenological research, and case studies, tend to fit better under constructivist paradigm assumptions of the researchers knowledge claims are more subjective in nature. 4.2.3.2 Inductive vs. Deductive Reasoning In cognitive science, the choices made by the researcher with regards to employment of a qualitative or quantitative strategy approach, has additional implications for the nature of the relationship between theory and research findings (e.g., data, observations, etc.) (Bryman & Bell (2011). Whether the researcher employs an inductive or a deductive approach is traditionally recognized views of reasoninginresearch. Adeductive reasoning paradigm aims for generalizationof particular observations throughdemonstrationof causal relationships between theory and the research findings (Gulati, 2009). The relationship between theory and research findings through deductive reasoning is characterized by testingof hypotheses that is guidedby establishedtheoretical assumptions (Bryman & Bell, 2015). In addition, deductive reasoning is associated with positivistic/post-positivistic knowledge claims, as observations are tested to the extent it is true or not (Creswell, 2003). Conversely, inductive reasoningis associated with a constructivist/interpretivist worldview, and further: “involves the search for pattern from observation and the development of explanations – theories – for those patterns through series of hypotheses” (Bernard, 2011, p.7). Figure 6 provide a simple illustration of the different vantage points behind the two approaches. Figure 6 – Differences between deductive and inductive reasoning in research. Own creation, inspired by Bryman & Bell, 2015, p. 23. 4.3 Thesis Knowledge Claims This thesis employs a pragmatic research approach. Pragmatism is especially applicable in IT and technology research, as it is not only concerned with what is found in positivistic and interpretivist views to be the important questions with regards to ontology of “what is”, but possess a orientation to knowledge about the world as to “what might become” through: “explorationintosocial andtechnical potentials andopportunities” (Goldkuhl, 2012, p.87). Three types of pragmatism can further be identified; functional pragmatism – meaning, knowledge for actions, referential pragmatism – meaning, knowledge about actions, andmethodological pragmatism – meaning, knowledge through actions (Ibid). As noted, this thesis adopts what (Goldkuhl, 2012) refer to as general functional pragmatism, a sub-category of functional pragmatism that aim towards realization of widespread abstract Theory Research Findings TheoryResearch Findings Deductive reasoning Inductive reasoning 28
  • 29. knowledge creation that not only provide value for a specific scientific community, but benefits cross-disciplinary practitioners. 4.3.1 Thesis’ Pragmatic Approach to Ontology The relationships between technology and social world has been a widely discussed as a complicated subject among scholars (Lawson, 2007). With regards to the pragmatic ontological position, the thesis recognizes the proposition that: “the essence of society lies in an ongoing process of action– not inapositedstructure of relations” (Blumer, 1969, p. 71). This imply that explanation of abstract relationships between the artefact (AM) and social reality are not driving progress, but is rather the basis from which where plans of action that encourage and supports continuous improvement. 4.3.2 Thesis’ Pragmatic Approach to Epistemology As discussed by Goldkuhl (2012), knowledge of “what is”, is found more important to positivists andinterpretivists as it is limited to description, explanation and understanding. These elements are also of vital importance in this thesis, as they are embedded in the author´s communication of the new and abstract knowledge, created for the reader. However, they are only pillars in which potential solutions to a “world to-be” are built on. A “world to-be”, in which the manager/practitioner, may or may not find favorable based on their interpretation of the communicated knowledge. Hence, the pragmatic epistemic foundation of this thesis can be characterized by its purpose of contributing a possible/desirable solution to a practical problem (Ibid) through demonstration of evidence from reality that supports the described, explained and understood.This canbe exemplifiedby the different types of knowledge that each building-block attempts to create, illustrated in table 9. Building-block Description of pragmatic epistemology BB-1 Deviate from pure pragmatic knowledge creation, as its purpose is more in line with the constructivist/interpretivist viewofunderstandingandexplainingcurrentphenomenological relationship between the technological artefact (AM), and its relationship to the socially constructed reality. BB-2 Takes a combined approach recognized by Goldkuhl (2012) as the creation of evaluative knowledge – meaning, diagnostic judgements through grounded reasoning, and attributive knowledge – meaning, characterization of properties related to an object. The evaluative knowledge creation in this thesis being the technology capability and performance assessment of AM compared with TM methodologies, while the attributive knowledge creation is part of the diagnostic assessment, as neither are mutually exclusive. BB-3 Aim for the development of explanatory knowledge, meaning establishment of cause-to- effect relationships of the implicationsofthe formertypesof communicated knowledgewith regards to the object / technological artefact (AM). This logic derives from the assumption that technology features, characteristics and performance assessment provide an explanatory basis from which the strategic purpose boundaries of AM can be determined. Table 9 – Overview of epistemic approaches, and knowledge contributions for each respective “building-block”. Source: Own creation, Inspired by Goldkuhl, 2012. 29