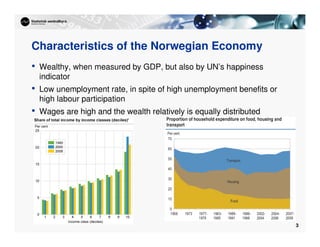
1
1
The Norwegian
The Norwegian Economy
Economy
Joakim Prestmo
Economist Reseacher
Reseach Department, Statistics Norway
Lecture in Norwegian Life and Society
2
Outline of today's lecture
a. Where do we stand to day?
b. How did we get there?
c. Some important aspects of the Norwegian economy
d. Questions/supplementary topics
e. Group discussion
3
Characteristics of the Norwegian Economy
• Wealthy, when measured by GDP, but also by UN’s happiness
indicator
• Low unemployment rate, in spite of high unemployment benefits or
high labour participation
• Wages are high and the wealth relatively is equally distributed
4
Household Expenditures
Why? Long distances,
high taxes
Why? High income,
preferences/culture
5
Success Factors for the Rapid Economic Growth
• Resource endowment
• Collaboration, trust and equality
• Knowledge and technology
• Coordinated market economy
• The lucky element
→ This are important factors for explaining the high productivity and wage
growth
For an in-depth study
Economist (Feb 2nd 2013): “ The rich cousin – Oil makes Norway different from the rest of the region, but only up to a point”
http://www.economist.com/news/special-report/21570842-oil-makes-norway-different-rest-region-only-up-point-rich
Dølvik, Jon Erik (2007): “The Nordic regimes of labour market governance: From crisis to success-story?”, Fafo-paper 07
Larsen, Erling Røed (2001): “The Norwegian Economy 1900 – 2000: From Rags to Riches”, Economic Survey 4, 22-37
(http://www.ssb.no/english/subjects/08/05/10/es/200104/roedlarsen.pdf)
SSB (2011): Minifacts about Norway (http://www.ssb.no/english/subjects/00/norge_en/en)
6
Resources
• Climate and geography
– Mountains, rivers and Gulf stream
– Electricity
– The fjords and fertile soil – fish,
timber and livestock
• Oil
– Increasing oil prices in the sixties
and seventies made it possible to
exploit oil from the North Sea.
• Terms of trade
– ”China-effect” → improved terms
of trade.
– Cheap import goods and
expensive export products
0
20
40
60
80
100
120
140
160
1900 1910 1920 1930 1940 1950 1960 1970 1980 1990 2000
GDP pr capita – PPP adjusted
– Norway versus Sweden (=100)
7
Collaboration, Trust and Equality
• Success by working together
– Centralized wage bargaining (LO – NHO)
– Differences are small
 Relative high wages for those without/with lower education
 Relative low wages for executive’s
– Sharing profits
– Max Weber: “Protestant work ethic” – it’s expected that individuals
will do its duty
– Why are we so productive?
 Culture for hard work
 Everybody contributes
 High education (like Netherlands, New Zealand …)
8
Equality?
• Equality between gender and
individuals
– Same opportunities independent of
gender or family background
– Family or network not that important
in the labour market
– Female labour increasing
 Increasing labour force and
improving equality
9
Income Differentials?
• Europe has small
differences
• But, Scandinavia scores
higher on equality than
Continental-Europe
10
Trust…
• High degree of trust
– JD survey asked in an
international survey: “…can most
people be trusted…”
 Norway are rated highest, with
Sweden the closest
– Effects and consequences of
having trust to people
 You are expected to keep your
promises and tell the truth
– People have trust in salesmen,
 Fewer written contracts or law
suits
– No reason to spend time on
– Verbal agreements have the
same legally status as written
contracts
 A larger part of the public pays
taxes when they trust the
government to spend it wisely
http://www.jdsurvey.net/jds/jdsurveyActualidad.jsp?Idioma=ISeccionTexto=0404NOID=104
11
Knowledge and Technology
• A public education system
– Primary school to universities
– Roughly 50 % of kindergartens
are private – but publicly financed
• Scholarships to pupils from poor
families and stipends to all
students
• Growth in higher education
– Understanding new technology
– Implement new machines or
production methods faster
12
Politics and its Influence on Growth
• Government intervene in most part of the economy
– Large bureaucracy
– Too a less degree publicly financed businesses providing public
services
– Public corporations
 Important parts of the economy: Infrastructure, oil and gass, electricity,
telecom, transport, banking
 New technology: Innovation centres (green tech, export industry, RD)
 Important for the equality: Educational system, health care
• Taxes and subsidies
– Tax things you dislike (tobacco, pollution etc)
– Subsidy thing you like (tech, green tech, farming etc)
 Taxes correct market distortions/failors and by that increases economic
growth and welfare
13
The Luckiest Nation on Earth?
• Nice and friendly neighbours
– Industrial countries, peaceful and similar culture and language
• Rich neighbours
– Improves the possibilities for trade
• Resource endowment
– Fisheries, black gold and electricity
• No long standing conflicts or disruptions
– Did not participate in WW1.
– Was barely affected by WW2 compared to most European countries
14
How is it today?
• Why are most goods and services so expensive?
• Scandinavian Welfare model
• Oil rent and fiscal policy guidelines
15
An expensive country: Both prices and wages are high
• Strong currency
– High interest rate and sovereign wealth fund (solid State)
 Cheap imports (ex. clothing and electronic equipment)
 High prices on goods produced or processed in Norway (ex. food and services)
• High wages
– Low incomes are not so low…
 Distance between low and high income is small - shop assistants or waiters
 Ex. A senior engineer earns more in Shanghai than in Oslo
– High prices on intermediate goods increases prices on finished goods
• High demand
– Increases prices
– Increases interest rates further …
16
The Scandinavian Welfare Model
• Social security net
– Public disability insurance
– Social security benefits
– High unemployment benefits
 If you fulfil some criteria's you get 60 percent of your wage, if
you get unemployed (in 2 years)
Increases employment (labour participation)
• Birth leave
– Woman's can choose between 47 weeks full paid or 57
weeks with 80 percent pay
– Also birth leave for men (12 weeks).
Increases women's labour participation
17
Taxes – high, but fair?
• High taxes but also high transfers
• This leaves out health care, kindergartens, schools, nursing homes etc.
18
Norwegian Tax System (2012)
• Payroll tax (2011)
– In 2011 the average monthly wage was 37.800 kroner ($6.800; €5.100)
 Taxrates
 36 %
 Personal deduction (untill 78 150 kroner)
 Average tax rate app. 31 %
– But marginal tax rate is increasing till 48 % (to high pursuant to OECD)
 Surtax, step 1: 9 % above 490.000 NOK
 Surtax, step 2: 12 % above 796.400 NOK
• Wealth tax
– 1,1 % (if net wealth above 750.000 NOK)
• Property tax
• Mortgage interest deduction (28 % of the interest paid are withdrawn
before payroll tax are estimated)
• Indirect taxes
– VAT. is 25 % on most goods and services
– High taxes on all aspects of using a vehicle
19
Incentives to Work
• Most benefits related to salary
– Both disability insurance and retirement pensions increases
dramatically if you have been working
– Only those who have been working can receive birth leave (men and
women)
• Introduction of early retirement pension has reduced the
numbers receiving disability insurance
– Because only those you are working can receive early retirement
pension
• High retirement age – 67 year
• Higher than most countries (ex. Iceland)
20
Are the Incentives Working?
• Low unemployment rate (during the
last 40 years
– Flexible labour force
 Immigration
 Education
• High labour force participation rate
(for both sexes)
21
The Black Gold – the Oil and Gas Reserves
• Started oil exploration in late
the1960-ties
• Oil production began early in the
1970-ties
• Have managed the natural
resource curse
– Dutch disease
– Wars and corruption
• Pumping up oil and gas do not
increase our wealth
• “To much to fast” is not good for the
economy
• The environment problem
– Important when deciding whether we
should aloud production in Lofoten.
22
Fiscal Policy Guidelines – Norway equivalent to
the Maastrichts criteria
• Size of investments in petroleum
about 6-7 % of GDP Mainland
• Net cash flow from petroleum to the
Norwegian government equaled 276
bill kroner in 2010
– About 14 per cent of GDP-Mainland
– Invested in the Norwegian Pension
Fund
• Fiscal policy guidelines
– The government can use approximate
4 % of the Funds assets each year
– Stabilizes the economy
– Makes us less dependent on the oil
rent
– Saves for future generations
– An aging population
23
Trade
• Sweden, Netherlands, Germany,
China and UK are our most
important trading partners
• Natural gas and oil are the most
important export good together
with seafood
24
Swimming in the Sea
• Fish and aquaculture one
of Norway’s largest export
article
– Cod from Lofoten
– Salomon from fish farms
Source: Food and agriculture organization (FAO)

the-norwegian-economy---by-prestmo.pdf

  • 1.
    1 1 The Norwegian The NorwegianEconomy Economy Joakim Prestmo Economist Reseacher Reseach Department, Statistics Norway Lecture in Norwegian Life and Society
  • 2.
    2 Outline of today'slecture a. Where do we stand to day? b. How did we get there? c. Some important aspects of the Norwegian economy d. Questions/supplementary topics e. Group discussion
  • 3.
    3 Characteristics of theNorwegian Economy • Wealthy, when measured by GDP, but also by UN’s happiness indicator • Low unemployment rate, in spite of high unemployment benefits or high labour participation • Wages are high and the wealth relatively is equally distributed
  • 4.
    4 Household Expenditures Why? Longdistances, high taxes Why? High income, preferences/culture
  • 5.
    5 Success Factors forthe Rapid Economic Growth • Resource endowment • Collaboration, trust and equality • Knowledge and technology • Coordinated market economy • The lucky element → This are important factors for explaining the high productivity and wage growth For an in-depth study Economist (Feb 2nd 2013): “ The rich cousin – Oil makes Norway different from the rest of the region, but only up to a point” http://www.economist.com/news/special-report/21570842-oil-makes-norway-different-rest-region-only-up-point-rich Dølvik, Jon Erik (2007): “The Nordic regimes of labour market governance: From crisis to success-story?”, Fafo-paper 07 Larsen, Erling Røed (2001): “The Norwegian Economy 1900 – 2000: From Rags to Riches”, Economic Survey 4, 22-37 (http://www.ssb.no/english/subjects/08/05/10/es/200104/roedlarsen.pdf) SSB (2011): Minifacts about Norway (http://www.ssb.no/english/subjects/00/norge_en/en)
  • 6.
    6 Resources • Climate andgeography – Mountains, rivers and Gulf stream – Electricity – The fjords and fertile soil – fish, timber and livestock • Oil – Increasing oil prices in the sixties and seventies made it possible to exploit oil from the North Sea. • Terms of trade – ”China-effect” → improved terms of trade. – Cheap import goods and expensive export products 0 20 40 60 80 100 120 140 160 1900 1910 1920 1930 1940 1950 1960 1970 1980 1990 2000 GDP pr capita – PPP adjusted – Norway versus Sweden (=100)
  • 7.
    7 Collaboration, Trust andEquality • Success by working together – Centralized wage bargaining (LO – NHO) – Differences are small Relative high wages for those without/with lower education Relative low wages for executive’s – Sharing profits – Max Weber: “Protestant work ethic” – it’s expected that individuals will do its duty – Why are we so productive? Culture for hard work Everybody contributes High education (like Netherlands, New Zealand …)
  • 8.
    8 Equality? • Equality betweengender and individuals – Same opportunities independent of gender or family background – Family or network not that important in the labour market – Female labour increasing Increasing labour force and improving equality
  • 9.
    9 Income Differentials? • Europehas small differences • But, Scandinavia scores higher on equality than Continental-Europe
  • 10.
    10 Trust… • High degreeof trust – JD survey asked in an international survey: “…can most people be trusted…” Norway are rated highest, with Sweden the closest – Effects and consequences of having trust to people You are expected to keep your promises and tell the truth – People have trust in salesmen, Fewer written contracts or law suits – No reason to spend time on – Verbal agreements have the same legally status as written contracts A larger part of the public pays taxes when they trust the government to spend it wisely http://www.jdsurvey.net/jds/jdsurveyActualidad.jsp?Idioma=ISeccionTexto=0404NOID=104
  • 11.
    11 Knowledge and Technology •A public education system – Primary school to universities – Roughly 50 % of kindergartens are private – but publicly financed • Scholarships to pupils from poor families and stipends to all students • Growth in higher education – Understanding new technology – Implement new machines or production methods faster
  • 12.
    12 Politics and itsInfluence on Growth • Government intervene in most part of the economy – Large bureaucracy – Too a less degree publicly financed businesses providing public services – Public corporations Important parts of the economy: Infrastructure, oil and gass, electricity, telecom, transport, banking New technology: Innovation centres (green tech, export industry, RD) Important for the equality: Educational system, health care • Taxes and subsidies – Tax things you dislike (tobacco, pollution etc) – Subsidy thing you like (tech, green tech, farming etc) Taxes correct market distortions/failors and by that increases economic growth and welfare
  • 13.
    13 The Luckiest Nationon Earth? • Nice and friendly neighbours – Industrial countries, peaceful and similar culture and language • Rich neighbours – Improves the possibilities for trade • Resource endowment – Fisheries, black gold and electricity • No long standing conflicts or disruptions – Did not participate in WW1. – Was barely affected by WW2 compared to most European countries
  • 14.
    14 How is ittoday? • Why are most goods and services so expensive? • Scandinavian Welfare model • Oil rent and fiscal policy guidelines
  • 15.
    15 An expensive country:Both prices and wages are high • Strong currency – High interest rate and sovereign wealth fund (solid State) Cheap imports (ex. clothing and electronic equipment) High prices on goods produced or processed in Norway (ex. food and services) • High wages – Low incomes are not so low… Distance between low and high income is small - shop assistants or waiters Ex. A senior engineer earns more in Shanghai than in Oslo – High prices on intermediate goods increases prices on finished goods • High demand – Increases prices – Increases interest rates further …
  • 16.
    16 The Scandinavian WelfareModel • Social security net – Public disability insurance – Social security benefits – High unemployment benefits If you fulfil some criteria's you get 60 percent of your wage, if you get unemployed (in 2 years) Increases employment (labour participation) • Birth leave – Woman's can choose between 47 weeks full paid or 57 weeks with 80 percent pay – Also birth leave for men (12 weeks). Increases women's labour participation
  • 17.
    17 Taxes – high,but fair? • High taxes but also high transfers • This leaves out health care, kindergartens, schools, nursing homes etc.
  • 18.
    18 Norwegian Tax System(2012) • Payroll tax (2011) – In 2011 the average monthly wage was 37.800 kroner ($6.800; €5.100) Taxrates 36 % Personal deduction (untill 78 150 kroner) Average tax rate app. 31 % – But marginal tax rate is increasing till 48 % (to high pursuant to OECD) Surtax, step 1: 9 % above 490.000 NOK Surtax, step 2: 12 % above 796.400 NOK • Wealth tax – 1,1 % (if net wealth above 750.000 NOK) • Property tax • Mortgage interest deduction (28 % of the interest paid are withdrawn before payroll tax are estimated) • Indirect taxes – VAT. is 25 % on most goods and services – High taxes on all aspects of using a vehicle
  • 19.
    19 Incentives to Work •Most benefits related to salary – Both disability insurance and retirement pensions increases dramatically if you have been working – Only those who have been working can receive birth leave (men and women) • Introduction of early retirement pension has reduced the numbers receiving disability insurance – Because only those you are working can receive early retirement pension • High retirement age – 67 year • Higher than most countries (ex. Iceland)
  • 20.
    20 Are the IncentivesWorking? • Low unemployment rate (during the last 40 years – Flexible labour force Immigration Education • High labour force participation rate (for both sexes)
  • 21.
    21 The Black Gold– the Oil and Gas Reserves • Started oil exploration in late the1960-ties • Oil production began early in the 1970-ties • Have managed the natural resource curse – Dutch disease – Wars and corruption • Pumping up oil and gas do not increase our wealth • “To much to fast” is not good for the economy • The environment problem – Important when deciding whether we should aloud production in Lofoten.
  • 22.
    22 Fiscal Policy Guidelines– Norway equivalent to the Maastrichts criteria • Size of investments in petroleum about 6-7 % of GDP Mainland • Net cash flow from petroleum to the Norwegian government equaled 276 bill kroner in 2010 – About 14 per cent of GDP-Mainland – Invested in the Norwegian Pension Fund • Fiscal policy guidelines – The government can use approximate 4 % of the Funds assets each year – Stabilizes the economy – Makes us less dependent on the oil rent – Saves for future generations – An aging population
  • 23.
    23 Trade • Sweden, Netherlands,Germany, China and UK are our most important trading partners • Natural gas and oil are the most important export good together with seafood
  • 24.
    24 Swimming in theSea • Fish and aquaculture one of Norway’s largest export article – Cod from Lofoten – Salomon from fish farms Source: Food and agriculture organization (FAO)