Download as PDF, PPTX


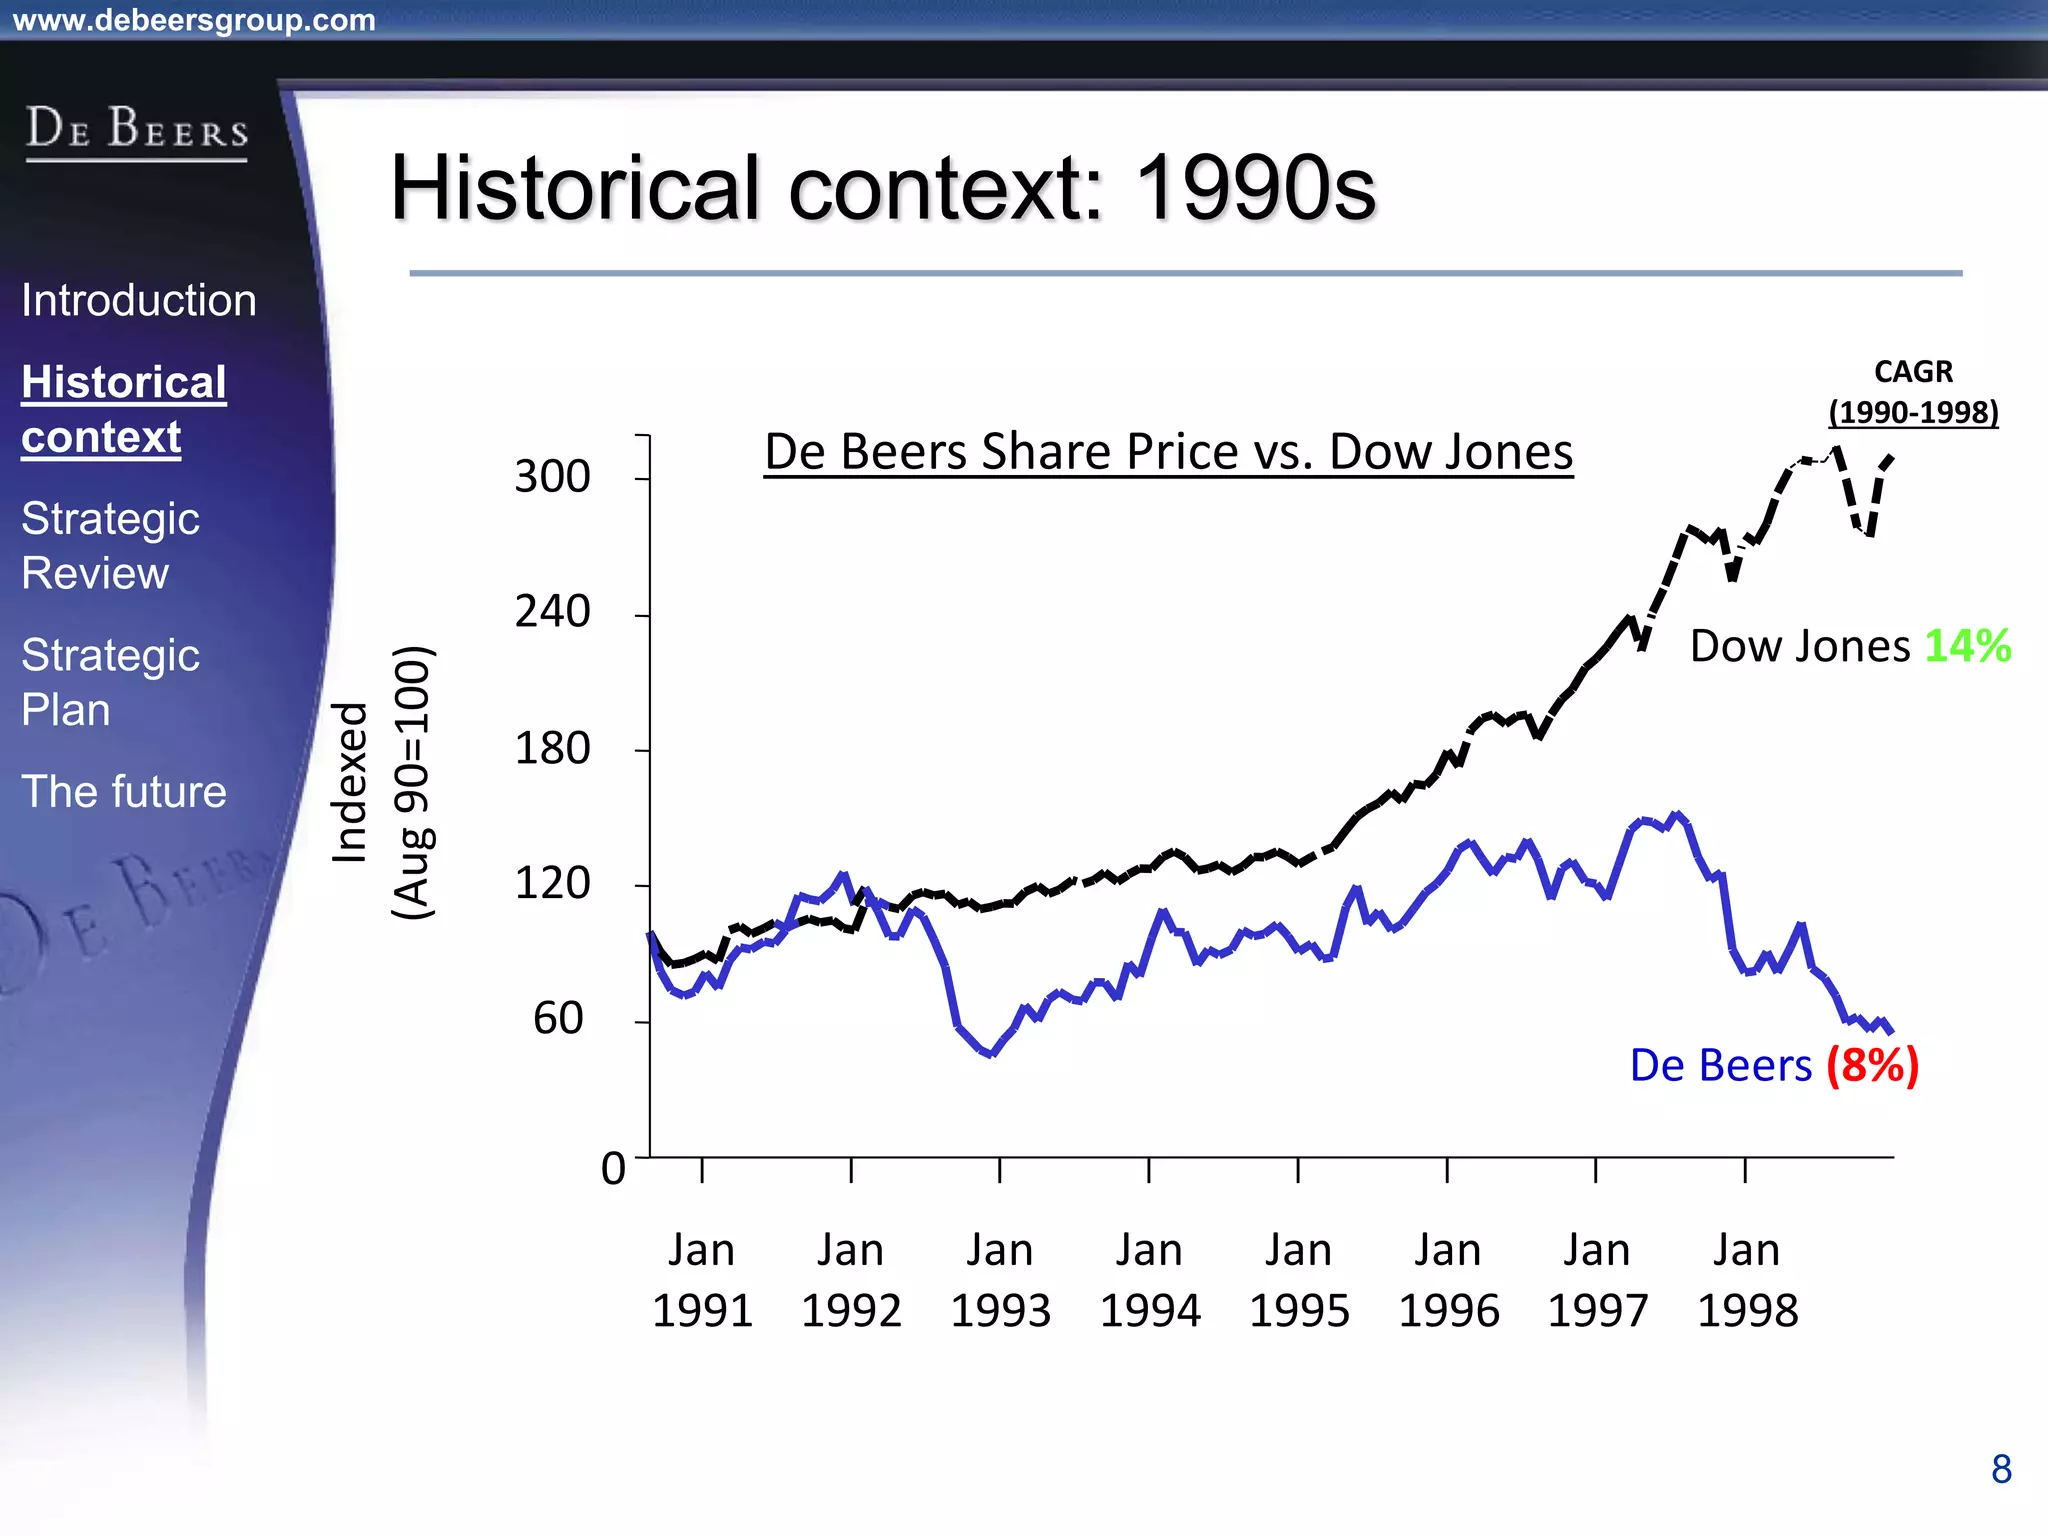


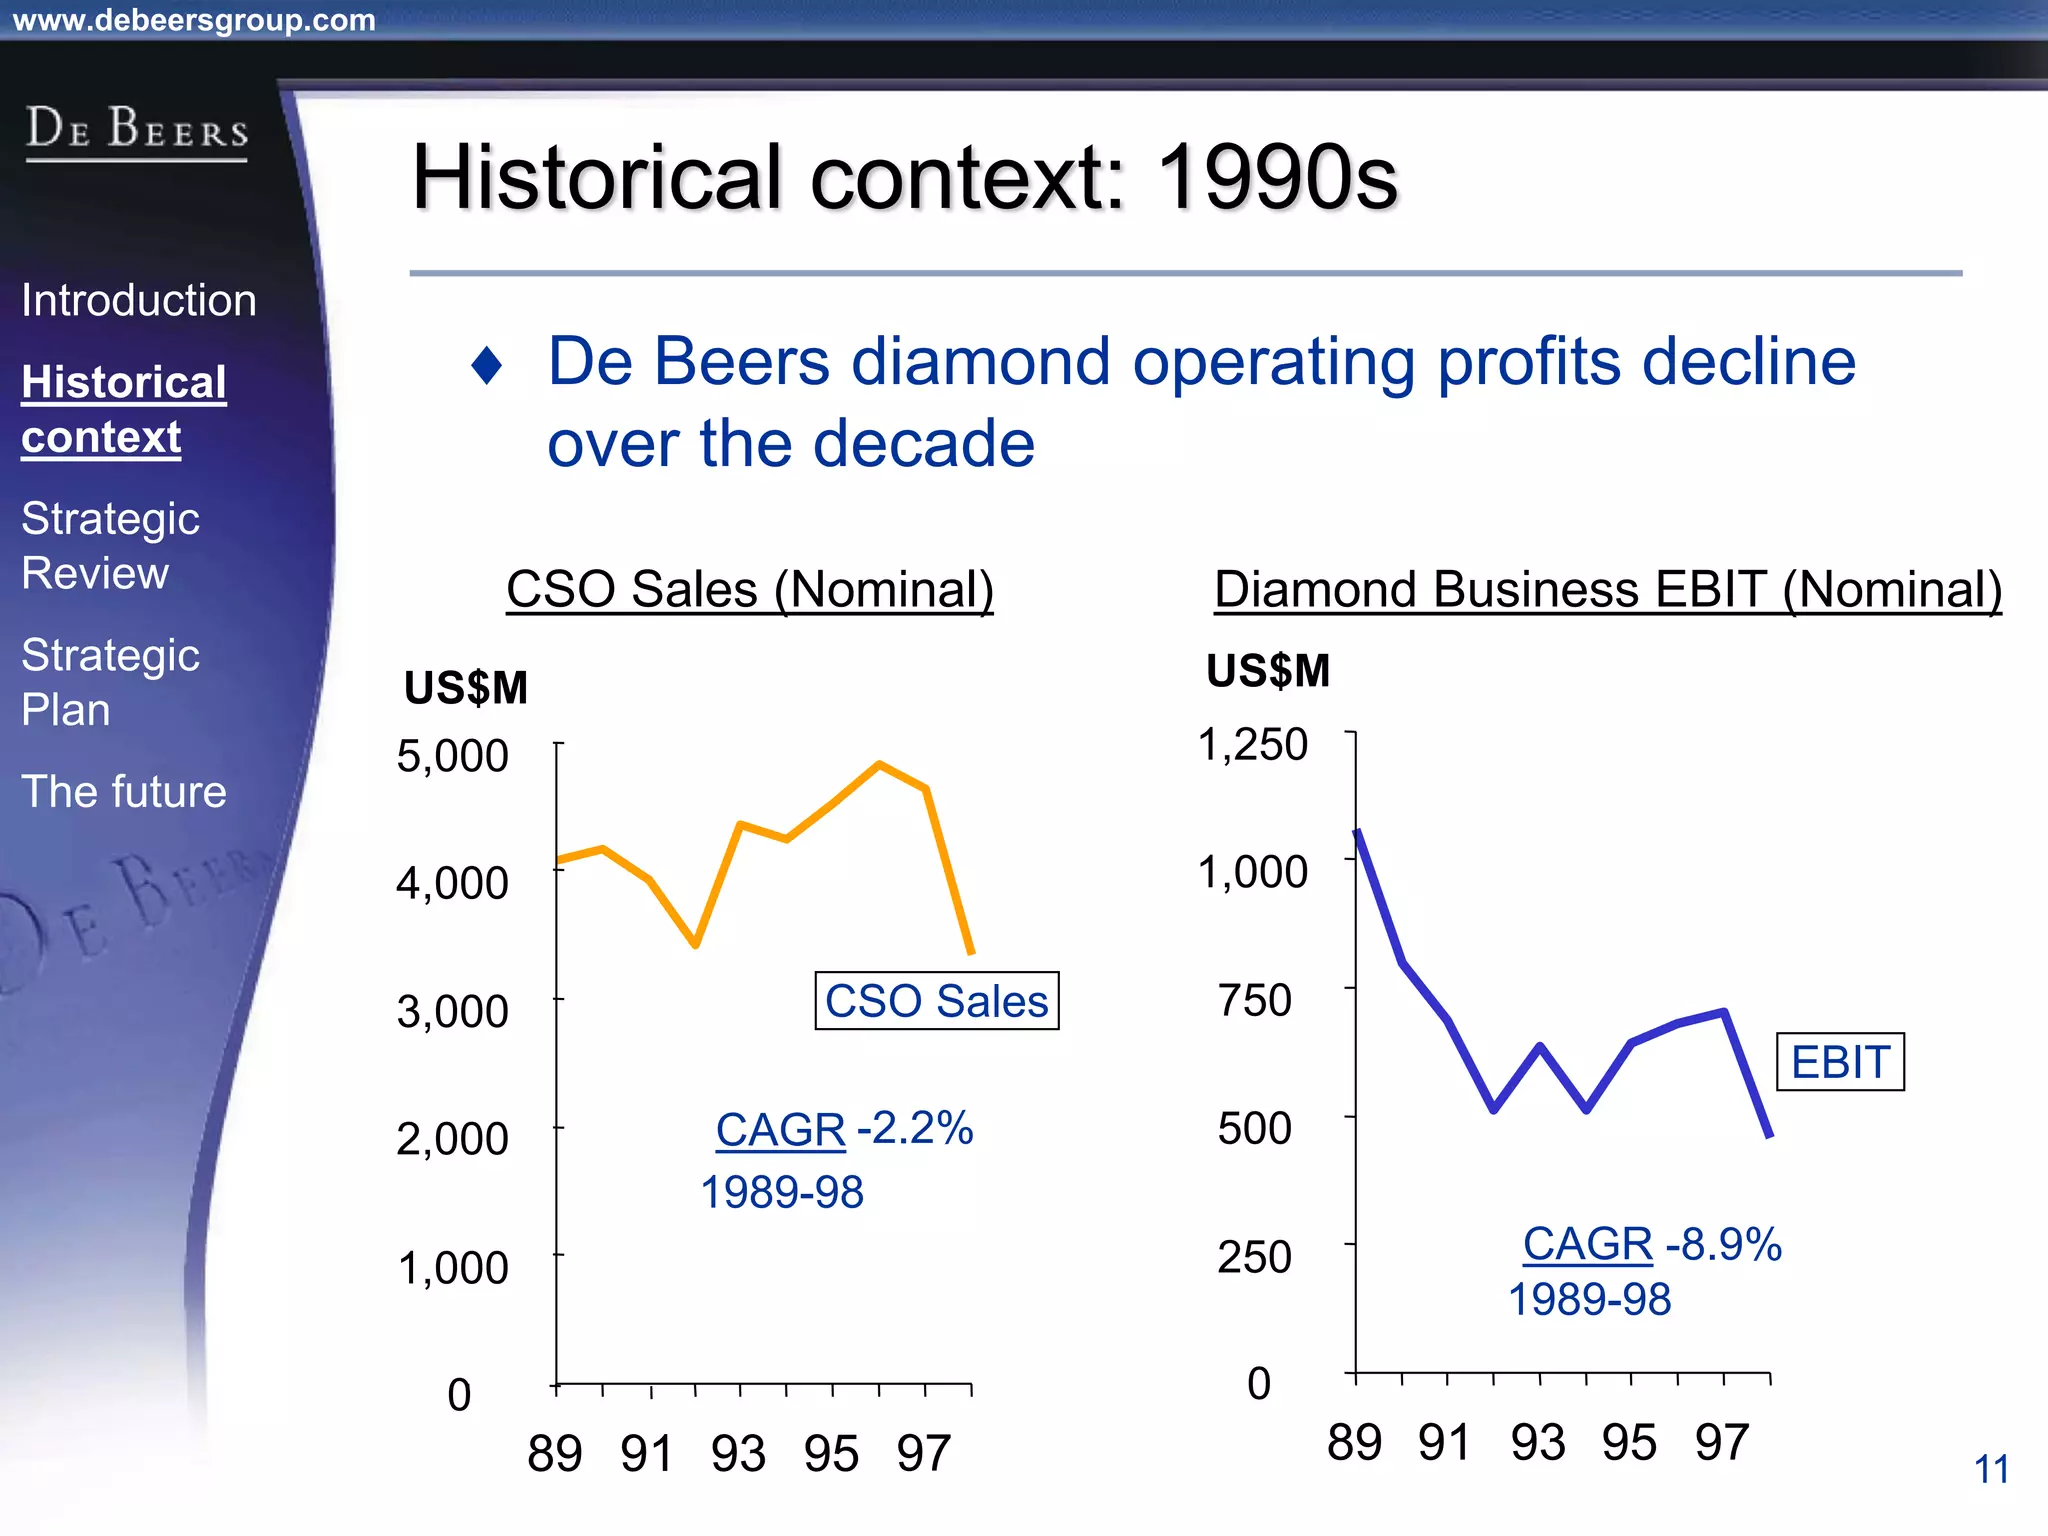
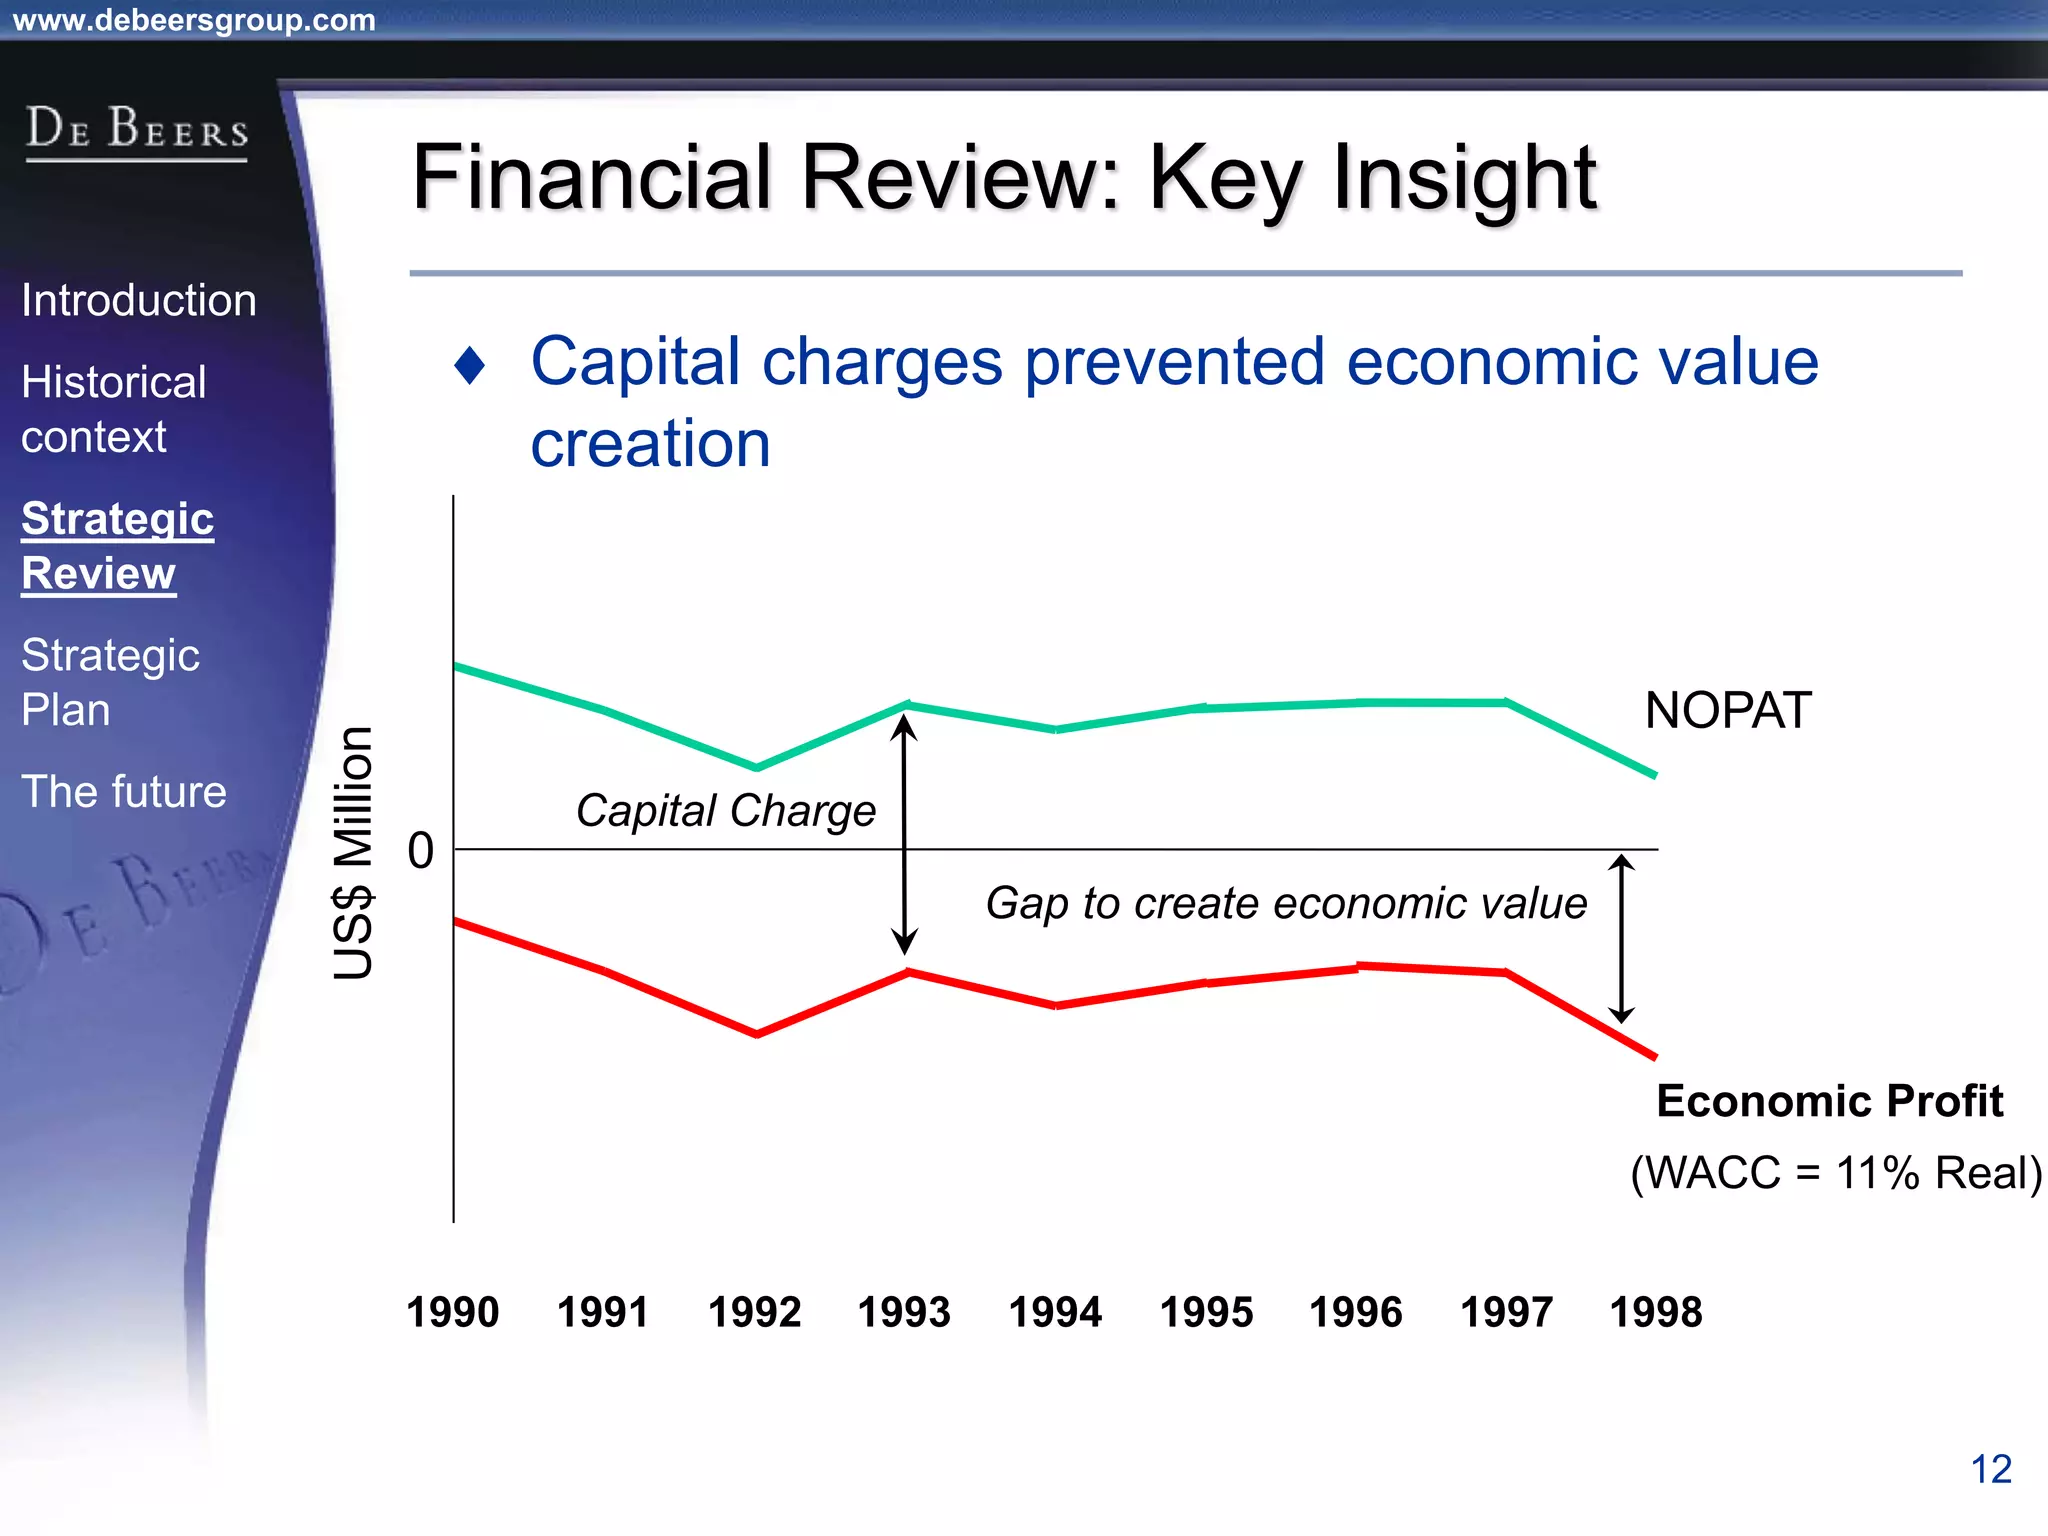


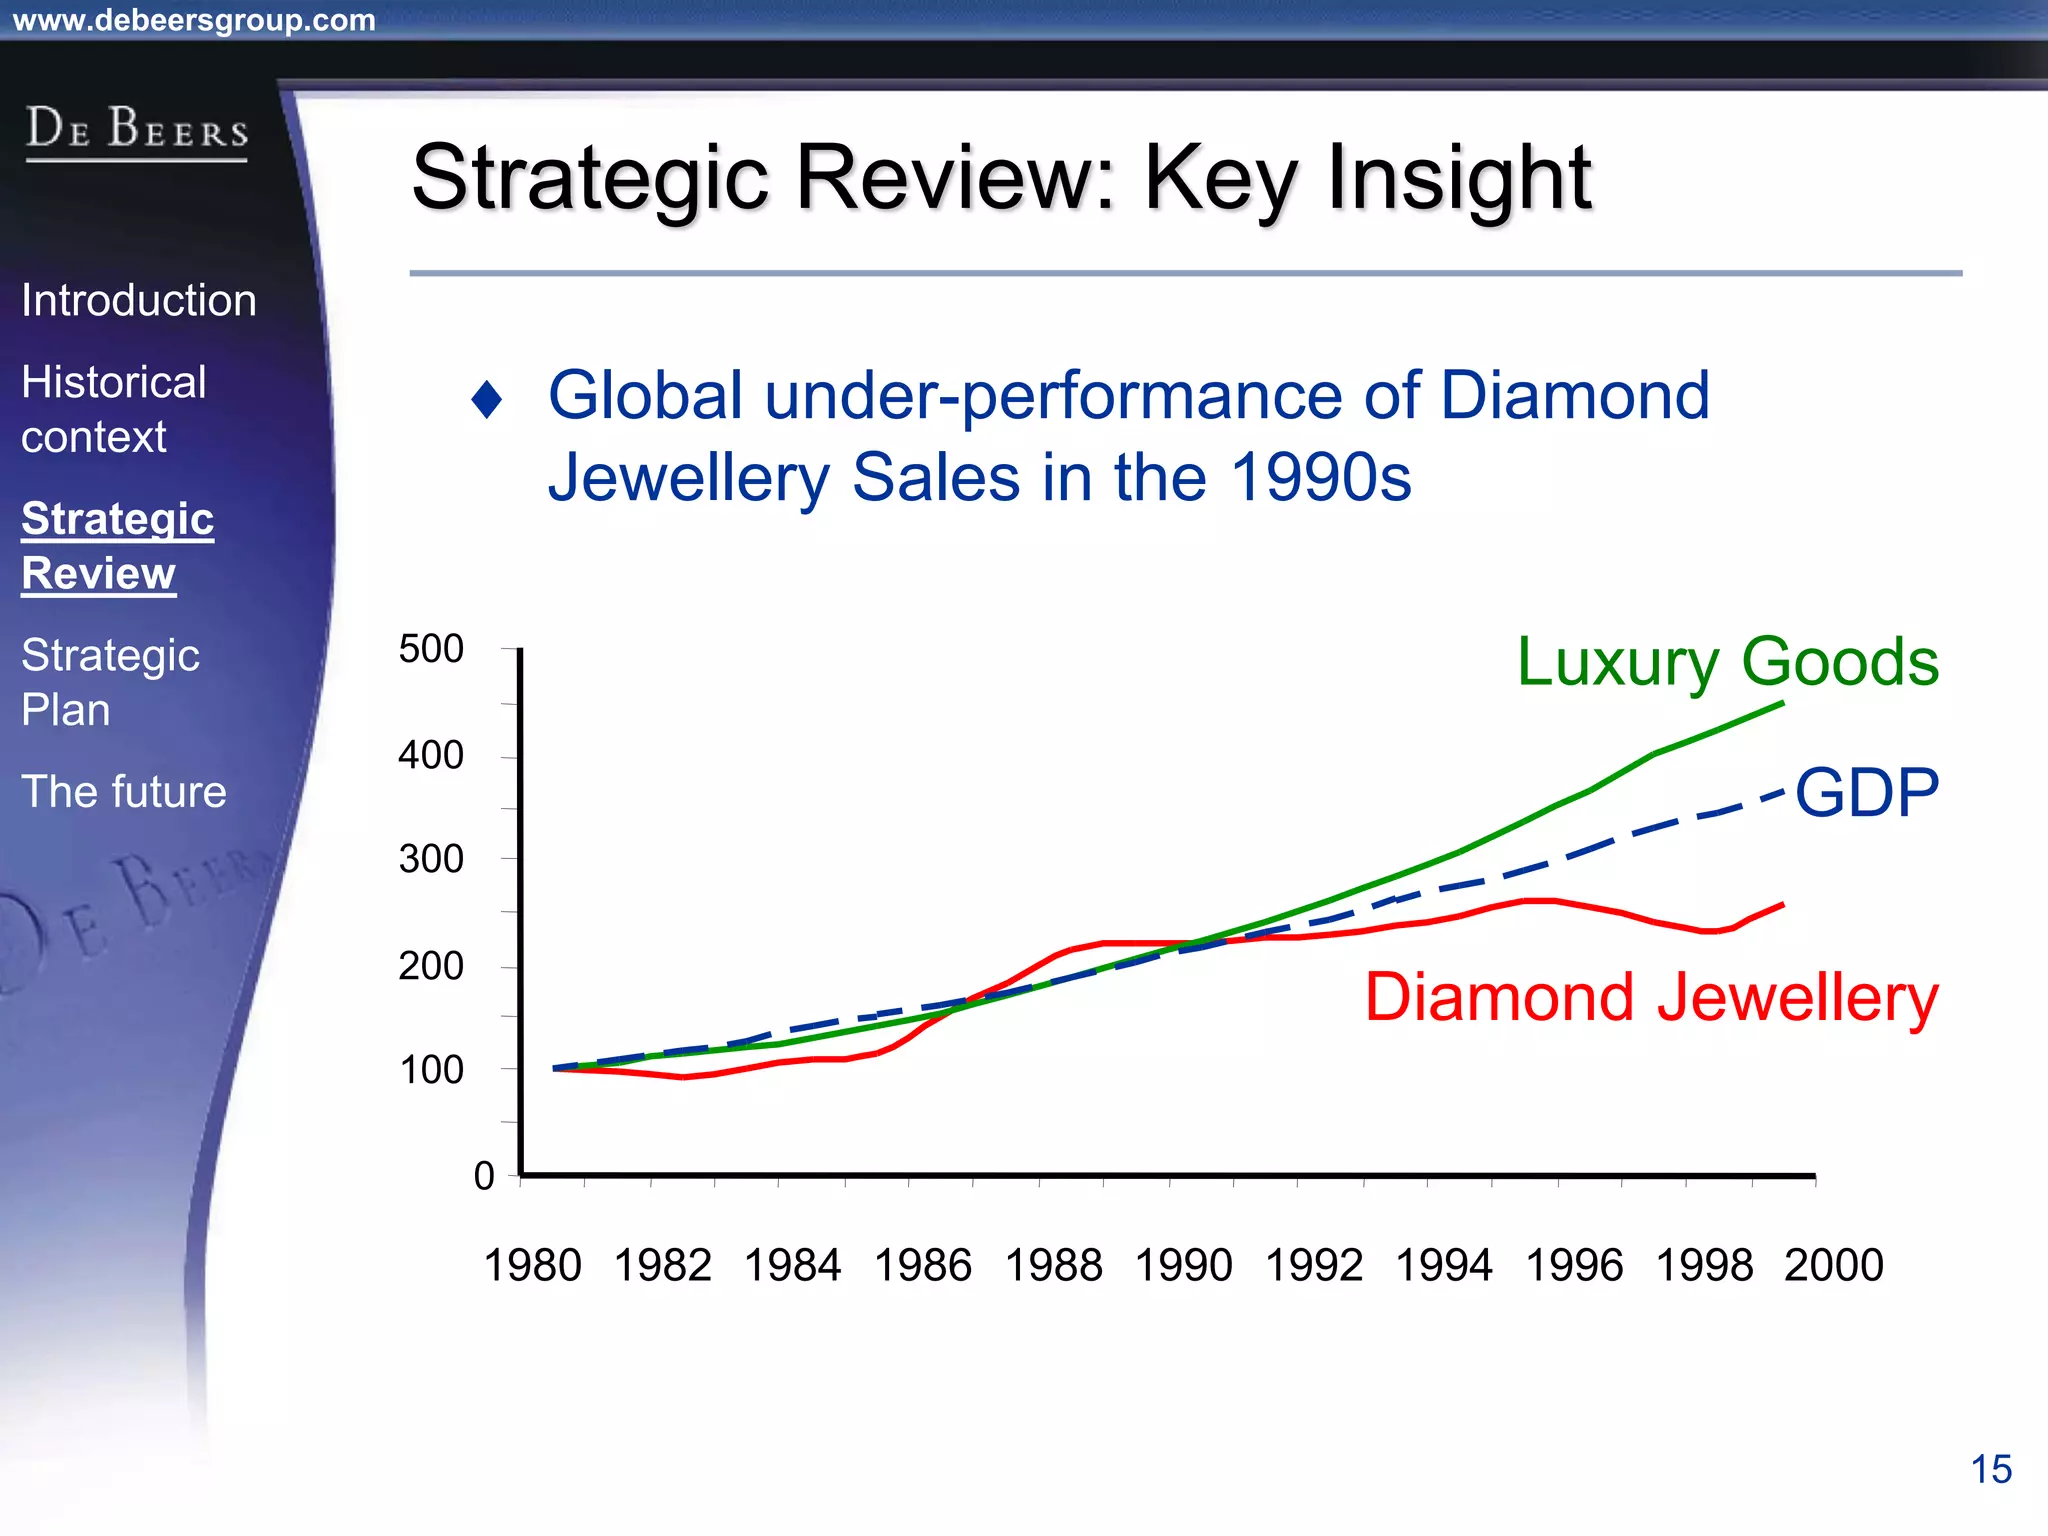


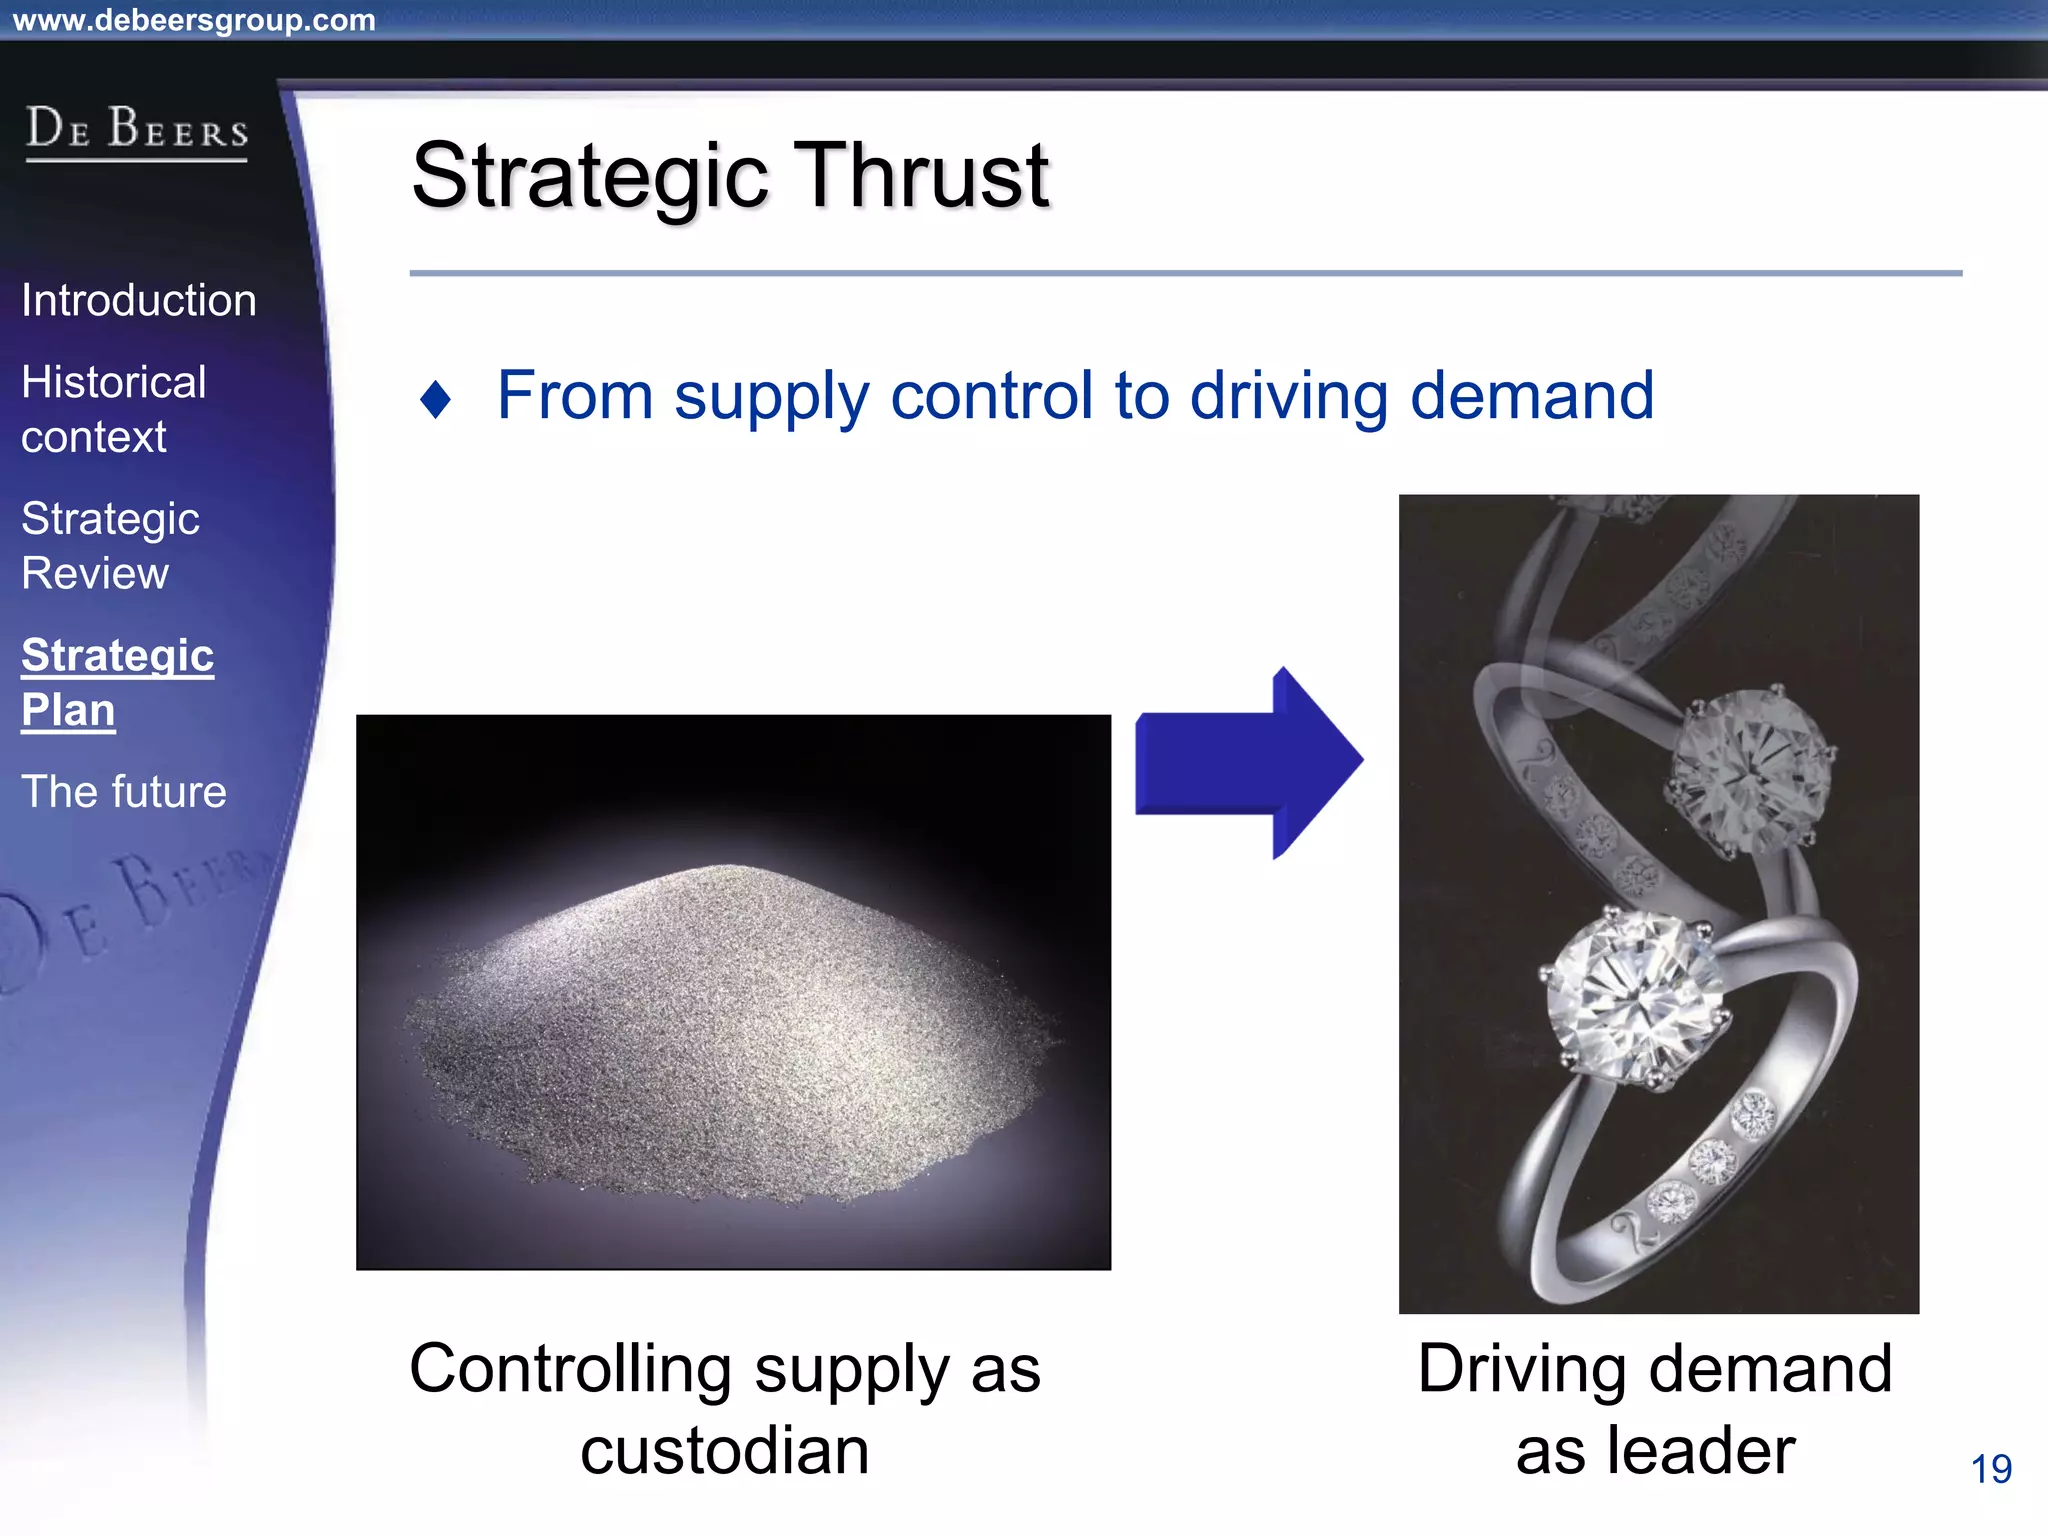


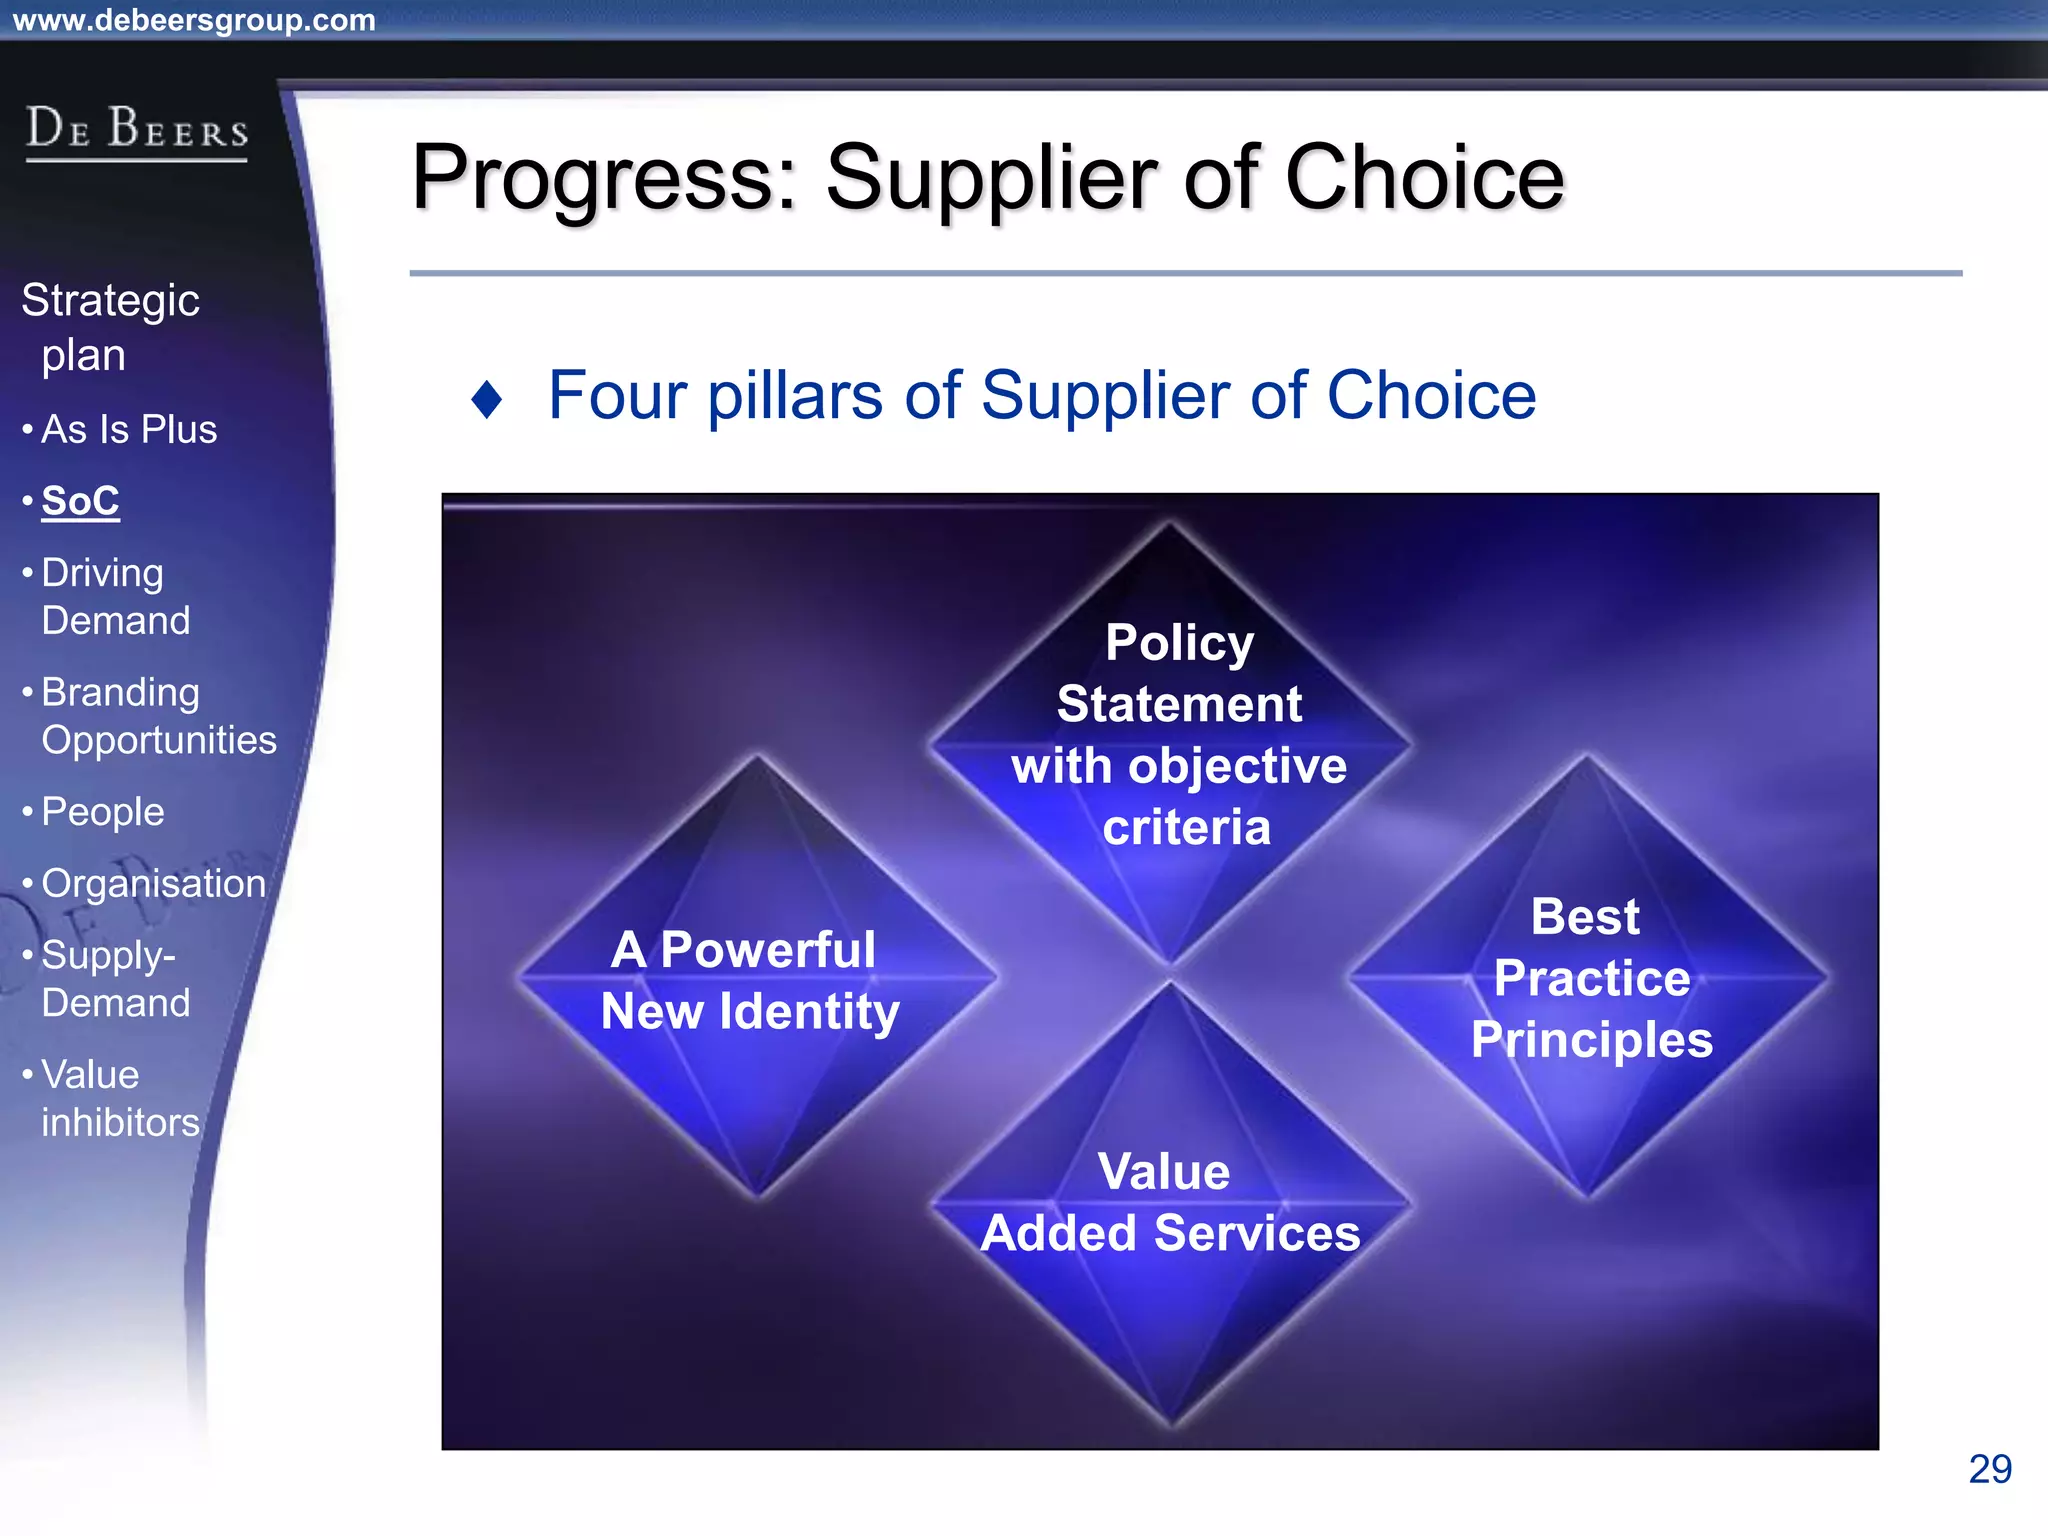

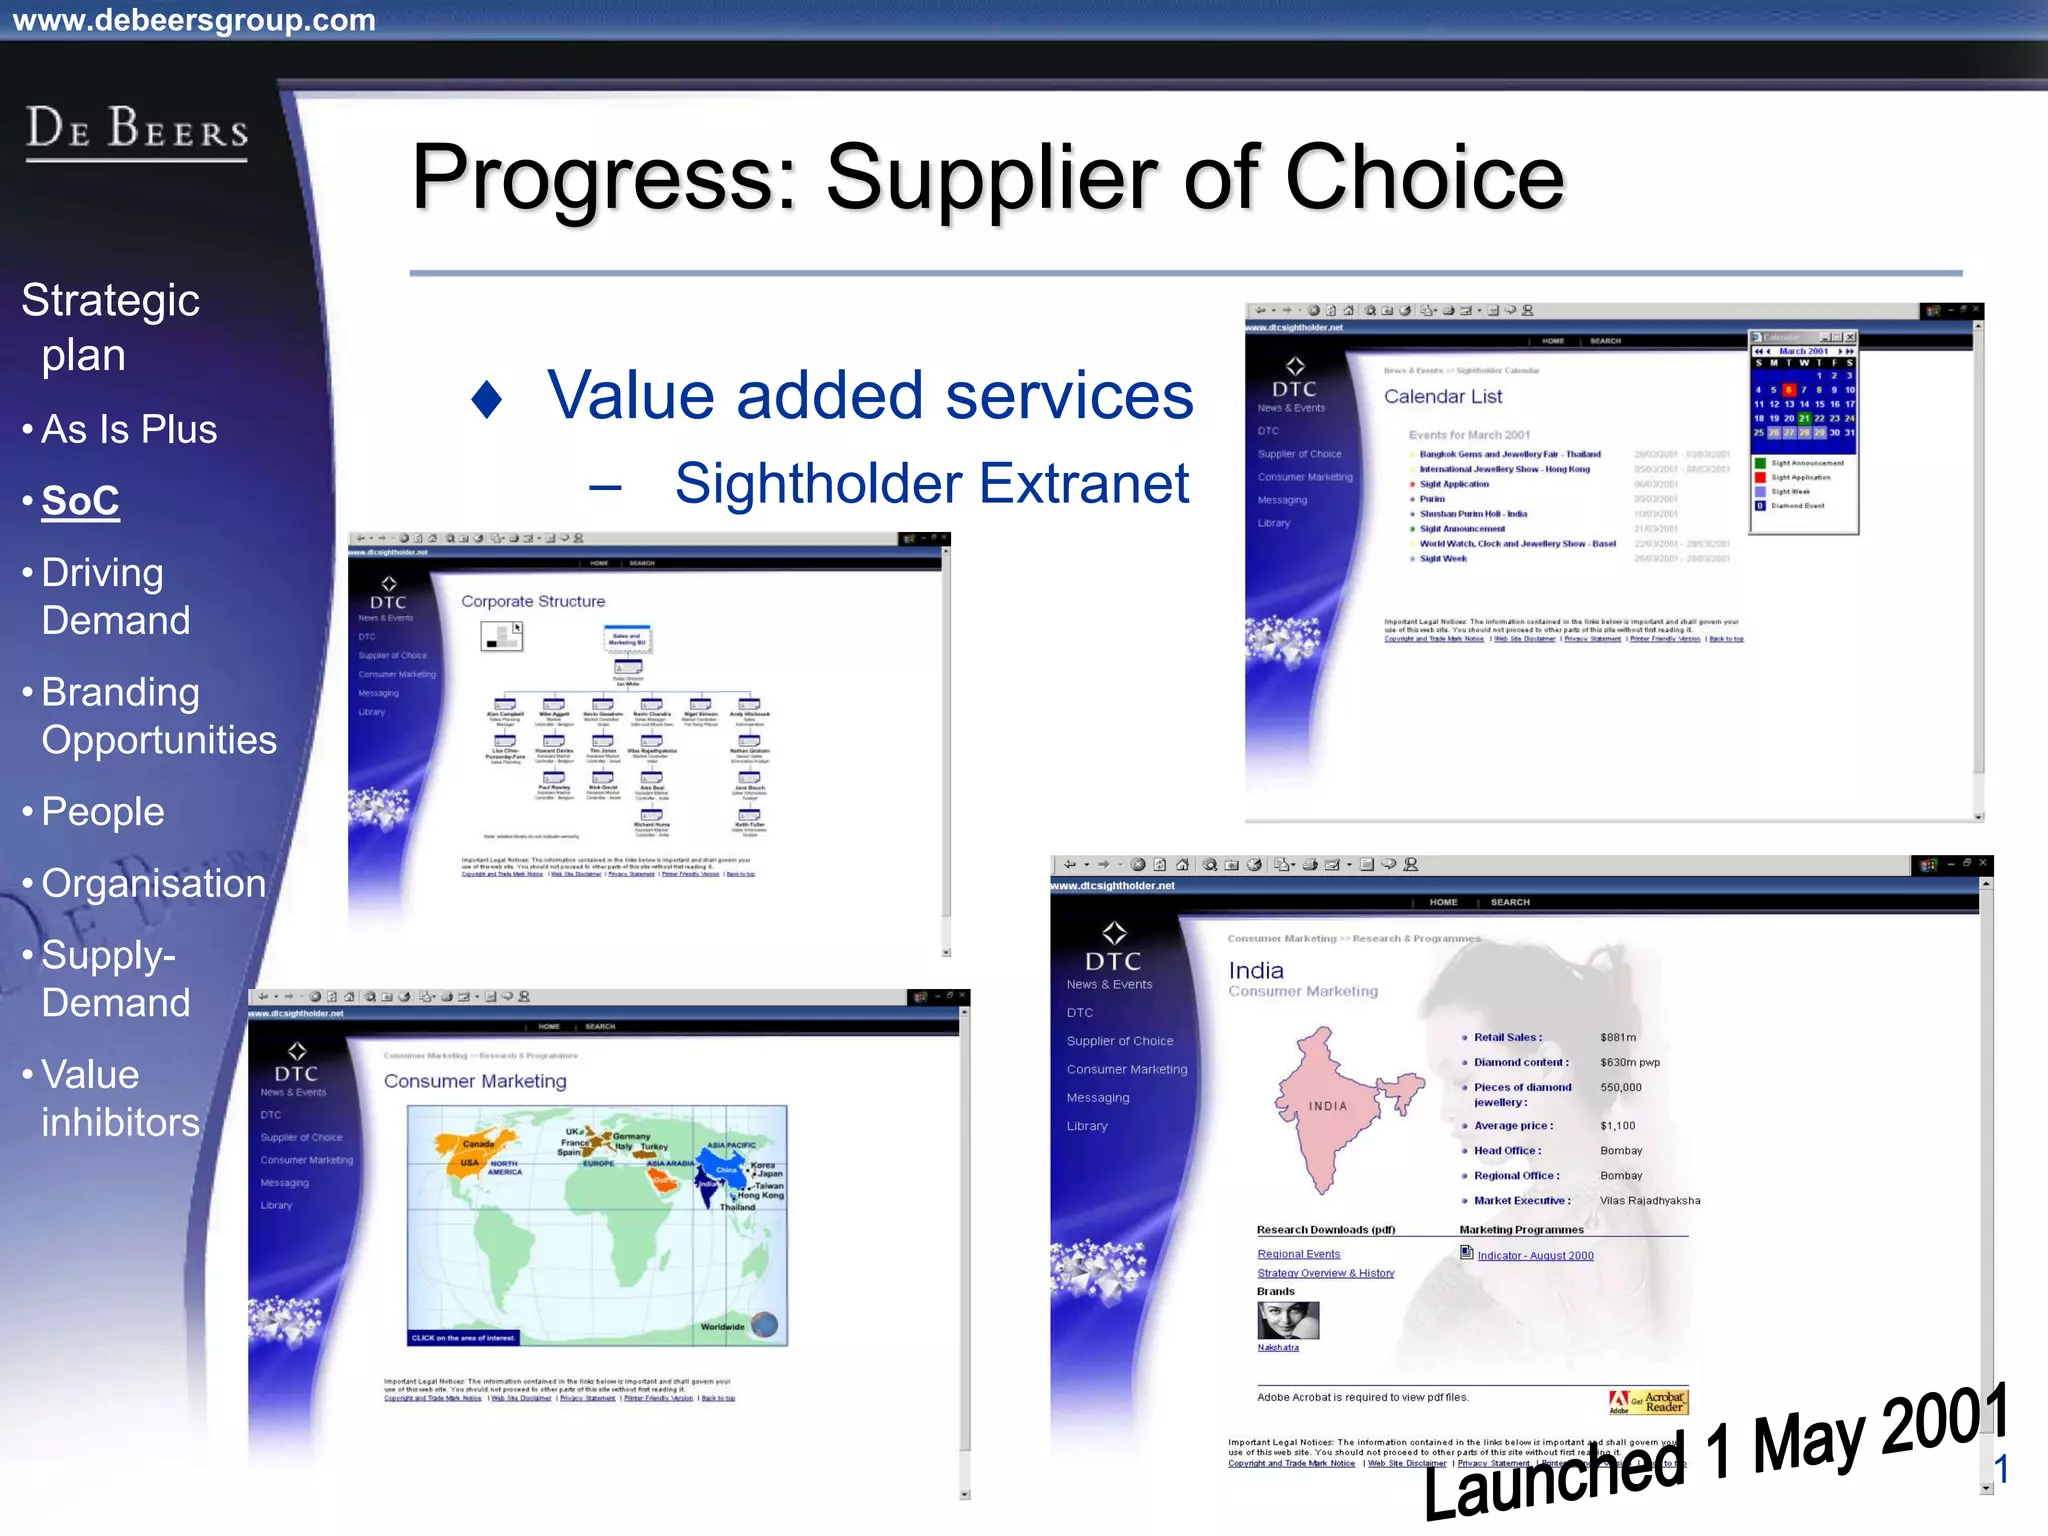

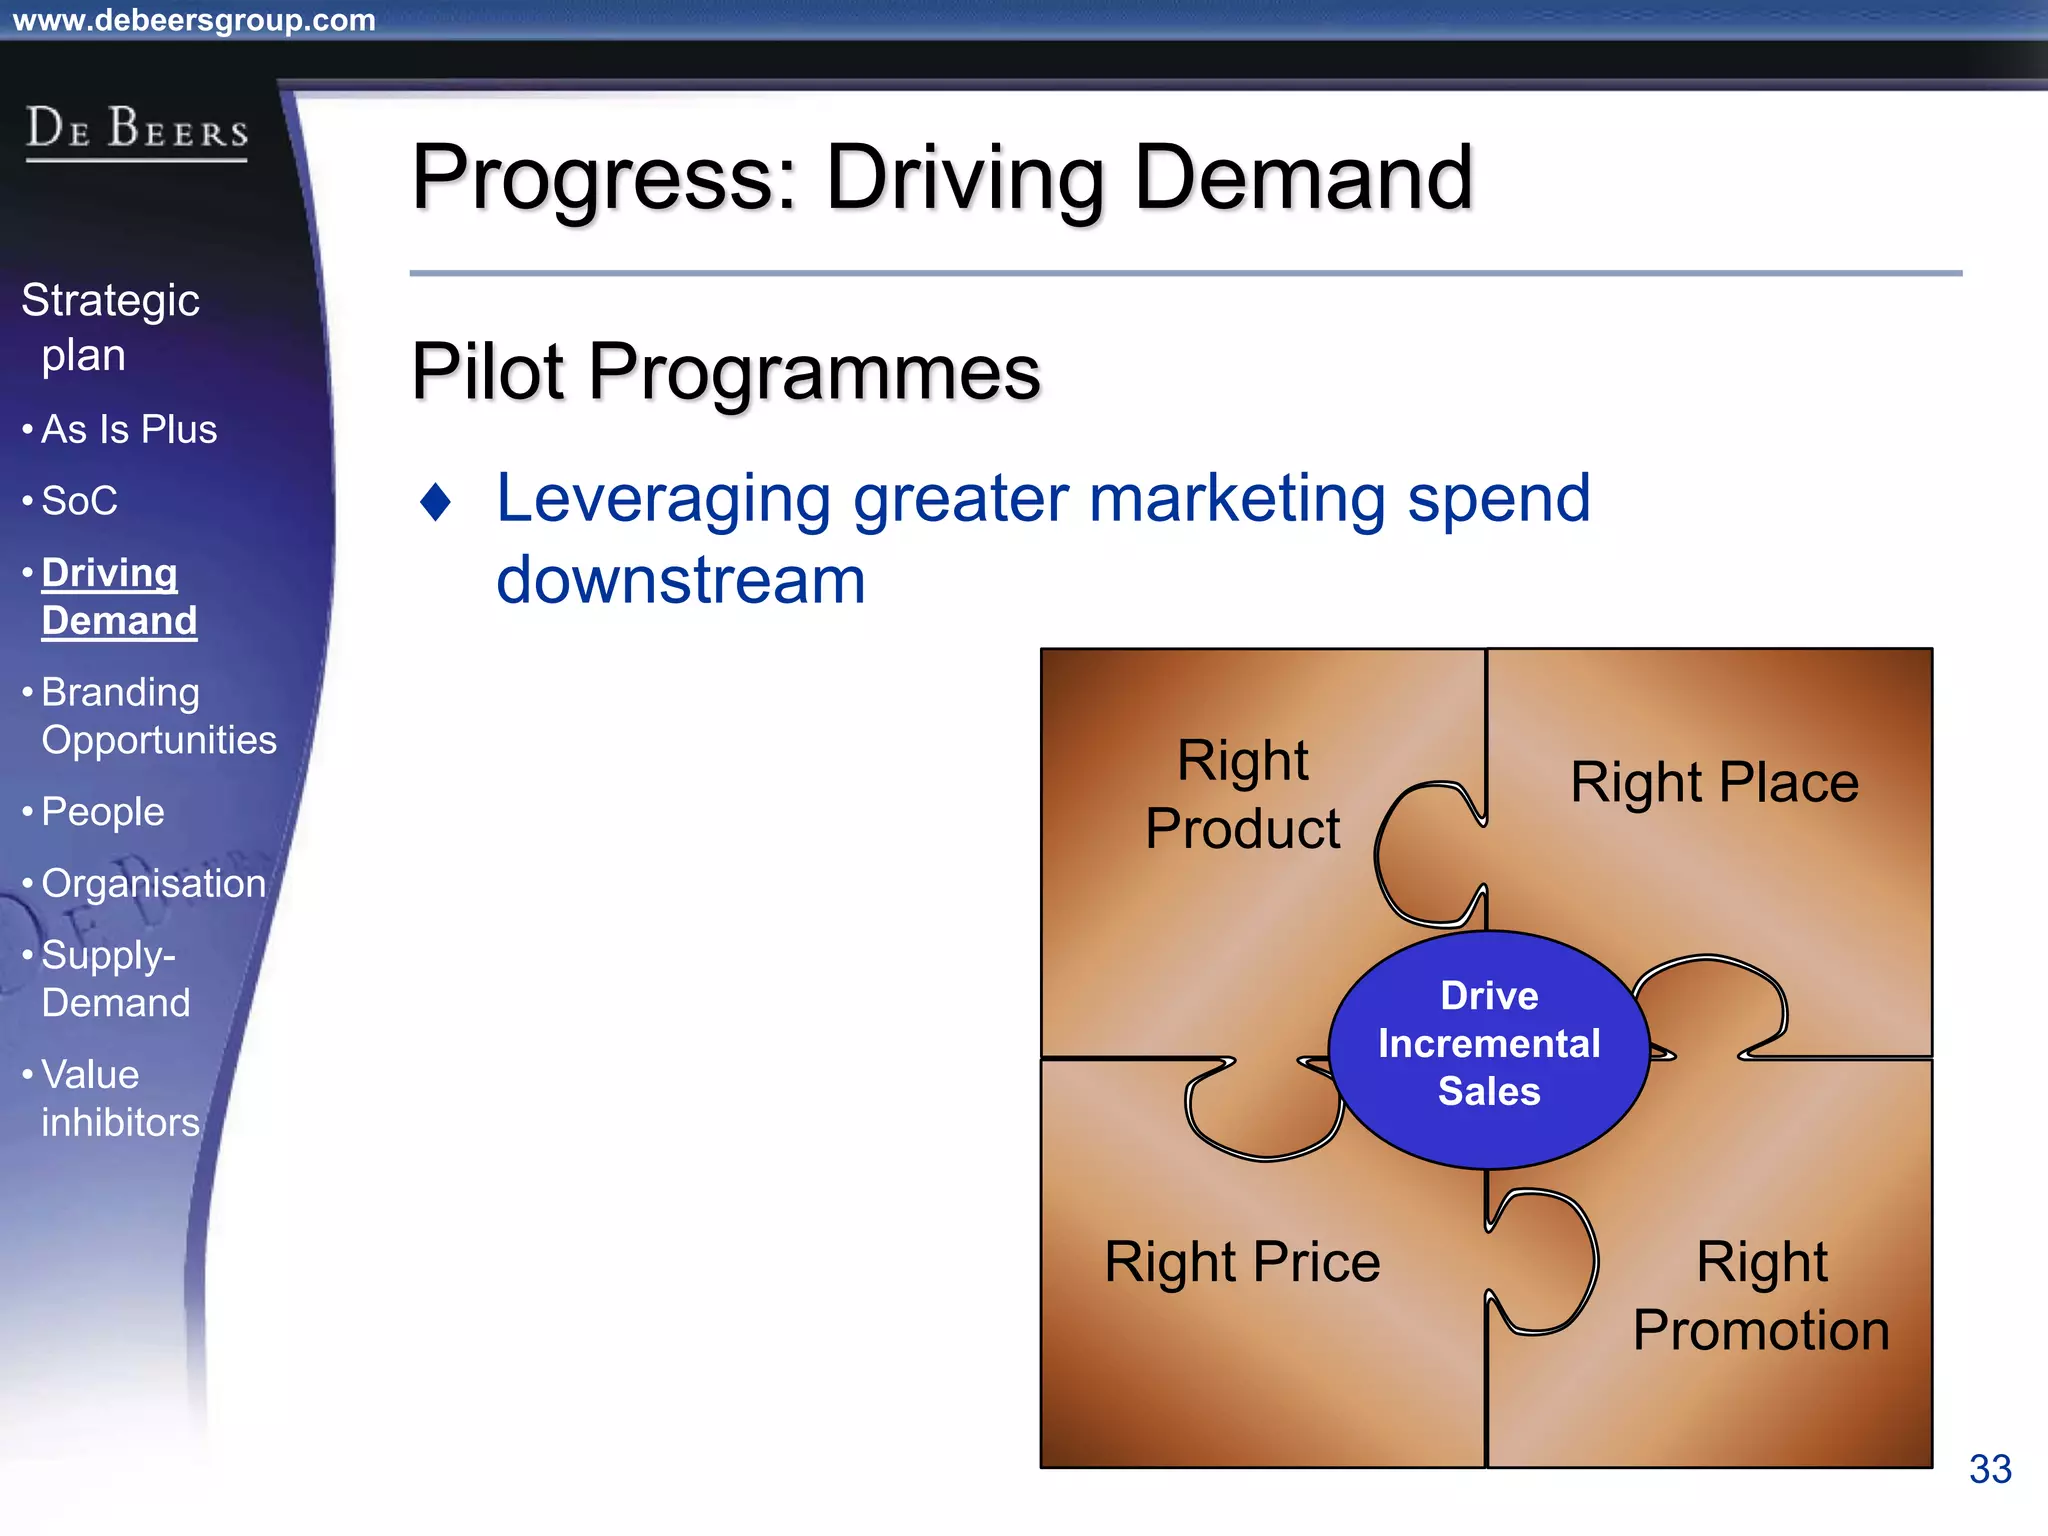


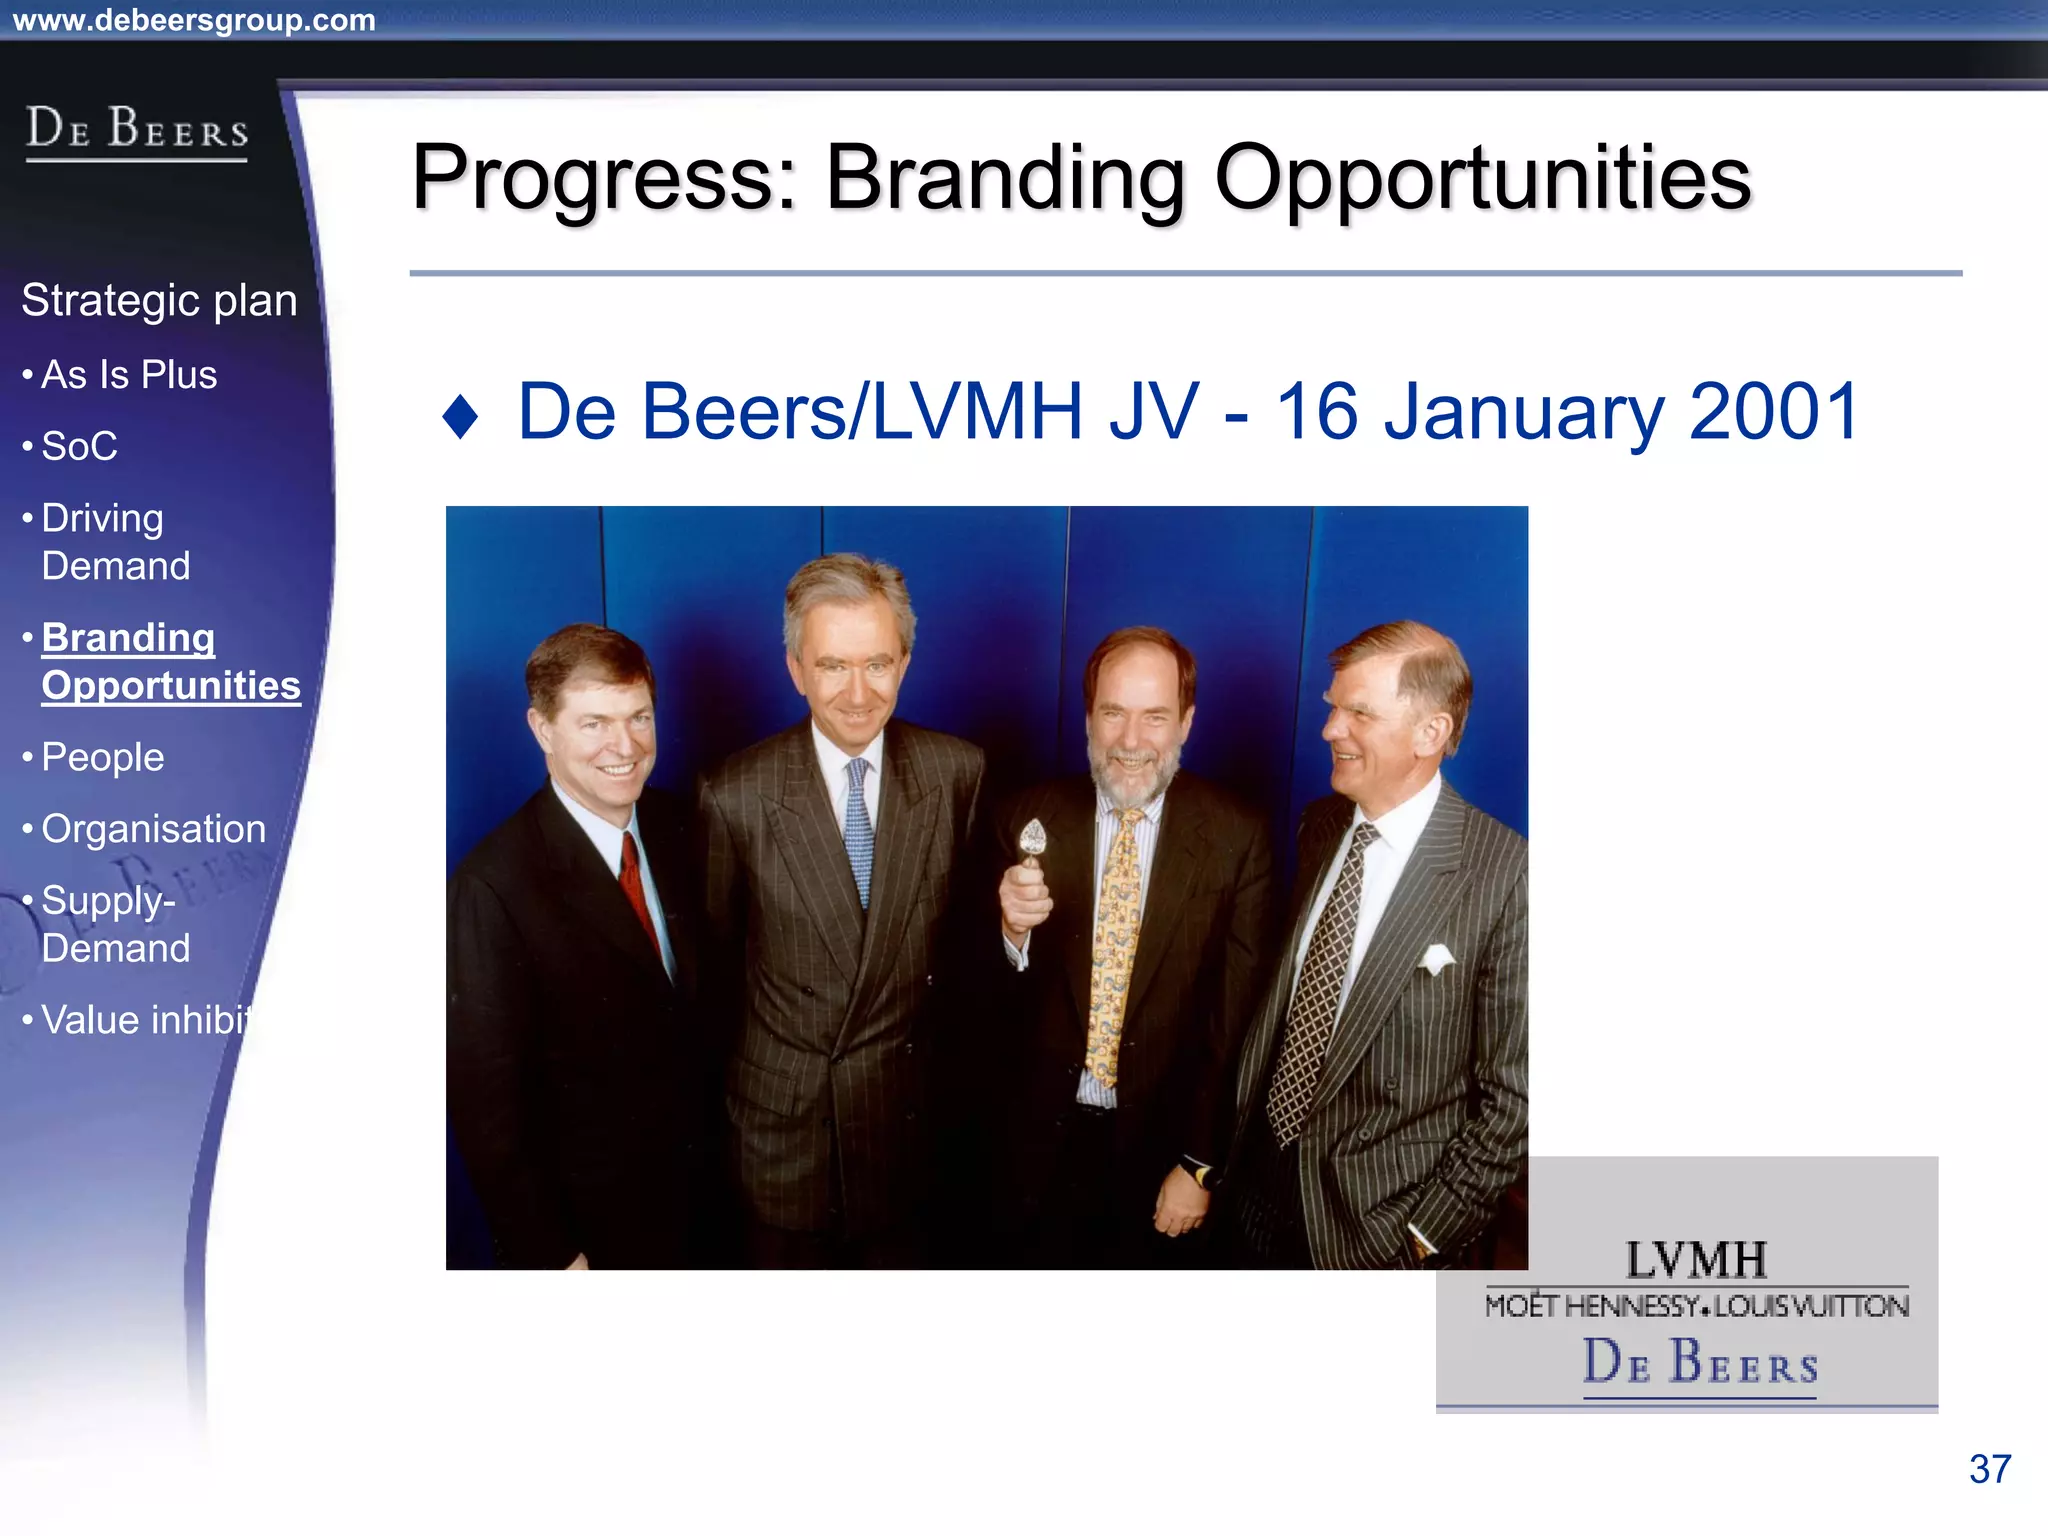


The document summarizes the transformation of De Beers from 1998-2001. It outlines the company's strategic review process which found that De Beers needed to shift from supply control to driving demand. The resulting strategic plan focused on becoming a supplier of choice, driving greater demand through marketing, and developing brands like De Beers to increase sales. Initial progress included the Forevermark identity, value-added services for sightholders, and demand driving pilots.


