the time year 5 arrived at School
•Download as XLS, PDF•
0 likes•158 views

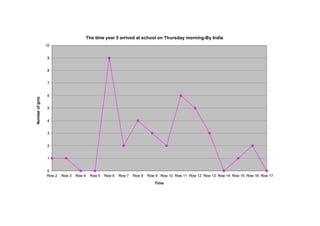
The document shows a line graph tracking the number of girls arriving at school over time on a Thursday morning. The x-axis shows 15-minute intervals from 7:30 to 8:45 and the y-axis tracks the number of girls from 0 to 10. Most girls (9) arrived between 7:50-7:55, with fewer (0-6) arriving both before and after that time period.
Report
Share
Report
Share

Recommended
Ing. Geologo Fernando Vargas
Este currículum vitae detalla la información personal y profesional de Fernando Mauricio Vargas Fermín, un ingeniero geólogo chileno. Se graduó de la Universidad de Oriente en Venezuela con un título de Ingeniero Geólogo. Ha trabajado en varias organizaciones venezolanas como C.V.G. Ferrominera Orinoco realizando tareas de clasificación de muestras, interpretación de imágenes y digitalización de datos. También ha tomado varios cursos y asistido a congresos geológicos.
Republican Party of Texas 2010
The document summarizes photos taken at the 2010 Texas Republican state convention in Dallas, showing various politicians, delegates, and events including Gov. Rick Perry and Sen. Kay Bailey Hutchison appearing together after their primary race, delegates voting and discussing party leadership races, congressional candidates campaigning, and Steve Munisteri celebrating after being elected as the new chairman of the Texas GOP.
Klimatbluffen! rödgröna klimatlöften utan täckning!
Centerpartiets rapport om Miljöpartiets klimatbluff
Presentaciones grupoos:Tenis y padel. 1º ESO 2012-13
El documento resume las reglas básicas y los orígenes del tenis. El tenis se originó del juego de mano medieval y se convirtió en el "Deporte de los Reyes" en el siglo XVI en Francia. Se juega individualmente o en dobles en una cancha dividida por una red, y el objetivo es anotar puntos golpeando la pelota sobre la red a la cancha del oponente.
Biology review
This document provides a review of key concepts from chemistry of life, cell biology, genetics, and evolution. It defines organic compounds and the six elements that make up living things. It describes the four major categories of organic molecules and their structures and functions. It also reviews cell structures, organelles, and the differences between prokaryotic and eukaryotic cells. Genetic concepts like DNA, genes, mutations, and Mendelian genetics are summarized. Finally, it defines evolution by natural selection and provides evidence to support the theory of evolution.
How to alienate and reduce your followers
The document discusses social media etiquette and strategies for businesses. It advises communicating professionally and avoiding spamming followers to maintain reputation. Additionally, it emphasizes knowing one's social graph to craft a successful social media strategy. The company provides social media education, training, consultancy and administrative support services to help clients integrate social media into their existing marketing.
e-commerce stockholm 2014 – Dra nytta av ditt varumärke
Det är förvånande att många företag inte intresserar sig för hur deras målgrupp fungerar tillsammans med varumärket. I en tid då e-handel gör det möjligt att jämföra priser och produkter glöms ofta potentialen i varumärket bort. Genom att berätta varför du säljer det du säljer istället för att bara prata om priset blir du tydligare och mer trovärdig. Jonas Lyckstedt, Planner på Spoon
Seleccion de objetos
El documento explica que para realizar cualquier operación sobre un objeto en un programa, primero se debe seleccionar el objeto haciendo clic en él. Una vez seleccionado, el objeto mostrará una cruz en el centro y ocho manejadores en las esquinas y puntos intermedios que definen el cuadro de selección del objeto.
PRESENTACIÓN DE REFLECTIONS EN LA GALERÍA ARTE 10
El documento describe la inauguración de una exposición de acrílicos del artista Guru Josh del 18 al 28 de febrero en una galería de arte en Madrid. La galería está celebrando su 25 aniversario especializándose en arte moderno y contemporáneo. La inauguración incluyó la instalación de las obras, fotografías, preparativos, una actuación en vivo para un gran público.
คำชมเชย
คำชมเชย
1.มีข้อมูลที่สมบูรณ์และครบถ้วน
2.ตั้งคำถามได้กระชับ
3.รูปแบบการนำเสนอน่าสนใจ
4.นำเสนอได้เสียงดังฟังชัด
5.ใช้เวลาในการนำเสนอน้อย
คำแนะนำ
1.ควรมีข้อมูลที่ถูกต้อง
2.ควรมีบุคลิกภาพที่ดีในการออกนำเสนอหน้าชั้นเรียน
3.คำถามบางคำถามมีความยากเกินไป
4.ควรมีความพร้อมในการนำเสนอให้ดีกว่านี้
5.ควรศึกษาข้อมูลก่อนที่จะนำเสนอ
ข้อยาก
7.คำสั่ง putchar( ) แสดงผลข้อมูลจากหน่วยความจำของตัวแปรทางจอภาพได้ครั้งละกี่อักขระ
ก.1อักขระ ข.2อักขระ
ค.3อักขระ ง.4อักขระ
ข้อง่าย
5.คำสั่ง printf( )เป็นคำสั่งอะไร
ก.ชนิดข้อมูลแบบพื้นฐาน ข.คำสั่งแสดงผล ค.คำสั่งประมวลผล ง.คำสั่งเก็บข้อมูล
นางสาว มนัสนันต์ ทับทิมใส เลขที่34 ม.6/3
คำชมเชย
1.มีเนื้อหาที่เข้าใจได้ง่าย
2.เพาว์เวอร์พอยมีความสวยงาม น่าสนใจ
3.มีคำพูดชัดเจนในการนำเสนอหน้าชั้น
4.มีการนำเสนอที่เสียงดังฟังชัด
5.ใช้เวลาน้อยในการนำเสนอในการนำเสนอทำให้ไม่เสียเวลา
คำแนะนำ
1.ควรมีบุคลิกภาพที่ดีในการพูด
2.ไม่ควรมีข้อความผิด
3.ควรมีความรู้ก่อนที่จะออกมานำเสนอ
4.ควรเตรียมตัวให้พร้อมก่อนที่จะออกมานำเสนอ
5.คำถามบางข้อยากเกินไป
ข้อยาก
7.คำสั่ง putchar( ) แสดงผลข้อมูลจากหน่วยความจำของตัวแปรทางจอภาพได้ครั้งละกี่อักขระ
ก.1อักขระ ข.2อักขระ
ค.3อักขระ ง.4อักขระ
ข้อง่าย
5.คำสั่ง printf( )เป็นคำสั่งอะไร
ก.ชนิดข้อมูลแบบพื้นฐาน ข.คำสั่งแสดงผล ค.คำสั่งประมวลผล ง.คำสั่งเก็บข้อมูล
นางสาว ทิพย์วรรณ เชื้อวงษ์ เลขที่ 32 ม.6/3
Ntics
El documento discute la importancia de integrar las tecnologías de la información y la comunicación (TIC) en la educación. Explica que solo usar la pizarra y el tizón ya no es suficiente hoy en día y los estudiantes están perdiendo interés. Las TIC brindan beneficios económicos, sociales, pedagógicos y culturales cuando se usan correctamente. Sin embargo, su impacto en la educación local aún no ha sido significativo. El documento aboga por usar las TIC como herramientas cognitivas para actividades colaborativ
NGN to mitigate Climate Change
Brief look at staus of Climate Change and impacts from/into ICTs. Identify the roles of NGN to mitigate climate change and prposed new model of ntwork architecture.
[Challenge:Future] Childhood Obesity
This document discusses childhood obesity as a major public health challenge that has reached epidemic proportions globally. One-third of the world's population under 18 is now overweight or obese, double the rate from the 1980s. The causes include unhealthy lifestyles like poor diet and inactivity, which are influenced by families, schools, and industries. Schools in particular must promote healthy behaviors to help address this issue and ensure kids grow up able to lead healthy lives.
Reporting to parents
This presentation was prepared for the Learning Media National Seminar for facilitators (April 2010). It explores the guidelines for reporting progress and achievement in relation to the national standards. It also looks at processes and practices to support effective reporting.
feb19-webservices3
This document discusses web services and JSON. It provides an overview of AJAX and how it uses XMLHttpRequest to asynchronously update parts of a web page without reloading. AJAX applications retrieve data from the server in the background and update the UI without interfering with the user experience. The document then discusses how JSON can be used with AJAX to transmit data between client and server, including embedding JSON in script tags or using the JSONRequest standard. Finally, it mentions some libraries and APIs that use JSON, such as Yahoo, jQuery and Google Maps.
PresentacióN De La Saligna
La saligna se puede utilizar para pisos de decks, frentes de decks, casillas de playa, pasarelas, escaleras y tachos de basura, ya que es una madera resistente y duradera apta para uso exterior.
Developing student portfolios using Adobe Acrobat X
This document discusses using Adobe Acrobat to develop student portfolios. It notes that student work comes in many forms, such as handwritten work, worksheets, typed documents, blogs, videos, and photographs. Adobe Acrobat provides a solution to organize all these different file types into a student portfolio. It also allows portfolios to contain files from other programs like Excel, Word, PDFs, and Google Docs. Screenshots then demonstrate what the student portfolios in Acrobat can look like. The document concludes by discussing teaching students to use Acrobat and different distribution options for the completed portfolios.
Just what is a TeachMeet and why should I care?
A seven minute presentation, titled Just what is a TeachMeet and why should I care? prepared for the QUT 2015 National Summit:
More Related Content
Viewers also liked
Presentaciones grupoos:Tenis y padel. 1º ESO 2012-13
El documento resume las reglas básicas y los orígenes del tenis. El tenis se originó del juego de mano medieval y se convirtió en el "Deporte de los Reyes" en el siglo XVI en Francia. Se juega individualmente o en dobles en una cancha dividida por una red, y el objetivo es anotar puntos golpeando la pelota sobre la red a la cancha del oponente.
Biology review
This document provides a review of key concepts from chemistry of life, cell biology, genetics, and evolution. It defines organic compounds and the six elements that make up living things. It describes the four major categories of organic molecules and their structures and functions. It also reviews cell structures, organelles, and the differences between prokaryotic and eukaryotic cells. Genetic concepts like DNA, genes, mutations, and Mendelian genetics are summarized. Finally, it defines evolution by natural selection and provides evidence to support the theory of evolution.
How to alienate and reduce your followers
The document discusses social media etiquette and strategies for businesses. It advises communicating professionally and avoiding spamming followers to maintain reputation. Additionally, it emphasizes knowing one's social graph to craft a successful social media strategy. The company provides social media education, training, consultancy and administrative support services to help clients integrate social media into their existing marketing.
e-commerce stockholm 2014 – Dra nytta av ditt varumärke
Det är förvånande att många företag inte intresserar sig för hur deras målgrupp fungerar tillsammans med varumärket. I en tid då e-handel gör det möjligt att jämföra priser och produkter glöms ofta potentialen i varumärket bort. Genom att berätta varför du säljer det du säljer istället för att bara prata om priset blir du tydligare och mer trovärdig. Jonas Lyckstedt, Planner på Spoon
Seleccion de objetos
El documento explica que para realizar cualquier operación sobre un objeto en un programa, primero se debe seleccionar el objeto haciendo clic en él. Una vez seleccionado, el objeto mostrará una cruz en el centro y ocho manejadores en las esquinas y puntos intermedios que definen el cuadro de selección del objeto.
PRESENTACIÓN DE REFLECTIONS EN LA GALERÍA ARTE 10
El documento describe la inauguración de una exposición de acrílicos del artista Guru Josh del 18 al 28 de febrero en una galería de arte en Madrid. La galería está celebrando su 25 aniversario especializándose en arte moderno y contemporáneo. La inauguración incluyó la instalación de las obras, fotografías, preparativos, una actuación en vivo para un gran público.
คำชมเชย
คำชมเชย
1.มีข้อมูลที่สมบูรณ์และครบถ้วน
2.ตั้งคำถามได้กระชับ
3.รูปแบบการนำเสนอน่าสนใจ
4.นำเสนอได้เสียงดังฟังชัด
5.ใช้เวลาในการนำเสนอน้อย
คำแนะนำ
1.ควรมีข้อมูลที่ถูกต้อง
2.ควรมีบุคลิกภาพที่ดีในการออกนำเสนอหน้าชั้นเรียน
3.คำถามบางคำถามมีความยากเกินไป
4.ควรมีความพร้อมในการนำเสนอให้ดีกว่านี้
5.ควรศึกษาข้อมูลก่อนที่จะนำเสนอ
ข้อยาก
7.คำสั่ง putchar( ) แสดงผลข้อมูลจากหน่วยความจำของตัวแปรทางจอภาพได้ครั้งละกี่อักขระ
ก.1อักขระ ข.2อักขระ
ค.3อักขระ ง.4อักขระ
ข้อง่าย
5.คำสั่ง printf( )เป็นคำสั่งอะไร
ก.ชนิดข้อมูลแบบพื้นฐาน ข.คำสั่งแสดงผล ค.คำสั่งประมวลผล ง.คำสั่งเก็บข้อมูล
นางสาว มนัสนันต์ ทับทิมใส เลขที่34 ม.6/3
คำชมเชย
1.มีเนื้อหาที่เข้าใจได้ง่าย
2.เพาว์เวอร์พอยมีความสวยงาม น่าสนใจ
3.มีคำพูดชัดเจนในการนำเสนอหน้าชั้น
4.มีการนำเสนอที่เสียงดังฟังชัด
5.ใช้เวลาน้อยในการนำเสนอในการนำเสนอทำให้ไม่เสียเวลา
คำแนะนำ
1.ควรมีบุคลิกภาพที่ดีในการพูด
2.ไม่ควรมีข้อความผิด
3.ควรมีความรู้ก่อนที่จะออกมานำเสนอ
4.ควรเตรียมตัวให้พร้อมก่อนที่จะออกมานำเสนอ
5.คำถามบางข้อยากเกินไป
ข้อยาก
7.คำสั่ง putchar( ) แสดงผลข้อมูลจากหน่วยความจำของตัวแปรทางจอภาพได้ครั้งละกี่อักขระ
ก.1อักขระ ข.2อักขระ
ค.3อักขระ ง.4อักขระ
ข้อง่าย
5.คำสั่ง printf( )เป็นคำสั่งอะไร
ก.ชนิดข้อมูลแบบพื้นฐาน ข.คำสั่งแสดงผล ค.คำสั่งประมวลผล ง.คำสั่งเก็บข้อมูล
นางสาว ทิพย์วรรณ เชื้อวงษ์ เลขที่ 32 ม.6/3
Ntics
El documento discute la importancia de integrar las tecnologías de la información y la comunicación (TIC) en la educación. Explica que solo usar la pizarra y el tizón ya no es suficiente hoy en día y los estudiantes están perdiendo interés. Las TIC brindan beneficios económicos, sociales, pedagógicos y culturales cuando se usan correctamente. Sin embargo, su impacto en la educación local aún no ha sido significativo. El documento aboga por usar las TIC como herramientas cognitivas para actividades colaborativ
NGN to mitigate Climate Change
Brief look at staus of Climate Change and impacts from/into ICTs. Identify the roles of NGN to mitigate climate change and prposed new model of ntwork architecture.
[Challenge:Future] Childhood Obesity
This document discusses childhood obesity as a major public health challenge that has reached epidemic proportions globally. One-third of the world's population under 18 is now overweight or obese, double the rate from the 1980s. The causes include unhealthy lifestyles like poor diet and inactivity, which are influenced by families, schools, and industries. Schools in particular must promote healthy behaviors to help address this issue and ensure kids grow up able to lead healthy lives.
Reporting to parents
This presentation was prepared for the Learning Media National Seminar for facilitators (April 2010). It explores the guidelines for reporting progress and achievement in relation to the national standards. It also looks at processes and practices to support effective reporting.
feb19-webservices3
This document discusses web services and JSON. It provides an overview of AJAX and how it uses XMLHttpRequest to asynchronously update parts of a web page without reloading. AJAX applications retrieve data from the server in the background and update the UI without interfering with the user experience. The document then discusses how JSON can be used with AJAX to transmit data between client and server, including embedding JSON in script tags or using the JSONRequest standard. Finally, it mentions some libraries and APIs that use JSON, such as Yahoo, jQuery and Google Maps.
PresentacióN De La Saligna
La saligna se puede utilizar para pisos de decks, frentes de decks, casillas de playa, pasarelas, escaleras y tachos de basura, ya que es una madera resistente y duradera apta para uso exterior.
Viewers also liked (20)
Presentaciones grupoos:Tenis y padel. 1º ESO 2012-13
Presentaciones grupoos:Tenis y padel. 1º ESO 2012-13
e-commerce stockholm 2014 – Dra nytta av ditt varumärke
e-commerce stockholm 2014 – Dra nytta av ditt varumärke
Gnist et partnerskap for en helhetlig lærersatsing generell
Gnist et partnerskap for en helhetlig lærersatsing generell
More from Roseville College
Developing student portfolios using Adobe Acrobat X
This document discusses using Adobe Acrobat to develop student portfolios. It notes that student work comes in many forms, such as handwritten work, worksheets, typed documents, blogs, videos, and photographs. Adobe Acrobat provides a solution to organize all these different file types into a student portfolio. It also allows portfolios to contain files from other programs like Excel, Word, PDFs, and Google Docs. Screenshots then demonstrate what the student portfolios in Acrobat can look like. The document concludes by discussing teaching students to use Acrobat and different distribution options for the completed portfolios.
Just what is a TeachMeet and why should I care?
A seven minute presentation, titled Just what is a TeachMeet and why should I care? prepared for the QUT 2015 National Summit:
Ban boring homework use blogging instead- The abbreviated version
Ban boring homework use blogging instead- The abbreviated version, Passion Projects. Created for TeachMeet Sydney
Year 6 2013 picture book
A slide show of images from this year's picture book study in my year 6 classroom. Using a mix of royalty free images and clip art, own photographs and illustrations, my students used Adobe Photoshop to create their illustrations. These were then published using Blurb.
Photoshop in the primary school
This presentation was given during a recent Adobe online course called Photo Imaging - a crash course for the classroom. It gives examples of ways I use Photoshop Elements in my year 6 classroom. I use Photoshop Elements to reach some of my Art and Literacy outcomes. The skills my students learn are transferable and relevant, since Adobe Photoshop is still the market leader in photographic manipulation.
An introduction to wait time
Mary Budd Rowe's research shows that wait time, which involves waiting 3-10 seconds before asking for a response to an open-ended question, can improve student achievement and the quality of student responses. When teachers use wait time, it gives students more time to think, access prior knowledge, reflect, and reduce impulsivity. This supports the development of higher-order thinking skills and habits of mind like listening, thinking interdependently, and striving for accuracy. Teachers should ask open-ended questions, wait for responses, and ignore waving hands to fully utilize wait time in their classrooms.
Twitter, Techie brekkie and Teachmeets
This document discusses ways for teachers to connect with other educators through social media and technology in order to break down barriers to technology integration. It recommends that teachers connect with colleagues through "TechieBrekkies", connect with other schools through "TeachMeets", and connect with the world through platforms like Twitter, Edmodo, blogs, and wikis. The document also discusses how teachers can learn from other professionals, teach themselves, teach each other, and have students teach each other through blogs and online communities.
Wait Time
Mary Budd's research shows that increasing wait time after asking questions improves student learning and engagement. When teachers wait 3-10 seconds before expecting a response or moving on to another question, it allows students time to think, access prior knowledge, and formulate more accurate and precise answers. It also reduces impulsivity and supports developing important habits of mind like thinking interdependently, striving for accuracy, and listening with understanding.
Wait time
Mary Budd's research shows that increasing wait time after asking questions improves student learning and engagement. When teachers wait 3-10 seconds before expecting a response or moving on to another question, it allows students time to think, access prior knowledge, and formulate more accurate and precise answers. It also encourages higher-order thinking skills, self-reflection, focus, and listening skills among students. Using wait time must be taught and practiced as a habit to see its full benefits in the classroom.
I Can Do That
I can do that.
Or how I changed my life by flipping my idea of professional development.
So if I can so can you.
Edmodo for TeachMeet Sydney
This document summarizes an educator's use of the Edmodo platform to extend classroom learning. It lists the Edmodo groups created for various subjects and collaborative projects. The educator expresses their love for Edmodo as it is a secure discussion forum created by teachers for teachers. Edmodo allows teachers to upload files, set assignments, and mark work online while students can access it like social media and upload via their backpacks.
Techie brekkies, Twitter and TeachMeets for #IWBdig11
Techie brekkies, Twitter, and TeachMeets are reforming staff professional development. Some key methods mentioned are holding Techie brekkies where teachers teach other teachers about technology, using Twitter to participate in chats about education, and organizing TeachMeets which are conferences where teachers present to other teachers. The document discusses barriers to teacher learning and provides resources like blogs and Edmodo as ways to help overcome those barriers.
Edmodocon 2011
This document summarizes how a teacher uses the educational platform Edmodo to extend classroom learning. The teacher uses Edmodo for homework assignments, discussion groups, connecting with other classes, sharing resources like videos. Students appreciate how Edmodo allows them to communicate and collaborate even when not in the classroom. For literature studies, the teacher structures discussions on novels around thinking questions posted to Edmodo. This enables students to engage deeply with texts and help each other.
Techie brekkies and teach meets
This document discusses ways to break down barriers to technology integration among teachers. It suggests hosting "techie brekkies" and "TeachMeets" to encourage collaboration. TeachMeets allow teachers to share ideas, and students have also taught teachers. The document references concepts of some being "natives" to technology while others are "immigrants." It provides links to resources on distinguishing between "visitors" and "residents" regarding technology use.
Sydney TeachMeet Pecha Cucha
This document provides a summary of over 20 Web 2.0 tools that can be used for engaging, empowering, and evaluating students including Edmodo for private microblogging in the classroom, Edublogs for education blogging, VoiceThread for collaborative multimedia presentations, Glogster for creating interactive posters, Wallwisher for online discussions, and Animoto and Photopeach for creating video and photo slideshows. Many of these tools like Dropbox, Google Docs, and Survey Monkey allow sharing files, collaborating online, and collecting feedback.
Year 5 Term 4 smartie maths
The document lists various math and statistics questions related to Smarties candy. Some examples of questions asked include how many Smarties will fit in one's mouth, the circumference and diameter of a Smartie, calculating costs of Smarties packets, measuring weights of Smarties, probabilities of drawing certain colored Smarties, dividing and sharing Smarties among groups, and representing Smartie data using graphs and percentages.
Fun in the goldrush era
Year 5 use chalks, paint and reproduction photographs from the goldrush era to create humorous pictures.
Fun in the Australian goldrush
5 Gold use a mixture of paint, chalks and old photographs to create humorous montages about life in the goldrush era.
Gold 2.
The document discusses the benefits of exercise for mental health. Regular physical activity can help reduce anxiety and depression and improve mood and cognitive functioning. Exercise causes chemical changes in the brain that may help boost feelings of calmness, happiness and focus.
Gold 2.
The document discusses the benefits of meditation for reducing stress and anxiety. Regular meditation practice can help calm the mind and body by lowering heart rate and blood pressure. Studies have shown that meditating for just 10-20 minutes per day can have significant positive impacts on both mental and physical health over time.
More from Roseville College (20)
Developing student portfolios using Adobe Acrobat X
Developing student portfolios using Adobe Acrobat X
Ban boring homework use blogging instead- The abbreviated version
Ban boring homework use blogging instead- The abbreviated version
Techie brekkies, Twitter and TeachMeets for #IWBdig11
Techie brekkies, Twitter and TeachMeets for #IWBdig11
Recently uploaded
Hamster Kombat' Telegram Game Surpasses 100 Million Players—Token Release Sch...
Hamster Kombat' Telegram Game Surpasses 100 Million Players—Token Release Schedule Unveiled
Business storytelling: key ingredients to a story
Storytelling is an incredibly valuable tool to share data and information. To get the most impact from stories there are a number of key ingredients. These are based on science and human nature. Using these elements in a story you can deliver information impactfully, ensure action and drive change.
The Genesis of BriansClub.cm Famous Dark WEb Platform
BriansClub.cm, a famous platform on the dark web, has become one of the most infamous carding marketplaces, specializing in the sale of stolen credit card data.
Zodiac Signs and Food Preferences_ What Your Sign Says About Your Taste
Know what your zodiac sign says about your taste in food! Explore how the 12 zodiac signs influence your culinary preferences with insights from MyPandit. Dive into astrology and flavors!
一比一原版(QMUE毕业证书)英国爱丁堡玛格丽特女王大学毕业证文凭如何办理
永久可查学历认证【微信:A575476】【(QMUE毕业证书)英国爱丁堡玛格丽特女王大学毕业证成绩单Offer】【微信:A575476】(留信学历认证永久存档查询)采用学校原版纸张、特殊工艺完全按照原版一比一制作(包括:隐形水印,阴影底纹,钢印LOGO烫金烫银,LOGO烫金烫银复合重叠,文字图案浮雕,激光镭射,紫外荧光,温感,复印防伪)行业标杆!精益求精,诚心合作,真诚制作!多年品质 ,按需精细制作,24小时接单,全套进口原装设备,十五年致力于帮助留学生解决难题,业务范围有加拿大、英国、澳洲、韩国、美国、新加坡,新西兰等学历材料,包您满意。
【业务选择办理准则】
一、工作未确定,回国需先给父母、亲戚朋友看下文凭的情况,办理一份就读学校的毕业证【微信:A575476】文凭即可
二、回国进私企、外企、自己做生意的情况,这些单位是不查询毕业证真伪的,而且国内没有渠道去查询国外文凭的真假,也不需要提供真实教育部认证。鉴于此,办理一份毕业证【微信:A575476】即可
三、进国企,银行,事业单位,考公务员等等,这些单位是必需要提供真实教育部认证的,办理教育部认证所需资料众多且烦琐,所有材料您都必须提供原件,我们凭借丰富的经验,快捷的绿色通道帮您快速整合材料,让您少走弯路。
留信网认证的作用:
1:该专业认证可证明留学生真实身份
2:同时对留学生所学专业登记给予评定
3:国家专业人才认证中心颁发入库证书
4:这个认证书并且可以归档倒地方
5:凡事获得留信网入网的信息将会逐步更新到个人身份内,将在公安局网内查询个人身份证信息后,同步读取人才网入库信息
6:个人职称评审加20分
7:个人信誉贷款加10分
8:在国家人才网主办的国家网络招聘大会中纳入资料,供国家高端企业选择人才
→ 【关于价格问题(保证一手价格)
我们所定的价格是非常合理的,而且我们现在做得单子大多数都是代理和回头客户介绍的所以一般现在有新的单子 我给客户的都是第一手的代理价格,因为我想坦诚对待大家 不想跟大家在价格方面浪费时间
对于老客户或者被老客户介绍过来的朋友,我们都会适当给一些优惠。
选择实体注册公司办理,更放心,更安全!我们的承诺:可来公司面谈,可签订合同,会陪同客户一起到教育部认证窗口递交认证材料,客户在教育部官方认证查询网站查询到认证通过结果后付款,不成功不收费!
TIMES BPO: Business Plan For Startup Industry
Starting a business is like embarking on an unpredictable adventure. It’s a journey filled with highs and lows, victories and defeats. But what if I told you that those setbacks and failures could be the very stepping stones that lead you to fortune? Let’s explore how resilience, adaptability, and strategic thinking can transform adversity into opportunity.
Unveiling the Dynamic Personalities, Key Dates, and Horoscope Insights: Gemin...
Explore the fascinating world of the Gemini Zodiac Sign. Discover the unique personality traits, key dates, and horoscope insights of Gemini individuals. Learn how their sociable, communicative nature and boundless curiosity make them the dynamic explorers of the zodiac. Dive into the duality of the Gemini sign and understand their intellectual and adventurous spirit.
Innovation Management Frameworks: Your Guide to Creativity & Innovation
Innovation Management Frameworks: Your Guide to Creativity & InnovationOperational Excellence Consulting
[To download this presentation, visit:
https://www.oeconsulting.com.sg/training-presentations]
This PowerPoint compilation offers a comprehensive overview of 20 leading innovation management frameworks and methodologies, selected for their broad applicability across various industries and organizational contexts. These frameworks are valuable resources for a wide range of users, including business professionals, educators, and consultants.
Each framework is presented with visually engaging diagrams and templates, ensuring the content is both informative and appealing. While this compilation is thorough, please note that the slides are intended as supplementary resources and may not be sufficient for standalone instructional purposes.
This compilation is ideal for anyone looking to enhance their understanding of innovation management and drive meaningful change within their organization. Whether you aim to improve product development processes, enhance customer experiences, or drive digital transformation, these frameworks offer valuable insights and tools to help you achieve your goals.
INCLUDED FRAMEWORKS/MODELS:
1. Stanford’s Design Thinking
2. IDEO’s Human-Centered Design
3. Strategyzer’s Business Model Innovation
4. Lean Startup Methodology
5. Agile Innovation Framework
6. Doblin’s Ten Types of Innovation
7. McKinsey’s Three Horizons of Growth
8. Customer Journey Map
9. Christensen’s Disruptive Innovation Theory
10. Blue Ocean Strategy
11. Strategyn’s Jobs-To-Be-Done (JTBD) Framework with Job Map
12. Design Sprint Framework
13. The Double Diamond
14. Lean Six Sigma DMAIC
15. TRIZ Problem-Solving Framework
16. Edward de Bono’s Six Thinking Hats
17. Stage-Gate Model
18. Toyota’s Six Steps of Kaizen
19. Microsoft’s Digital Transformation Framework
20. Design for Six Sigma (DFSS)
To download this presentation, visit:
https://www.oeconsulting.com.sg/training-presentations3 Simple Steps To Buy Verified Payoneer Account In 2024
Buy Verified Payoneer Account: Quick and Secure Way to Receive Payments
Buy Verified Payoneer Account With 100% secure documents, [ USA, UK, CA ]. Are you looking for a reliable and safe way to receive payments online? Then you need buy verified Payoneer account ! Payoneer is a global payment platform that allows businesses and individuals to send and receive money in over 200 countries.
If You Want To More Information just Contact Now:
Skype: SEOSMMEARTH
Telegram: @seosmmearth
Gmail: seosmmearth@gmail.com
How MJ Global Leads the Packaging Industry.pdf
MJ Global's success in staying ahead of the curve in the packaging industry is a testament to its dedication to innovation, sustainability, and customer-centricity. By embracing technological advancements, leading in eco-friendly solutions, collaborating with industry leaders, and adapting to evolving consumer preferences, MJ Global continues to set new standards in the packaging sector.
Digital Marketing with a Focus on Sustainability
Digital Marketing best practices including influencer marketing, content creators, and omnichannel marketing for Sustainable Brands at the Sustainable Cosmetics Summit 2024 in New York
Top 10 Free Accounting and Bookkeeping Apps for Small Businesses
Maintaining a proper record of your money is important for any business whether it is small or large. It helps you stay one step ahead in the financial race and be aware of your earnings and any tax obligations.
However, managing finances without an entire accounting staff can be challenging for small businesses.
Accounting apps can help with that! They resemble your private money manager.
They organize all of your transactions automatically as soon as you link them to your corporate bank account. Additionally, they are compatible with your phone, allowing you to monitor your finances from anywhere. Cool, right?
Thus, we’ll be looking at several fantastic accounting apps in this blog that will help you develop your business and save time.
Industrial Tech SW: Category Renewal and Creation
Every industrial revolution has created a new set of categories and a new set of players.
Multiple new technologies have emerged, but Samsara and C3.ai are only two companies which have gone public so far.
Manufacturing startups constitute the largest pipeline share of unicorns and IPO candidates in the SF Bay Area, and software startups dominate in Germany.
Digital Transformation Frameworks: Driving Digital Excellence
[To download this presentation, visit:
https://www.oeconsulting.com.sg/training-presentations]
This presentation is a curated compilation of PowerPoint diagrams and templates designed to illustrate 20 different digital transformation frameworks and models. These frameworks are based on recent industry trends and best practices, ensuring that the content remains relevant and up-to-date.
Key highlights include Microsoft's Digital Transformation Framework, which focuses on driving innovation and efficiency, and McKinsey's Ten Guiding Principles, which provide strategic insights for successful digital transformation. Additionally, Forrester's framework emphasizes enhancing customer experiences and modernizing IT infrastructure, while IDC's MaturityScape helps assess and develop organizational digital maturity. MIT's framework explores cutting-edge strategies for achieving digital success.
These materials are perfect for enhancing your business or classroom presentations, offering visual aids to supplement your insights. Please note that while comprehensive, these slides are intended as supplementary resources and may not be complete for standalone instructional purposes.
Frameworks/Models included:
Microsoft’s Digital Transformation Framework
McKinsey’s Ten Guiding Principles of Digital Transformation
Forrester’s Digital Transformation Framework
IDC’s Digital Transformation MaturityScape
MIT’s Digital Transformation Framework
Gartner’s Digital Transformation Framework
Accenture’s Digital Strategy & Enterprise Frameworks
Deloitte’s Digital Industrial Transformation Framework
Capgemini’s Digital Transformation Framework
PwC’s Digital Transformation Framework
Cisco’s Digital Transformation Framework
Cognizant’s Digital Transformation Framework
DXC Technology’s Digital Transformation Framework
The BCG Strategy Palette
McKinsey’s Digital Transformation Framework
Digital Transformation Compass
Four Levels of Digital Maturity
Design Thinking Framework
Business Model Canvas
Customer Journey Map
Recently uploaded (20)
Hamster Kombat' Telegram Game Surpasses 100 Million Players—Token Release Sch...
Hamster Kombat' Telegram Game Surpasses 100 Million Players—Token Release Sch...
Registered-Establishment-List-in-Uttarakhand-pdf.pdf
Registered-Establishment-List-in-Uttarakhand-pdf.pdf
The Genesis of BriansClub.cm Famous Dark WEb Platform
The Genesis of BriansClub.cm Famous Dark WEb Platform
Zodiac Signs and Food Preferences_ What Your Sign Says About Your Taste
Zodiac Signs and Food Preferences_ What Your Sign Says About Your Taste
Unveiling the Dynamic Personalities, Key Dates, and Horoscope Insights: Gemin...
Unveiling the Dynamic Personalities, Key Dates, and Horoscope Insights: Gemin...
Innovation Management Frameworks: Your Guide to Creativity & Innovation
Innovation Management Frameworks: Your Guide to Creativity & Innovation
3 Simple Steps To Buy Verified Payoneer Account In 2024
3 Simple Steps To Buy Verified Payoneer Account In 2024
Top 10 Free Accounting and Bookkeeping Apps for Small Businesses
Top 10 Free Accounting and Bookkeeping Apps for Small Businesses
Digital Transformation Frameworks: Driving Digital Excellence
Digital Transformation Frameworks: Driving Digital Excellence
the time year 5 arrived at School
- 1. The time year 5 arrived at school on Thursday morning-By India 10 9 8 7 6 Number of girls 5 4 3 2 1 0 Row 2 Row 3 Row 4 Row 5 Row 6 Row 7 Row 8 Row 9 Row 10 Row 11 Row 12 Row 13 Row 14 Row 15 Row 16 Row 17 Time
- 2. 7.30 1 7.35 1 7.40 0 7.45 0 7.50 9 7.55 2 8.00 4 8.05 3 8.10 2 8.15 6 8.20 5 8.25 3 8.30 0 8.35 1 8.40 2 8.45 0