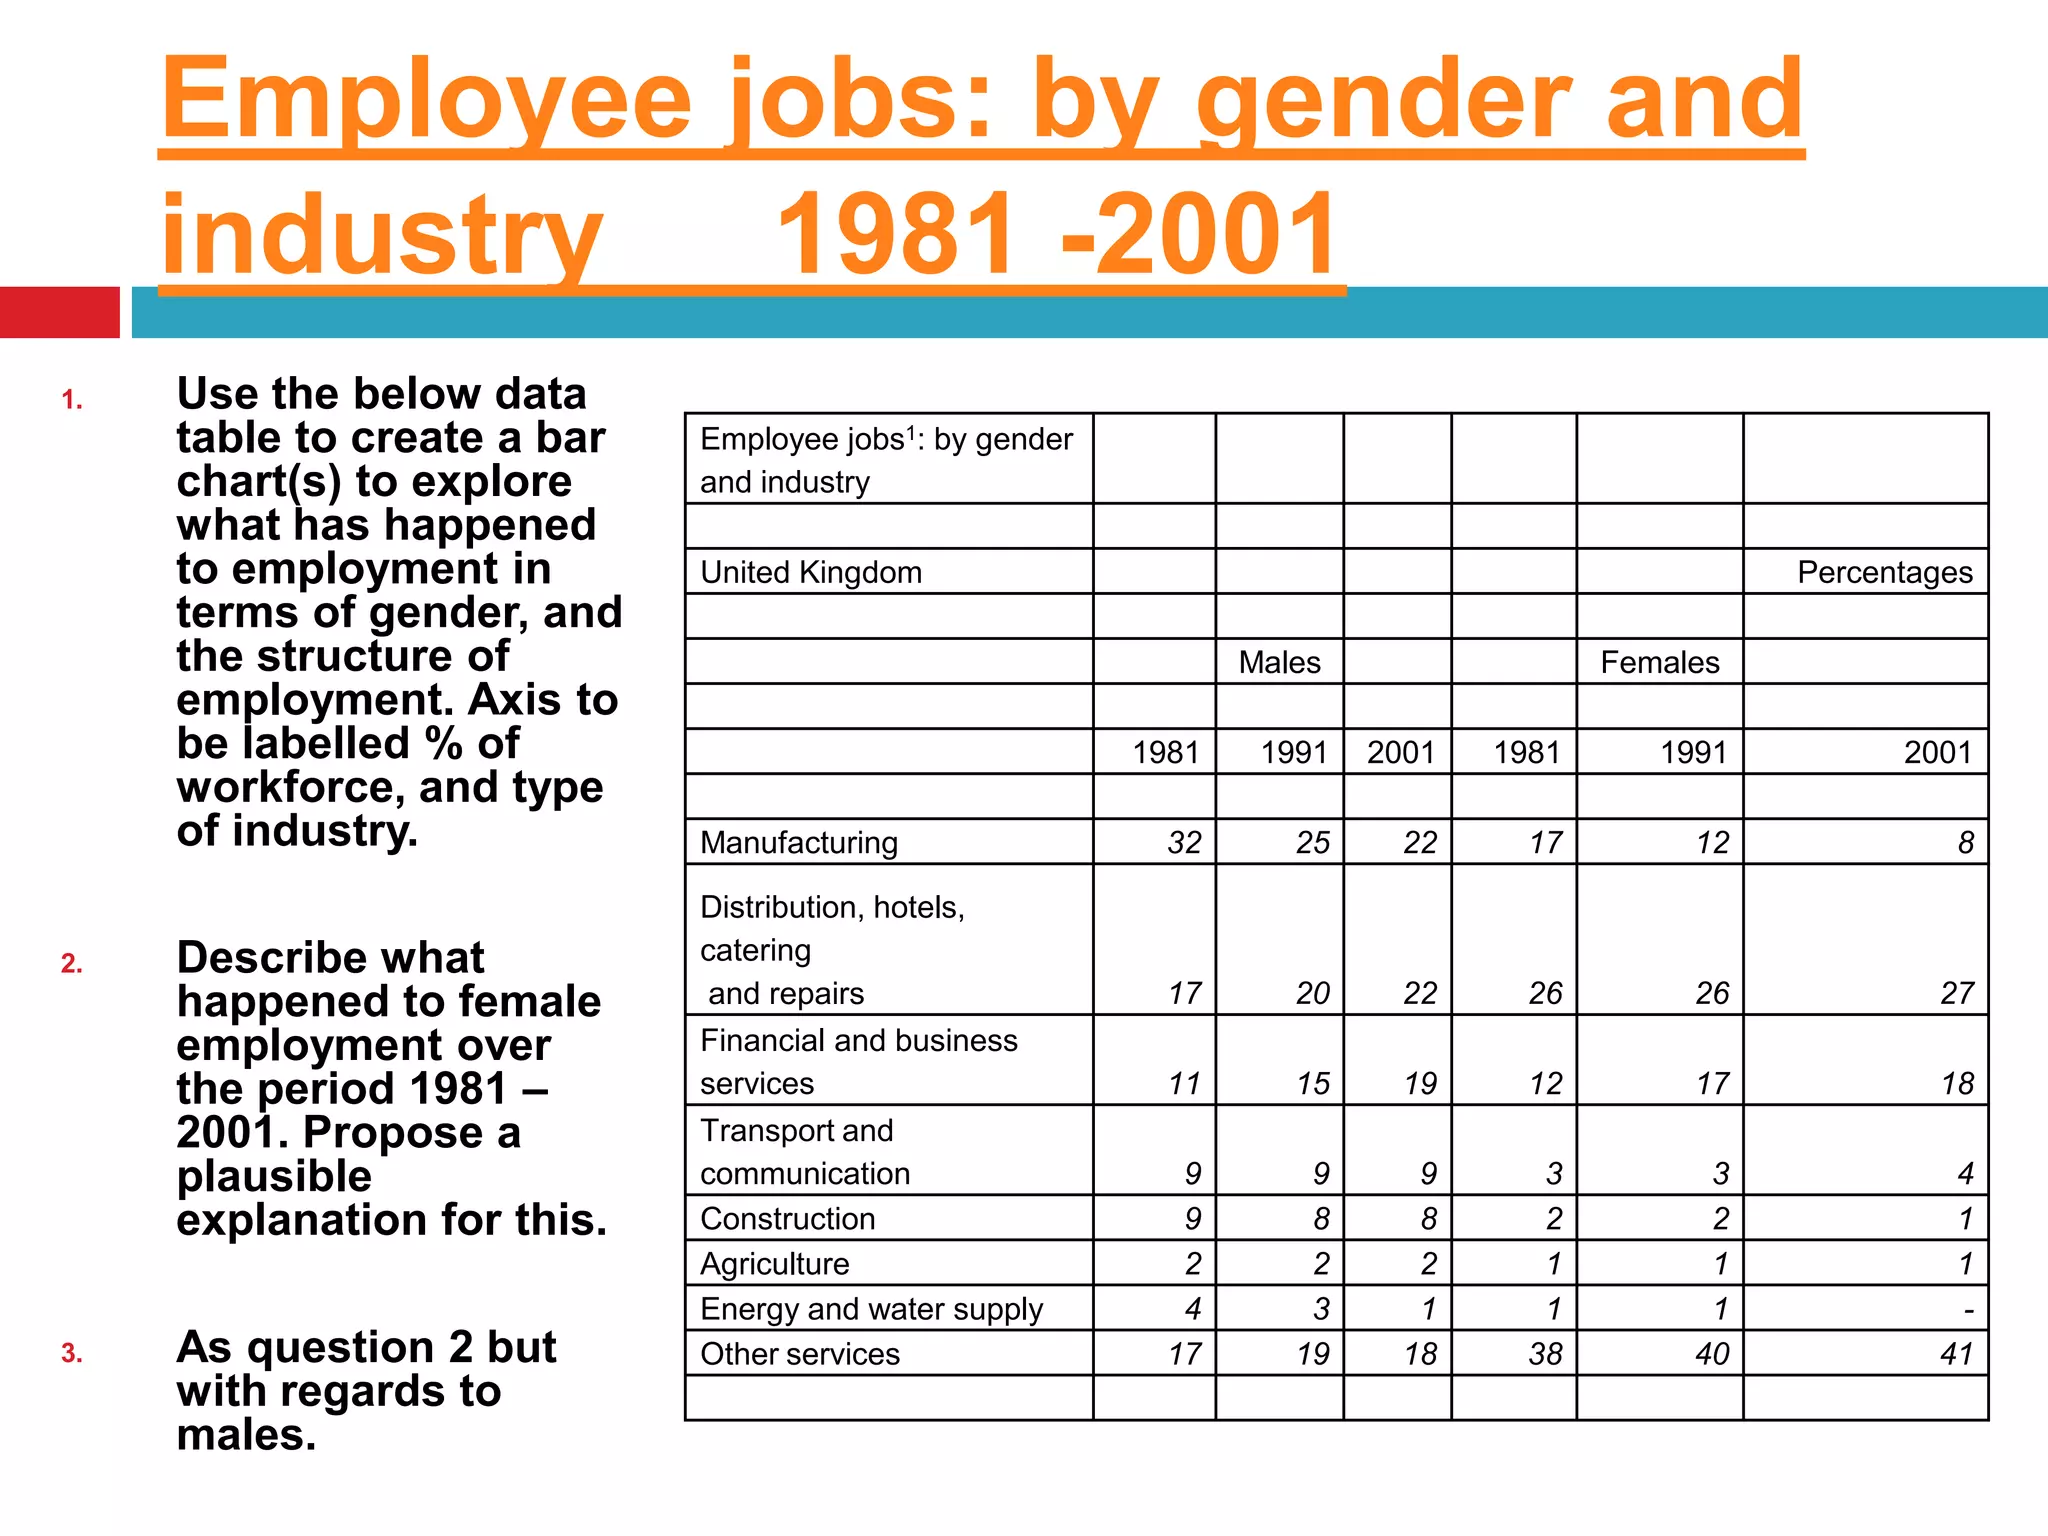
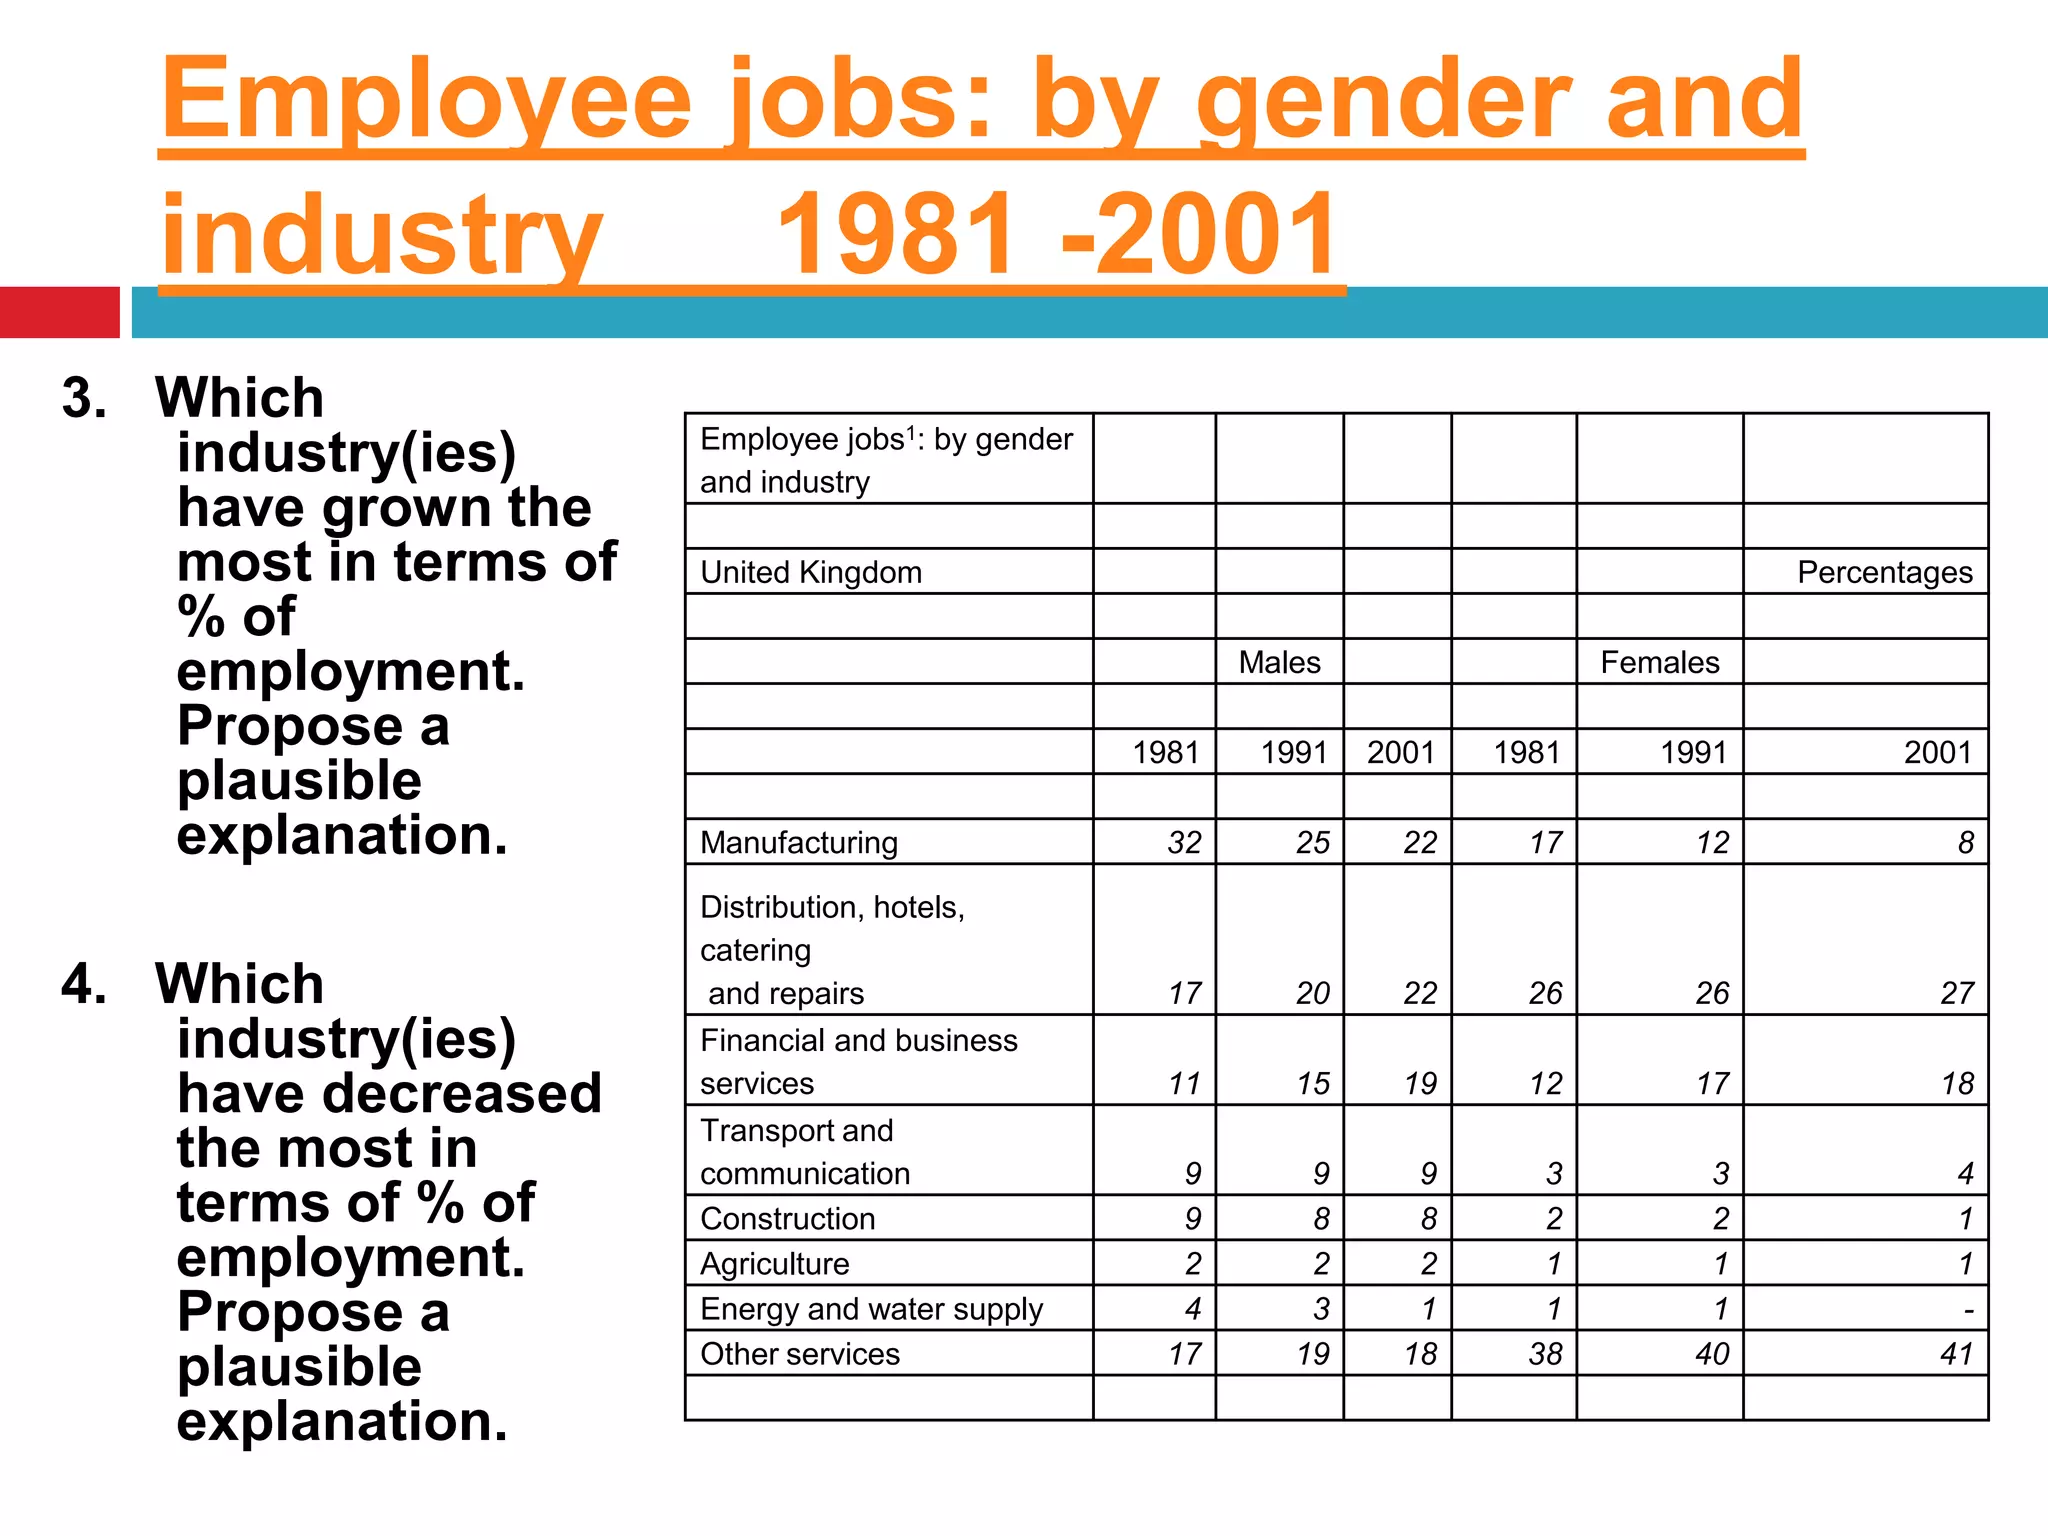
The structure of employmentMr Hannaford
Employee jobs: by gender and industry	1981 -2001Use the below data table to create a bar chart(s) to explore what has happened to employment in terms of gender, and the structure of employment. Axis to be labelled % of workforce, and type of industry.Describe what happened to female employment over the period 1981 – 2001. Propose a plausible explanation for this.As question 2 but with regards to males.
Employee jobs: by gender and industry	1981 -20013.   Which industry(ies) have grown the most in terms of % of employment. Propose a plausible explanation.4.   Which industry(ies) have decreased the most in terms of % of employment. Propose a plausible explanation.
Final task – What does it boil down to?When tasks 1-4 are complete, you need to create a poster to summarise your findings. This involves displaying data charts and succinct bullet points. DON’T SIMPLY CUT AND PASTE!

The structure of employment

  • 1.
    The structure ofemploymentMr Hannaford
  • 2.
    Employee jobs: bygender and industry 1981 -2001Use the below data table to create a bar chart(s) to explore what has happened to employment in terms of gender, and the structure of employment. Axis to be labelled % of workforce, and type of industry.Describe what happened to female employment over the period 1981 – 2001. Propose a plausible explanation for this.As question 2 but with regards to males.
  • 3.
    Employee jobs: bygender and industry 1981 -20013. Which industry(ies) have grown the most in terms of % of employment. Propose a plausible explanation.4. Which industry(ies) have decreased the most in terms of % of employment. Propose a plausible explanation.
  • 4.
    Final task –What does it boil down to?When tasks 1-4 are complete, you need to create a poster to summarise your findings. This involves displaying data charts and succinct bullet points. DON’T SIMPLY CUT AND PASTE!