Download as PDF, PPTX

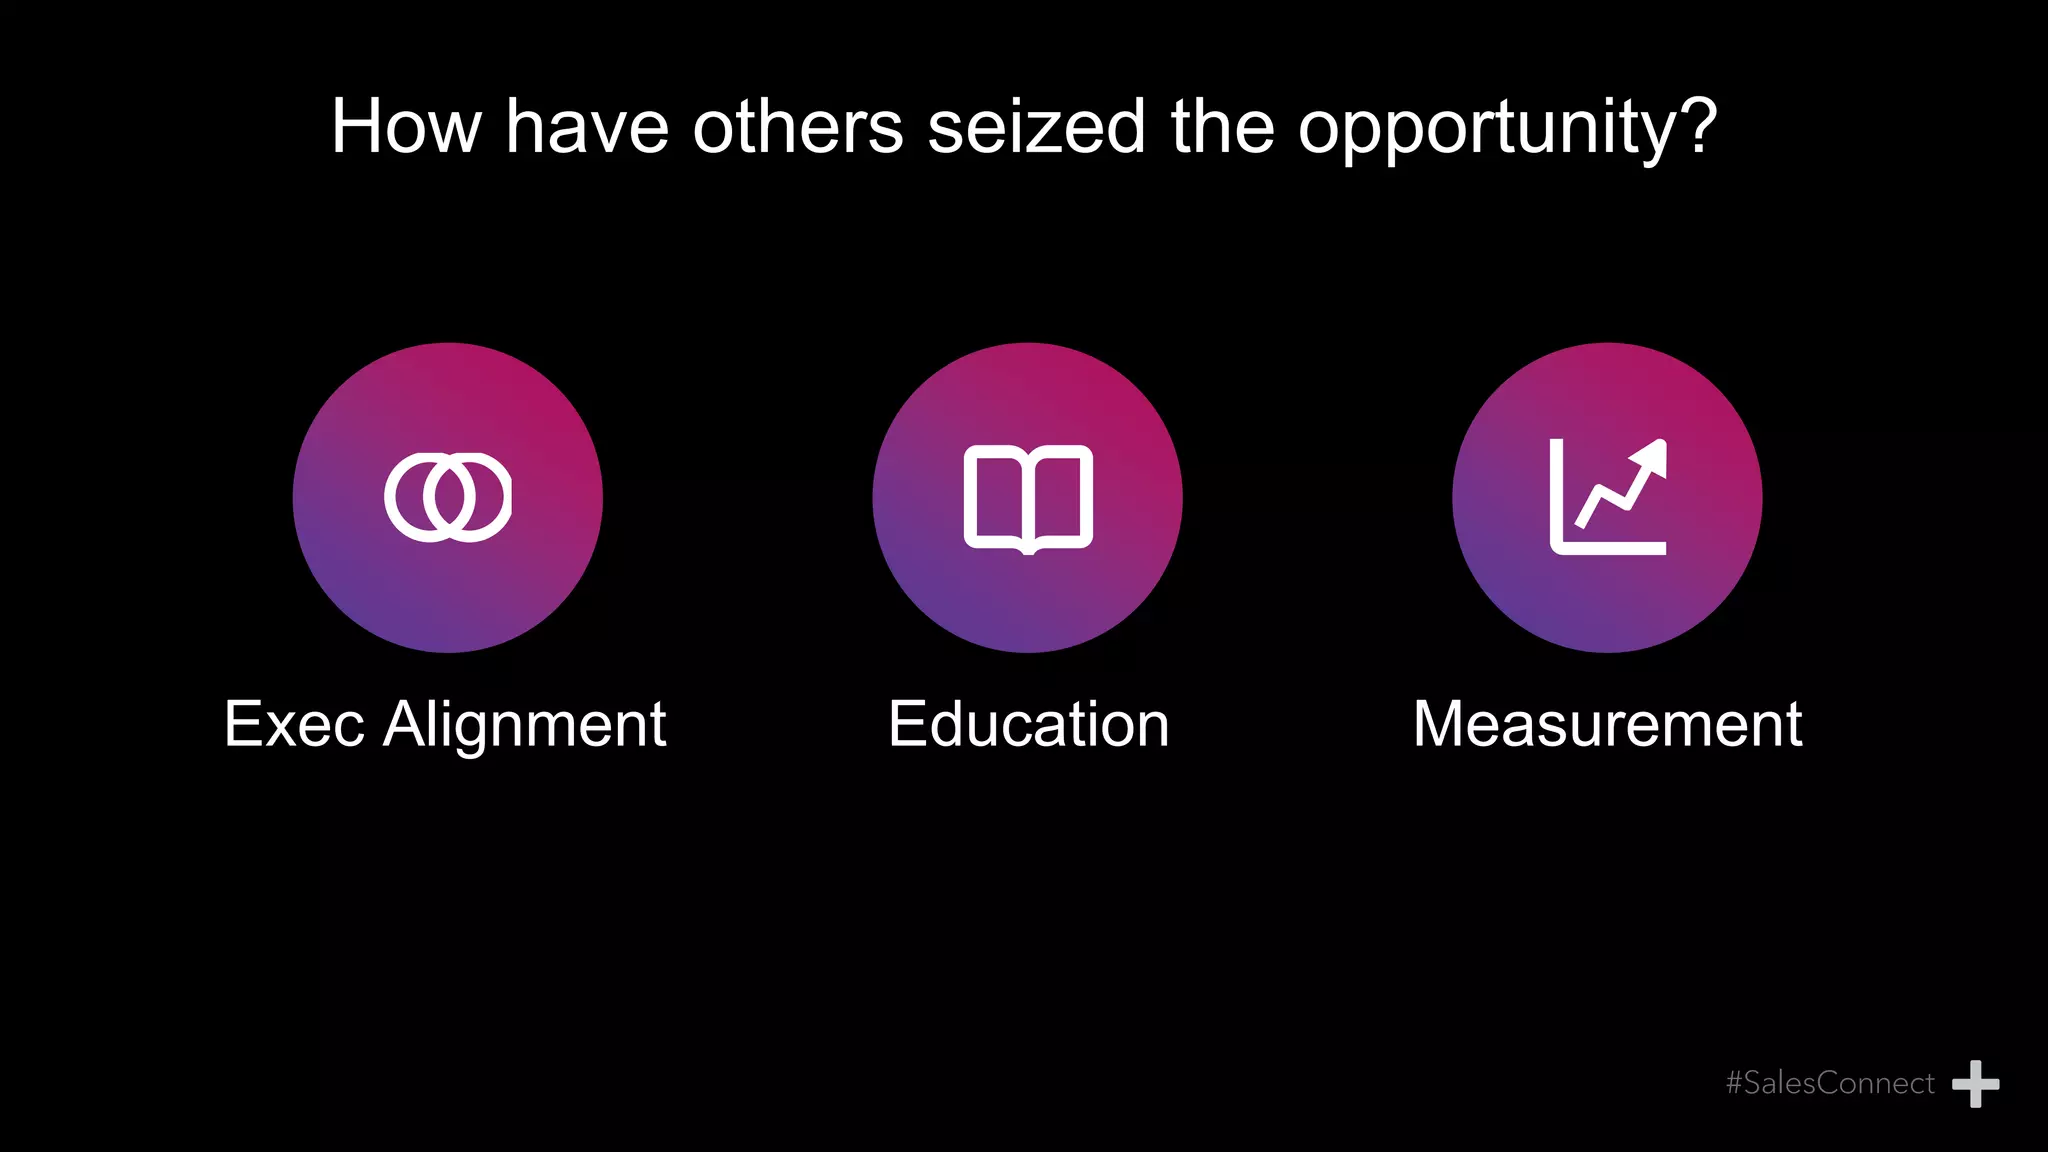
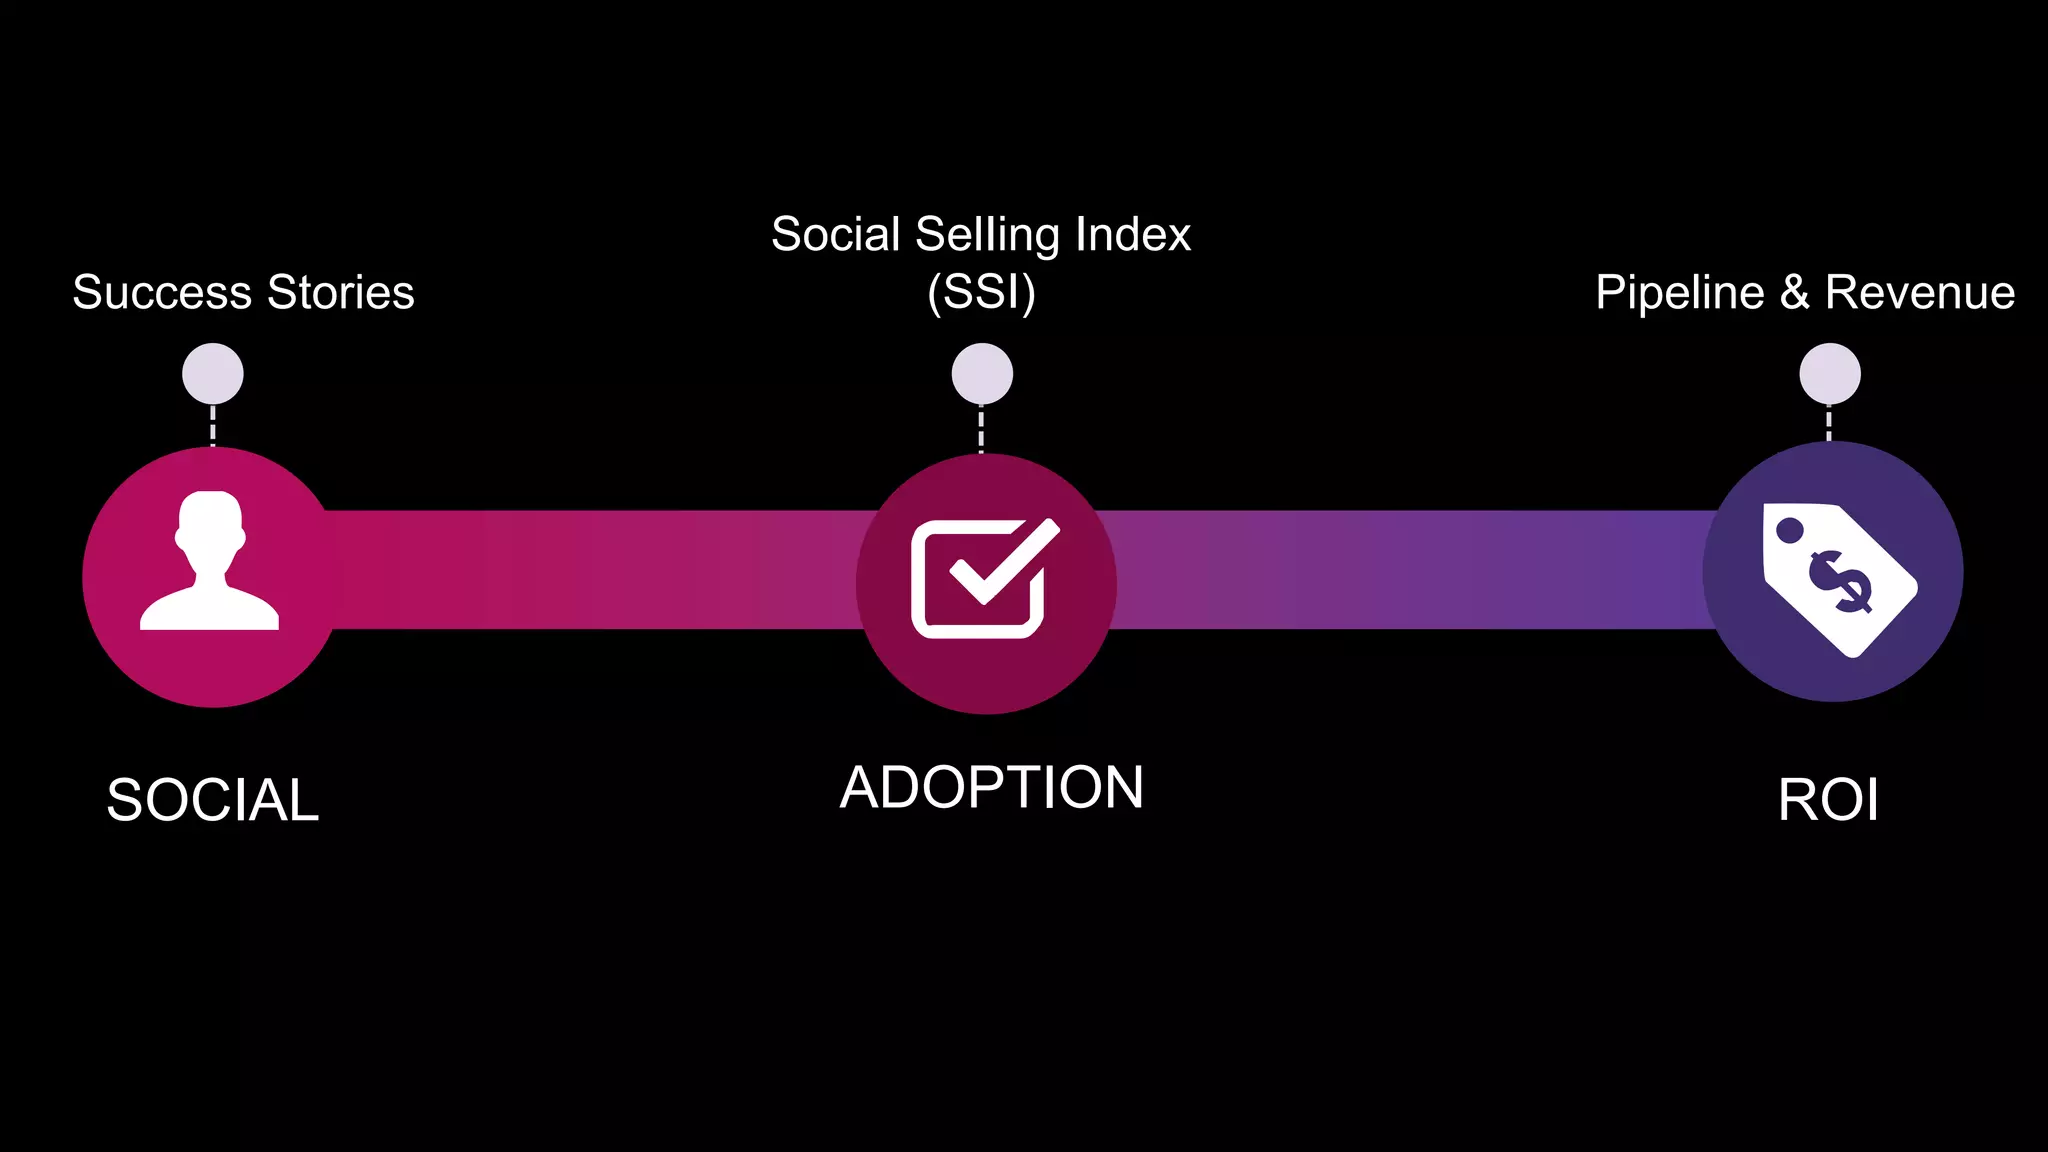
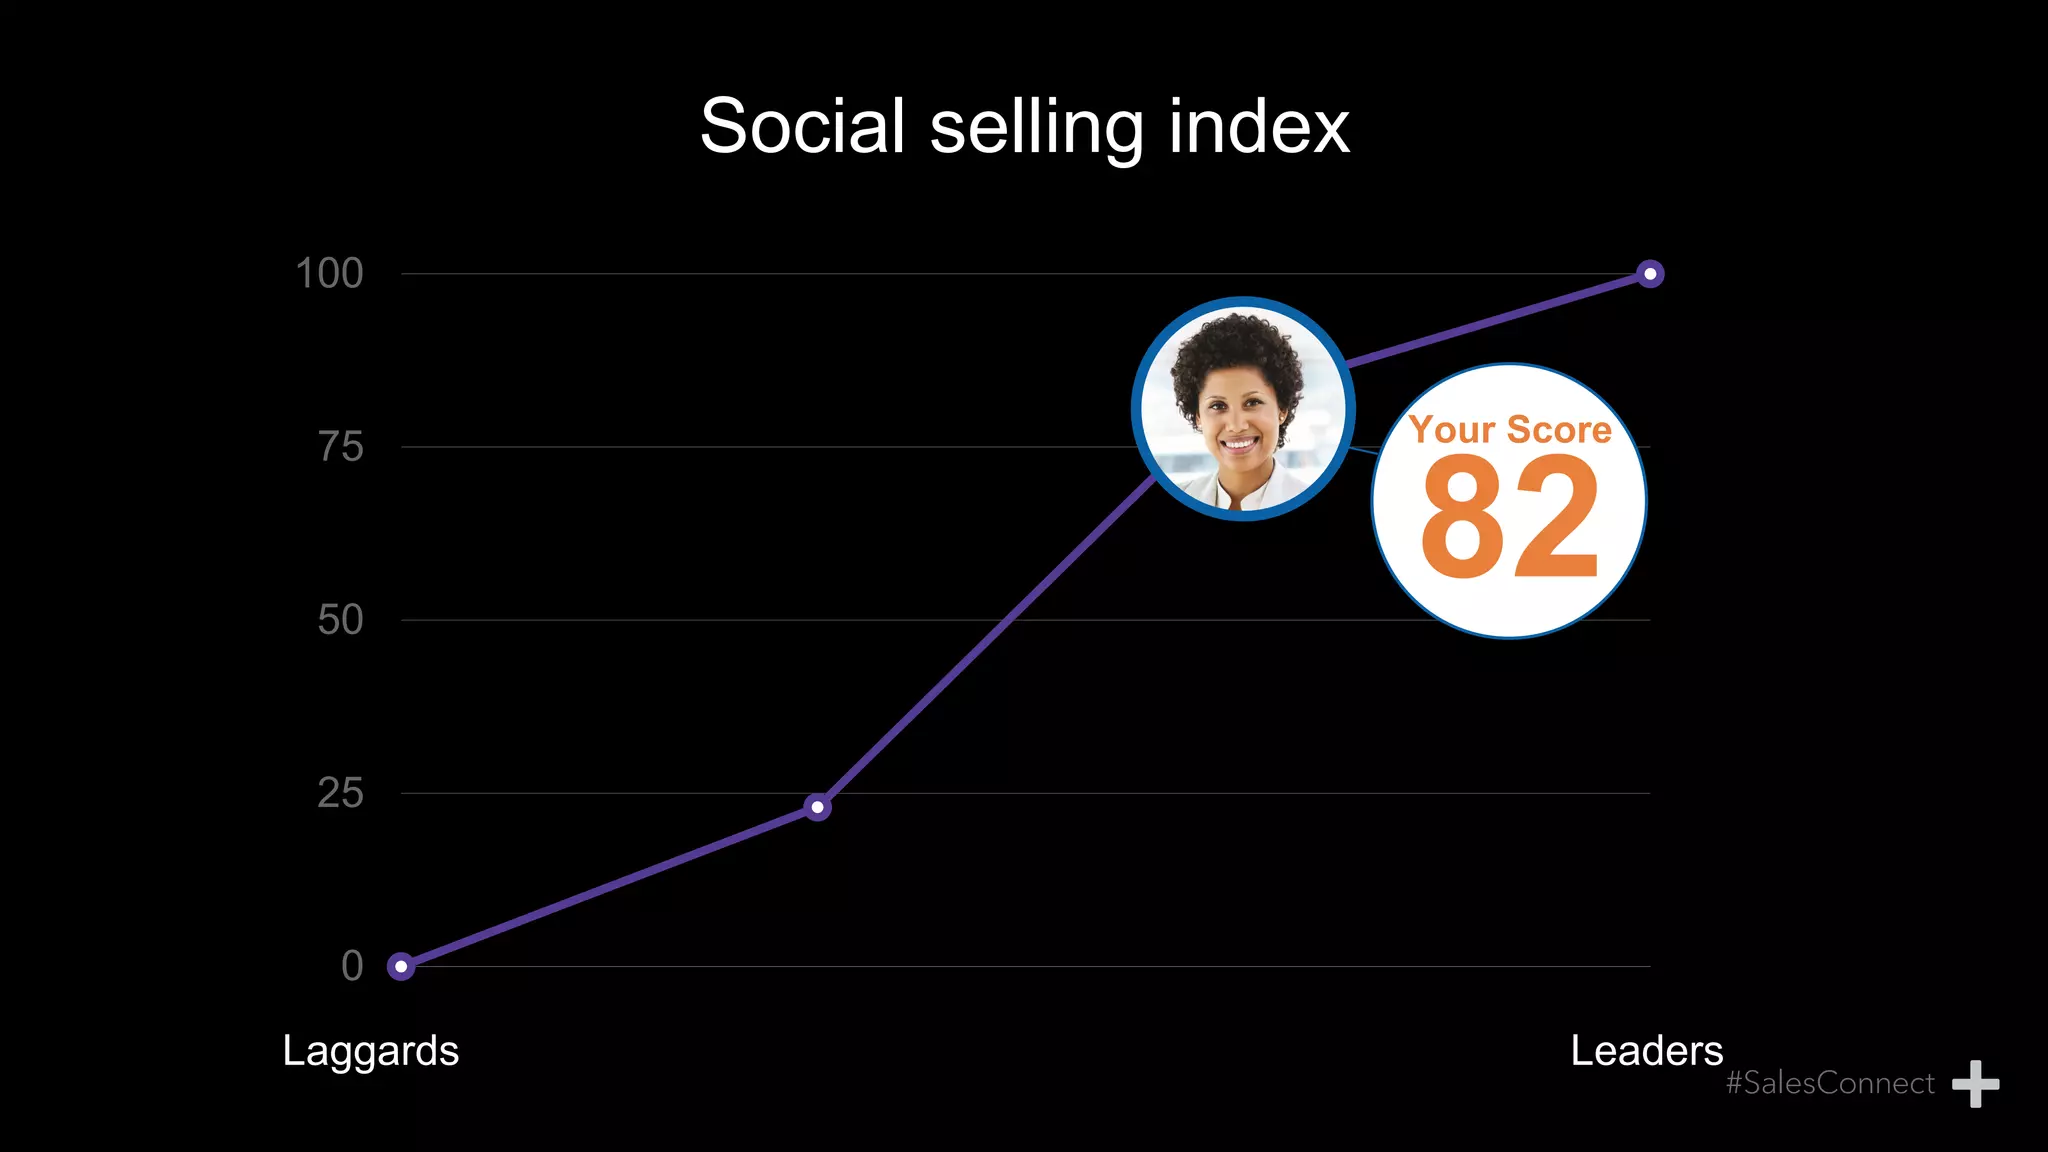
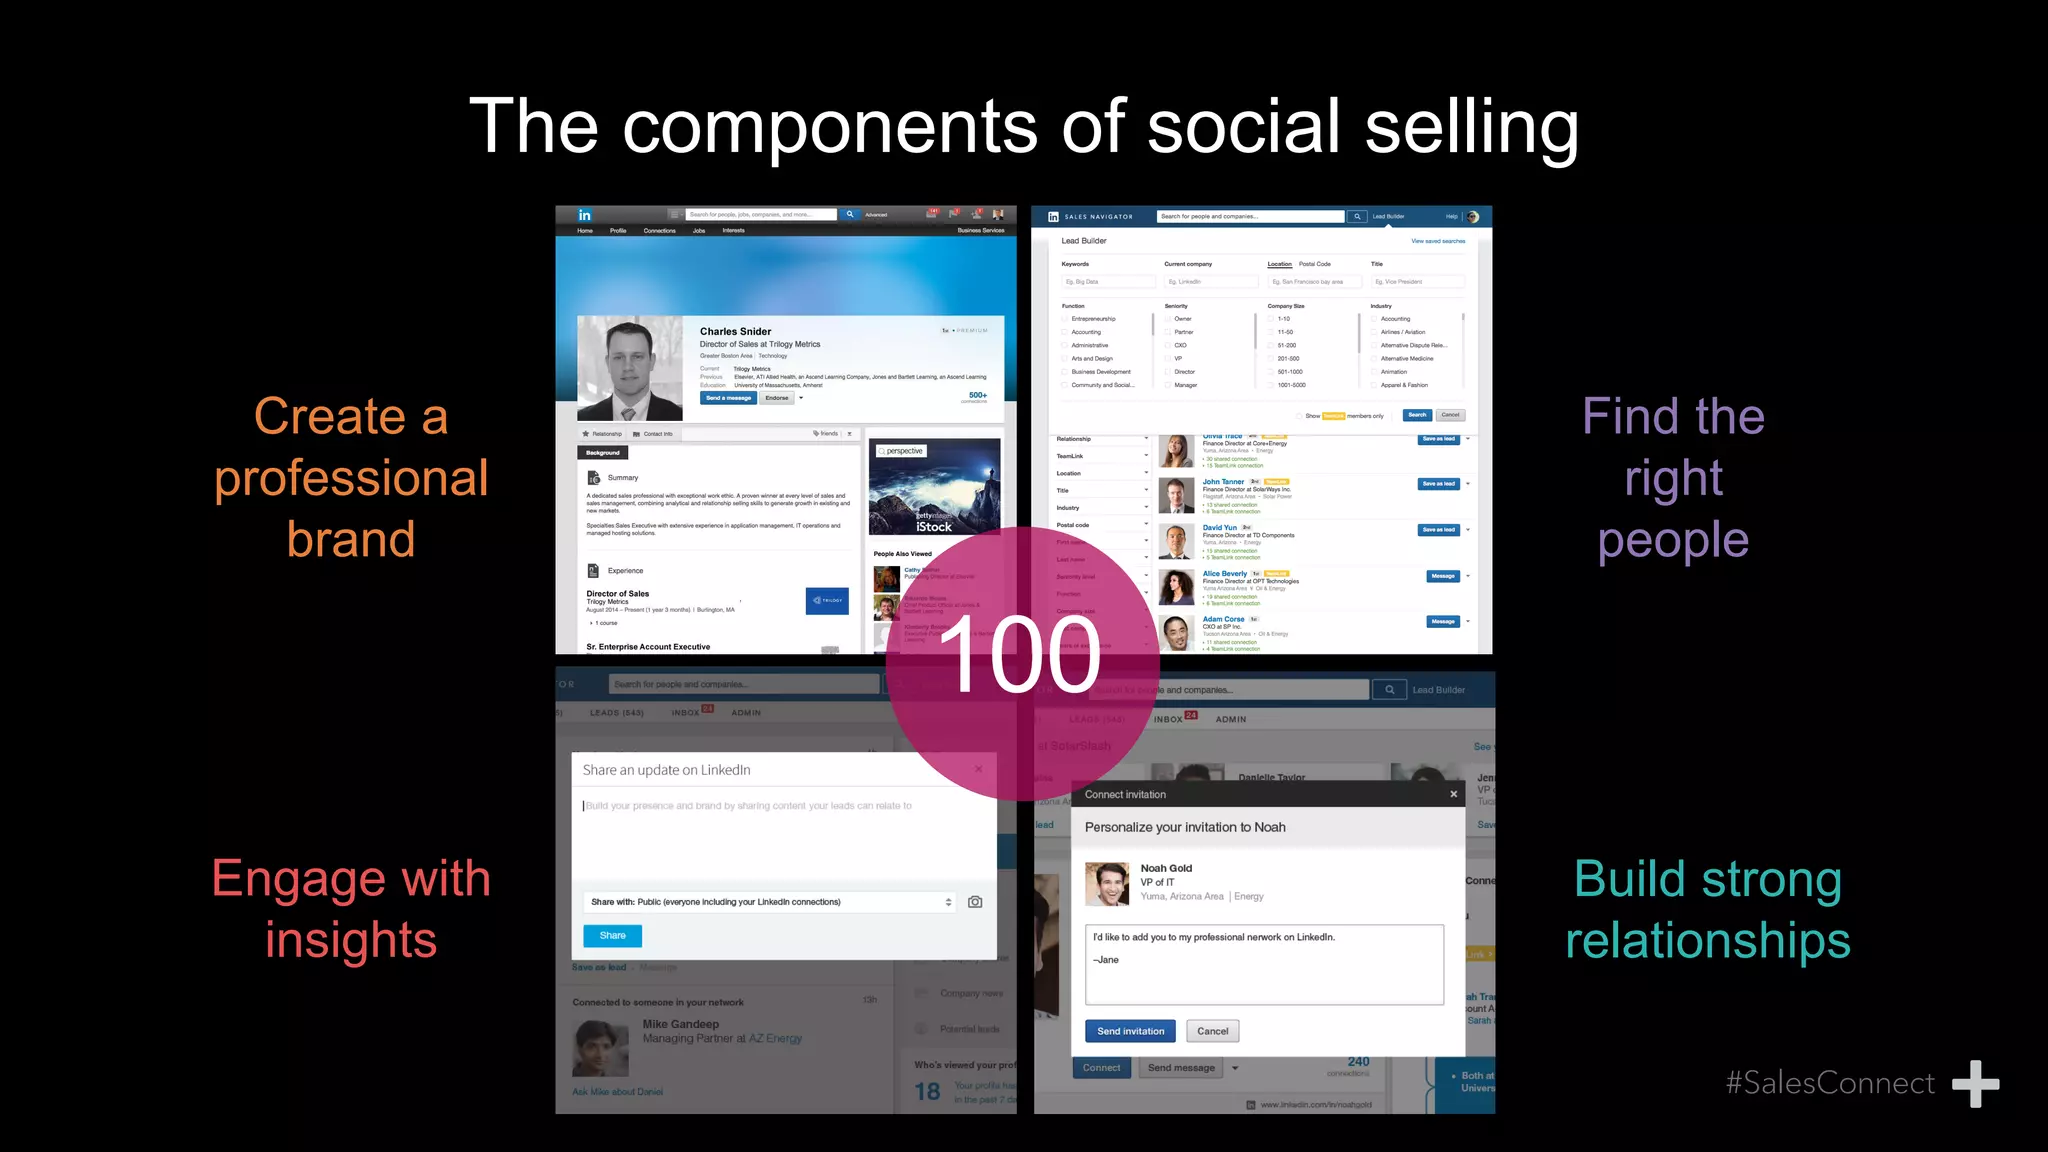
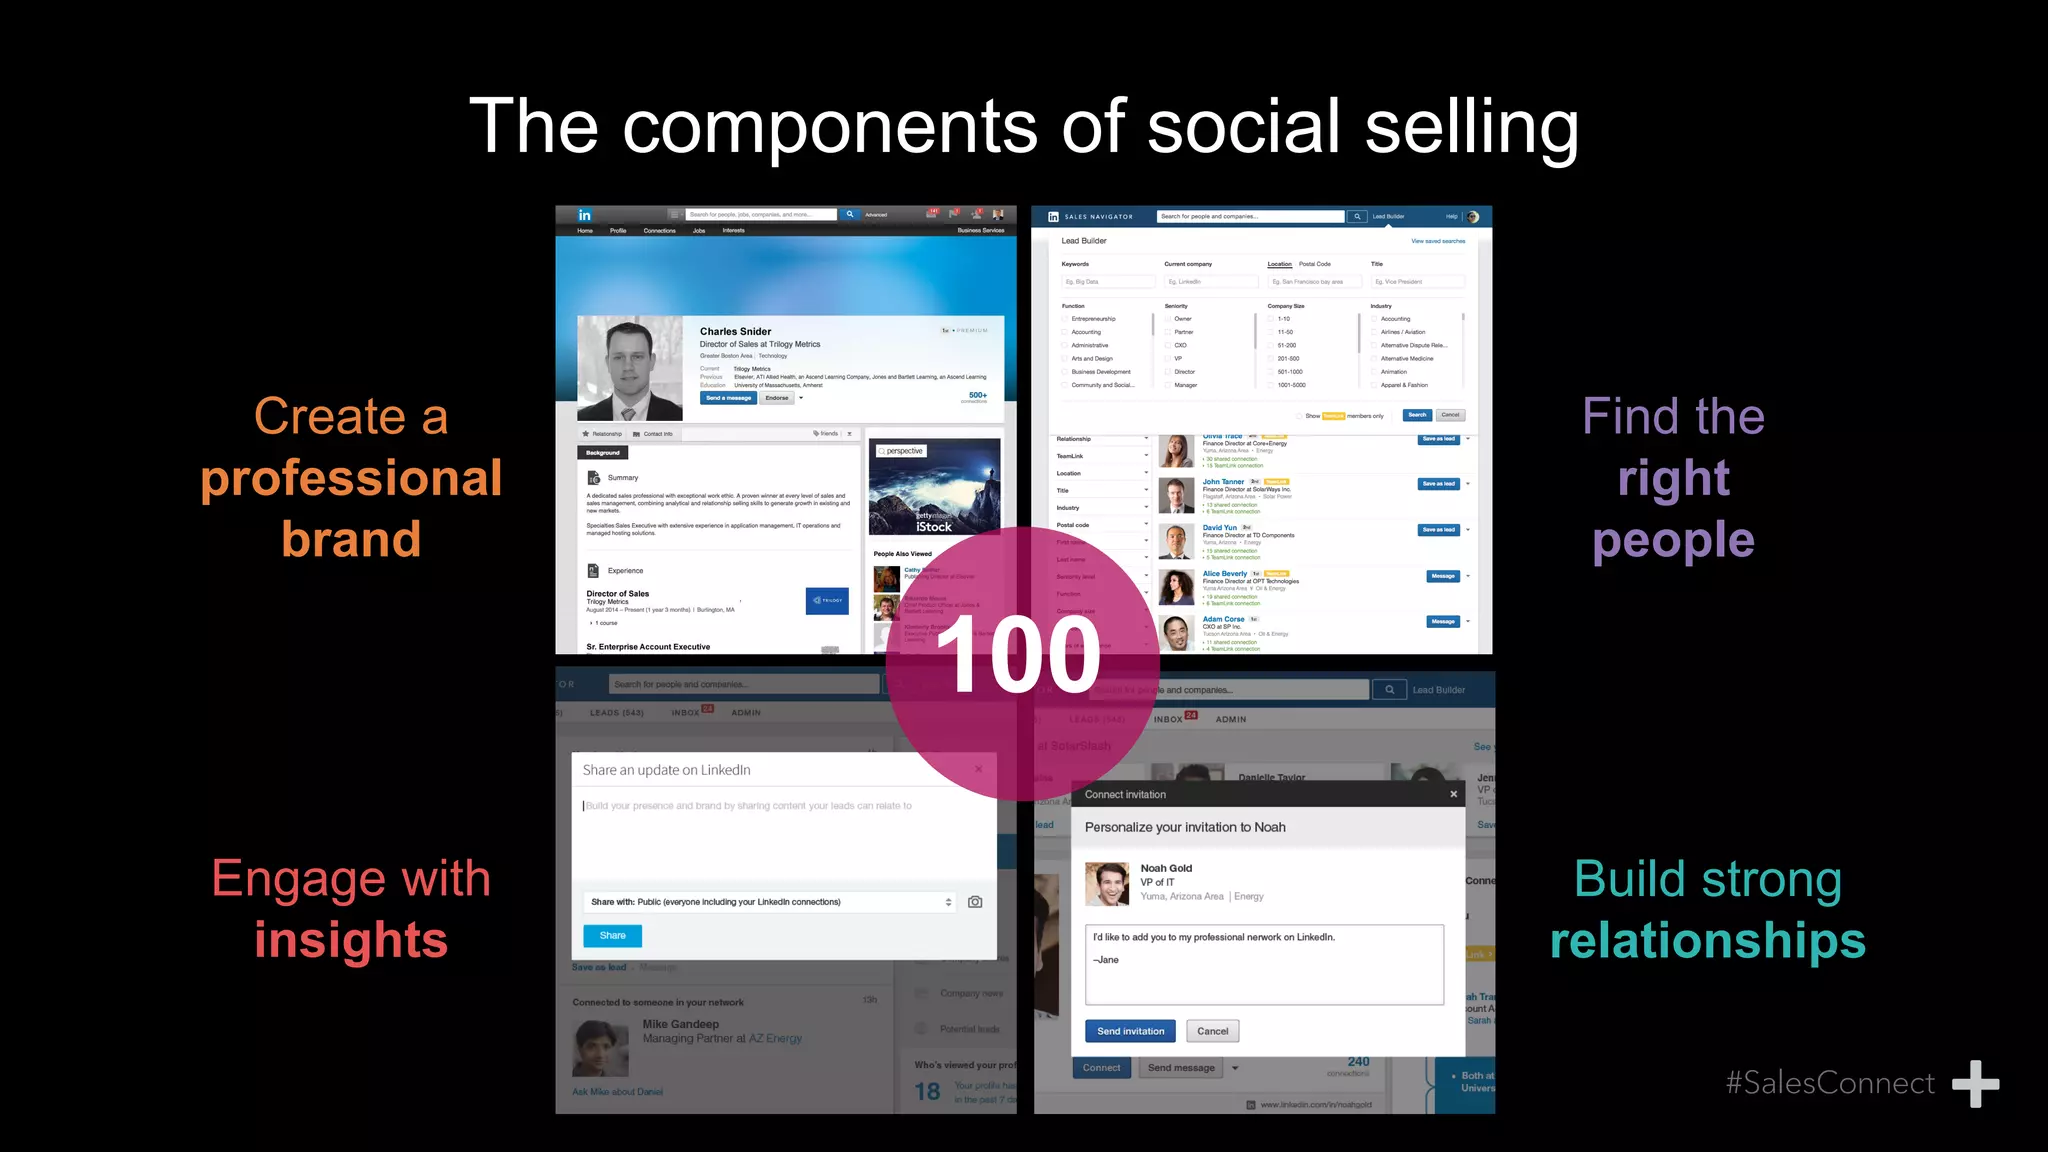
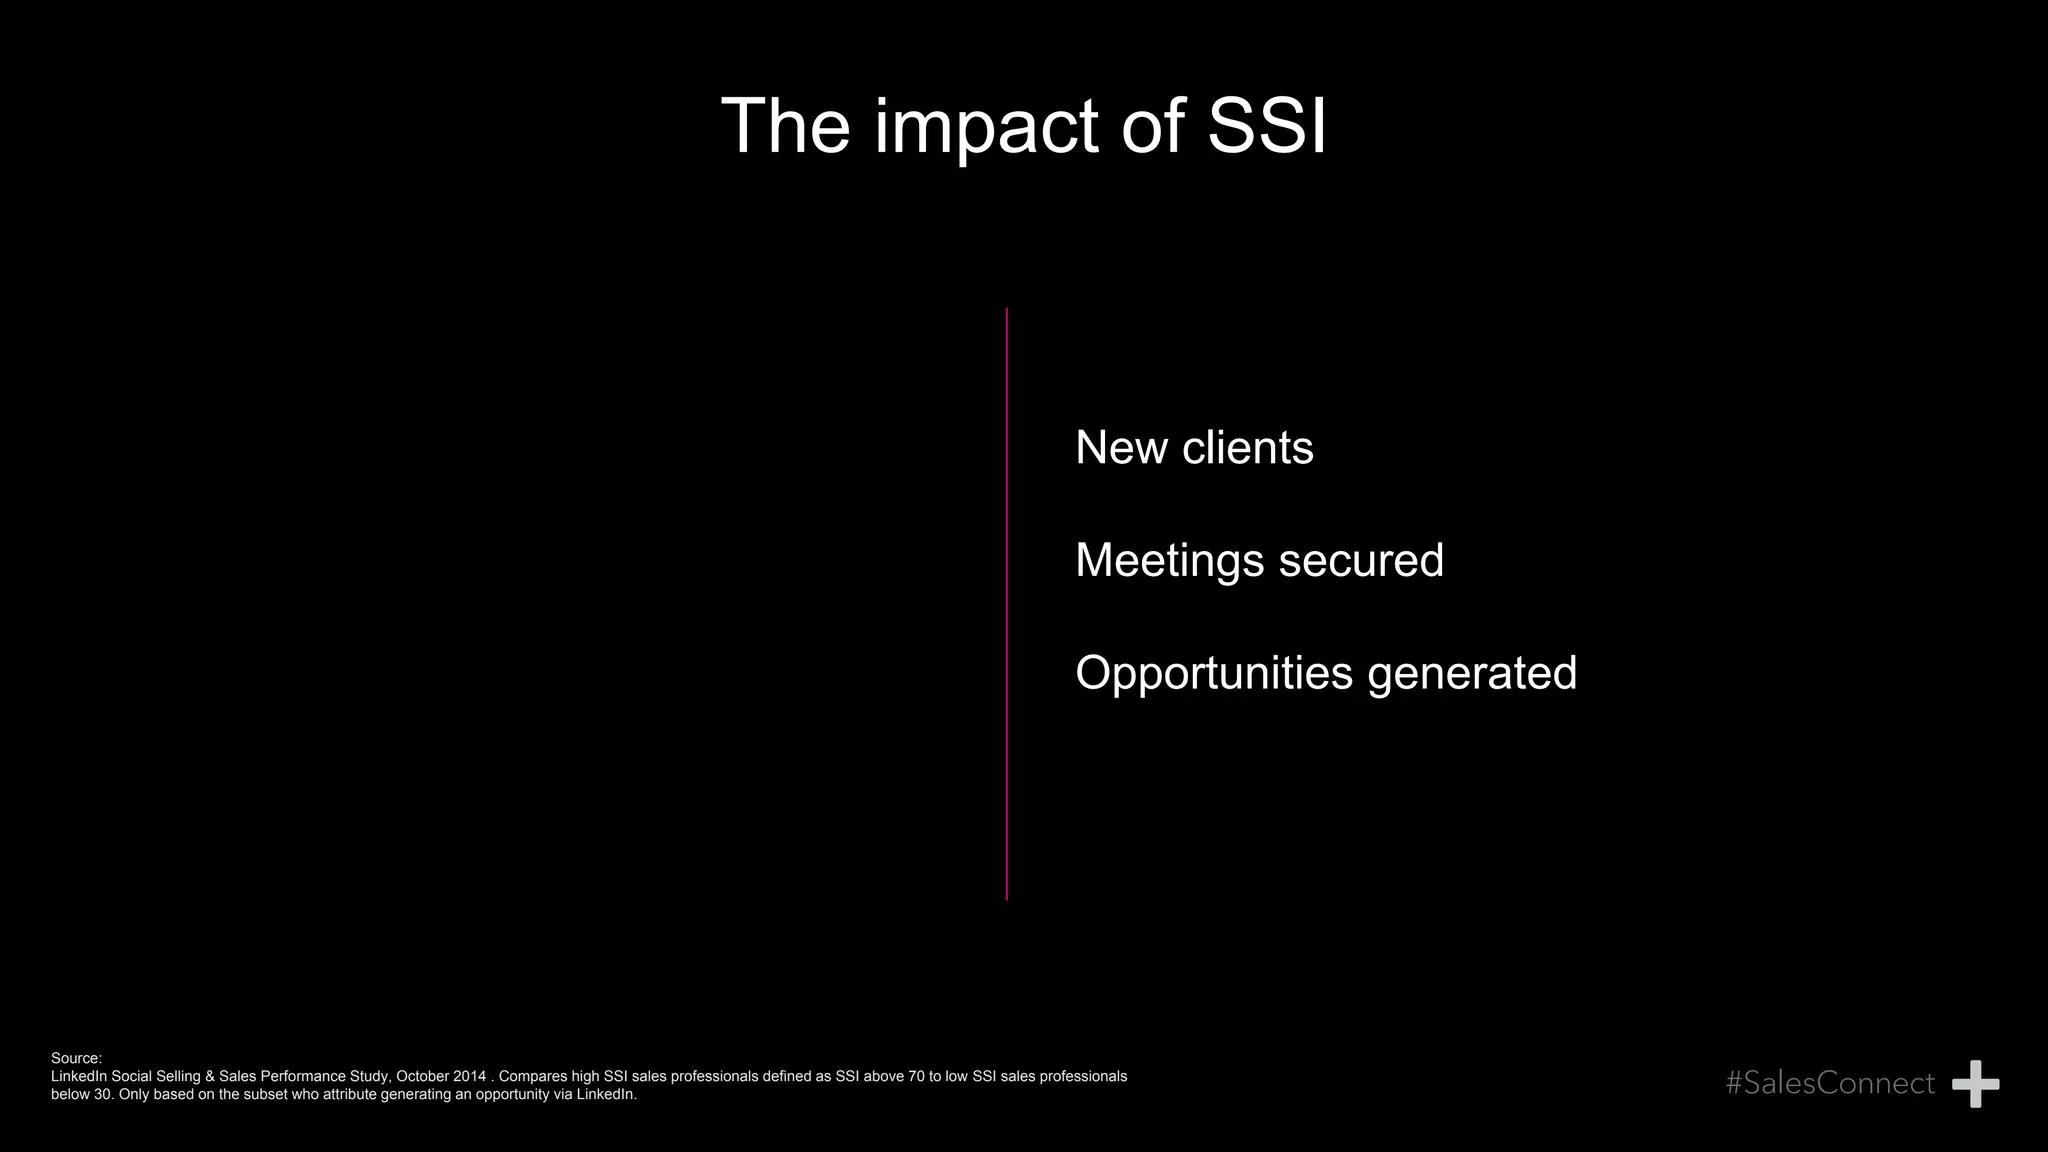

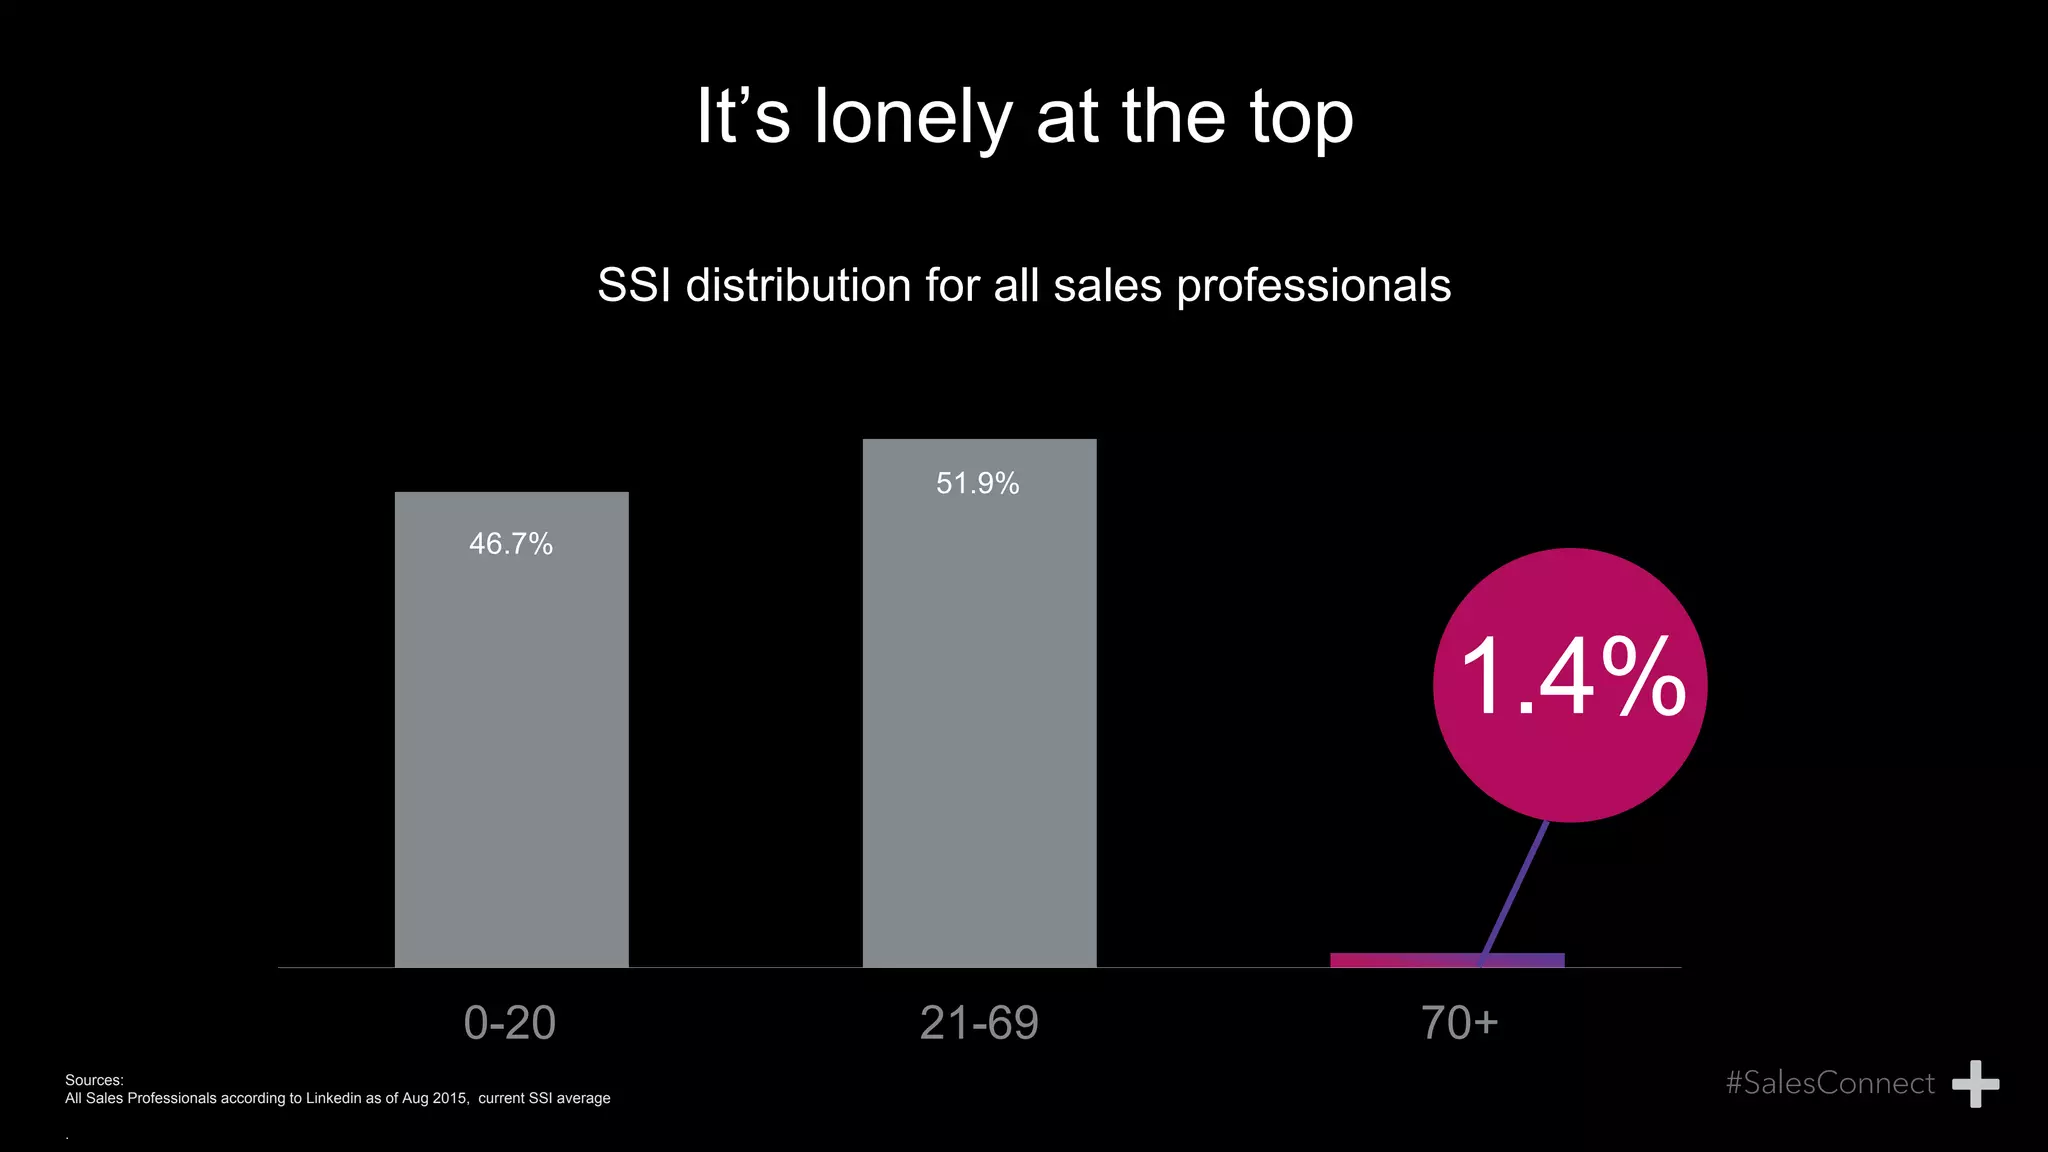
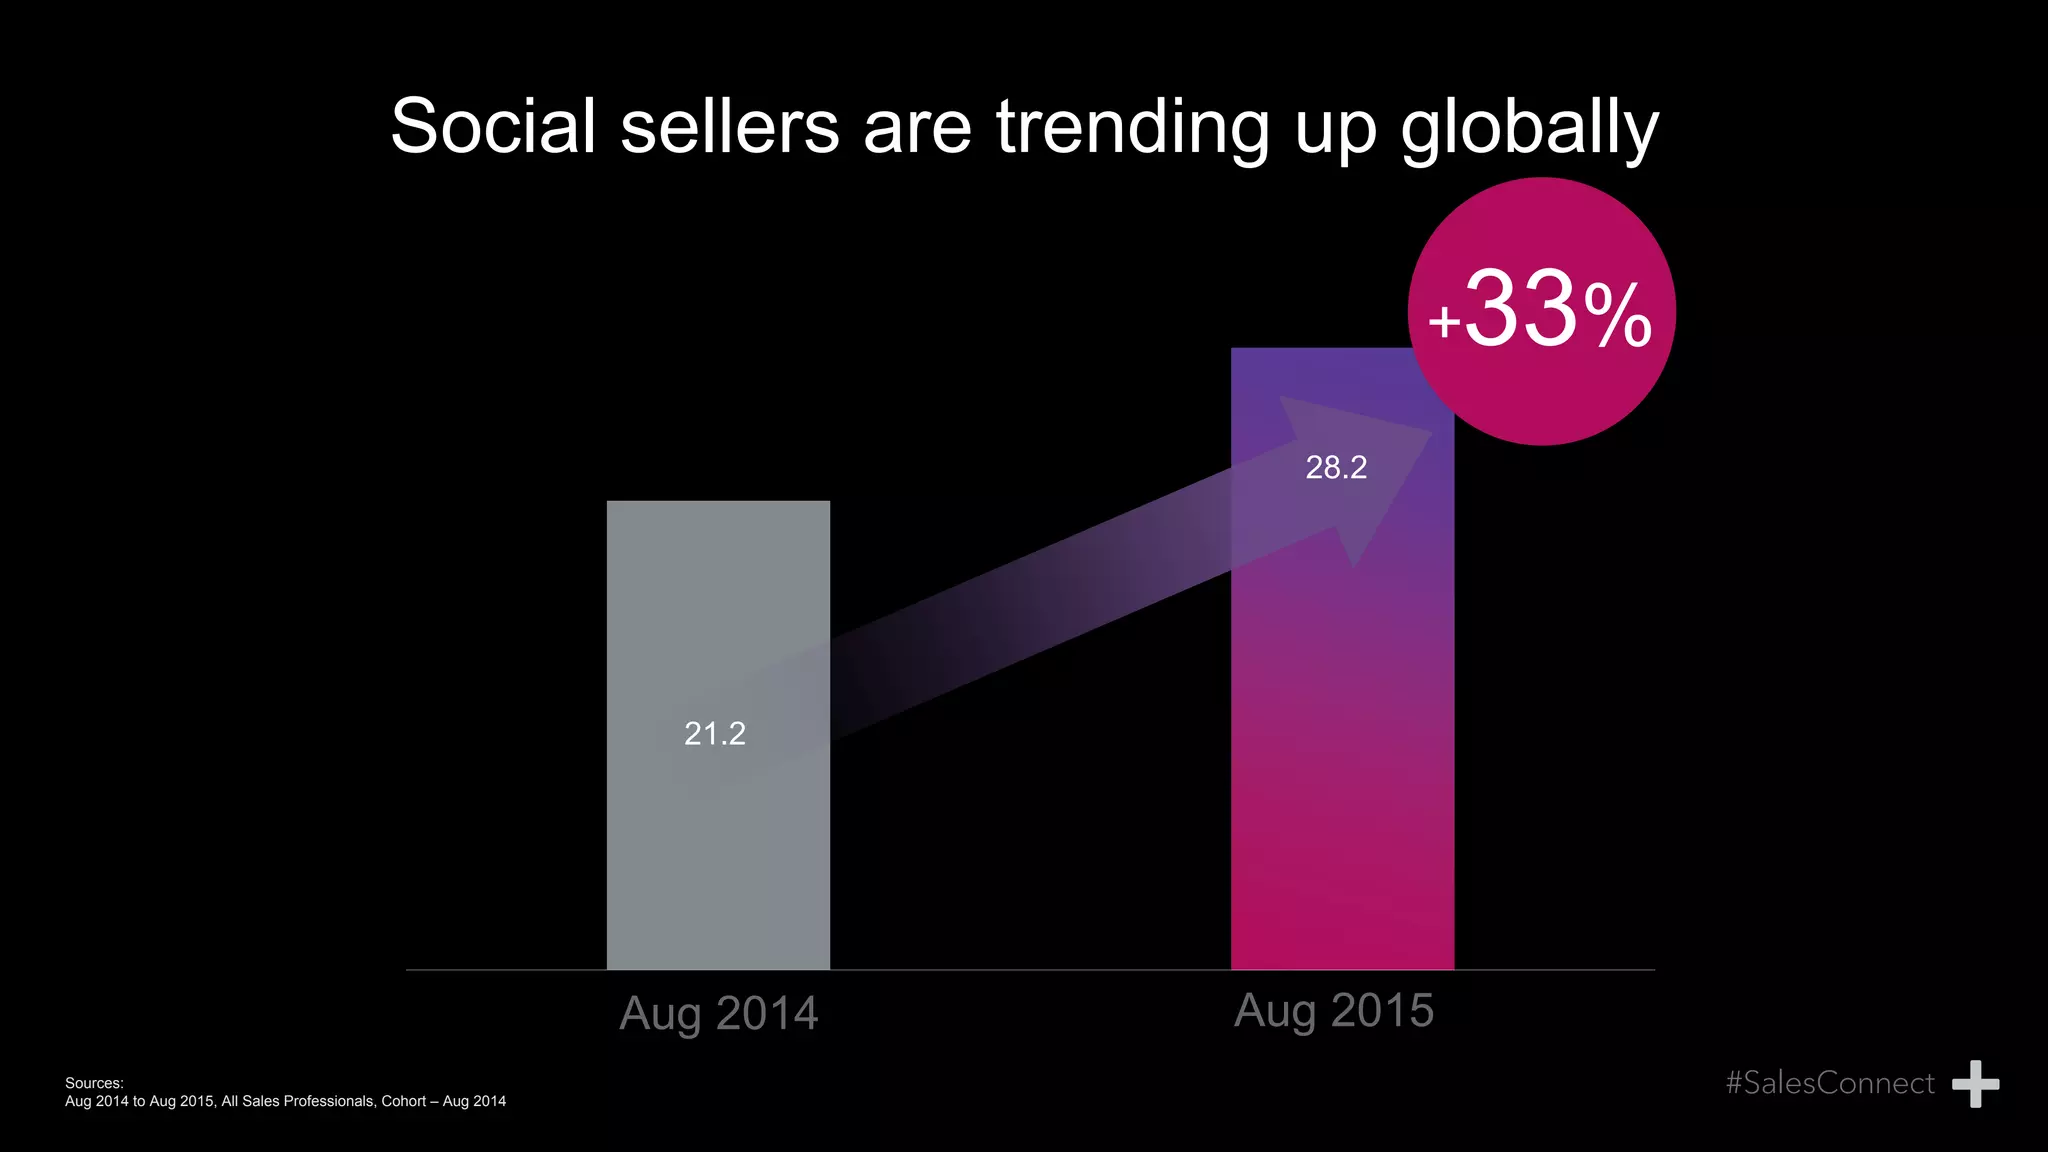

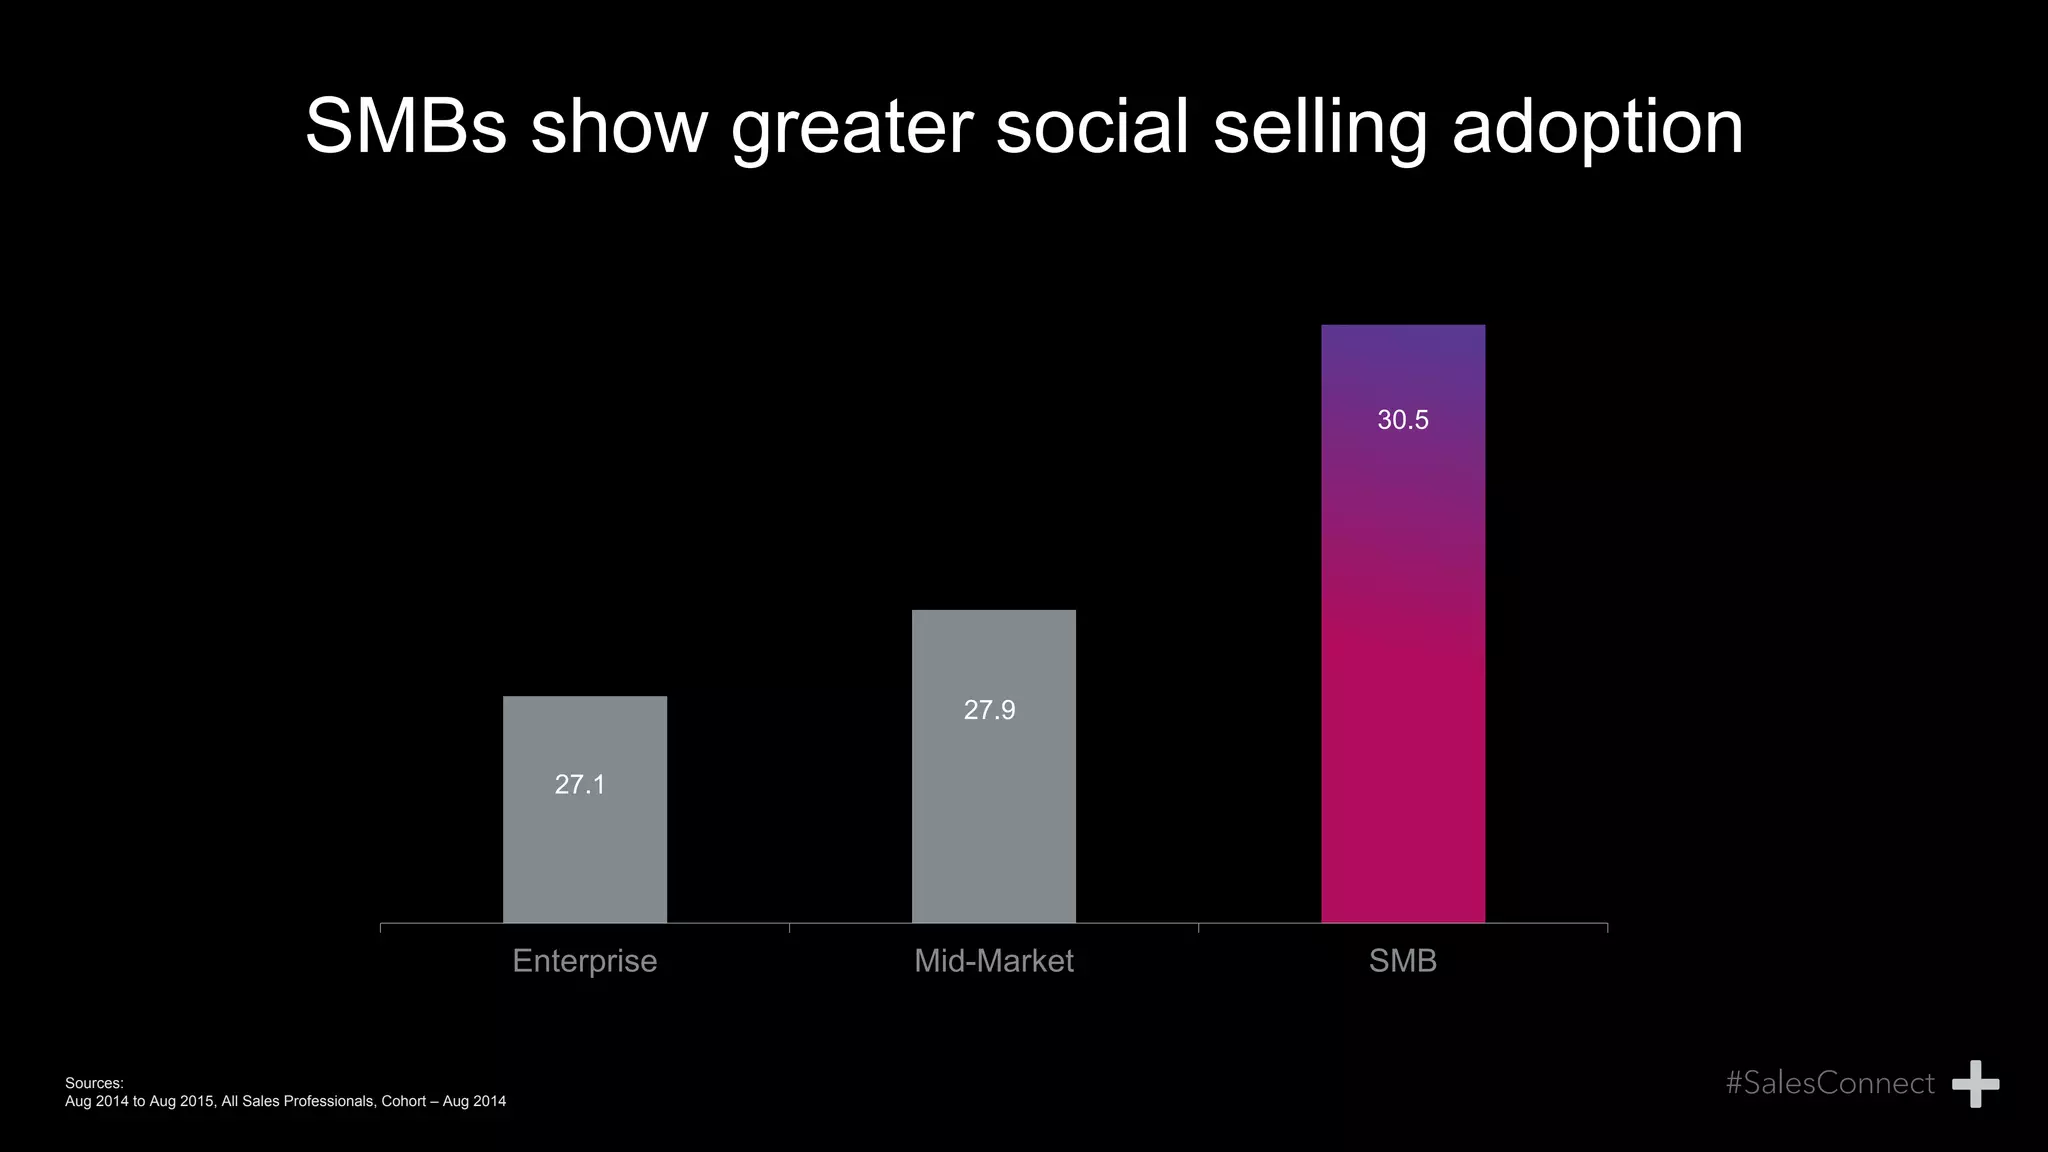
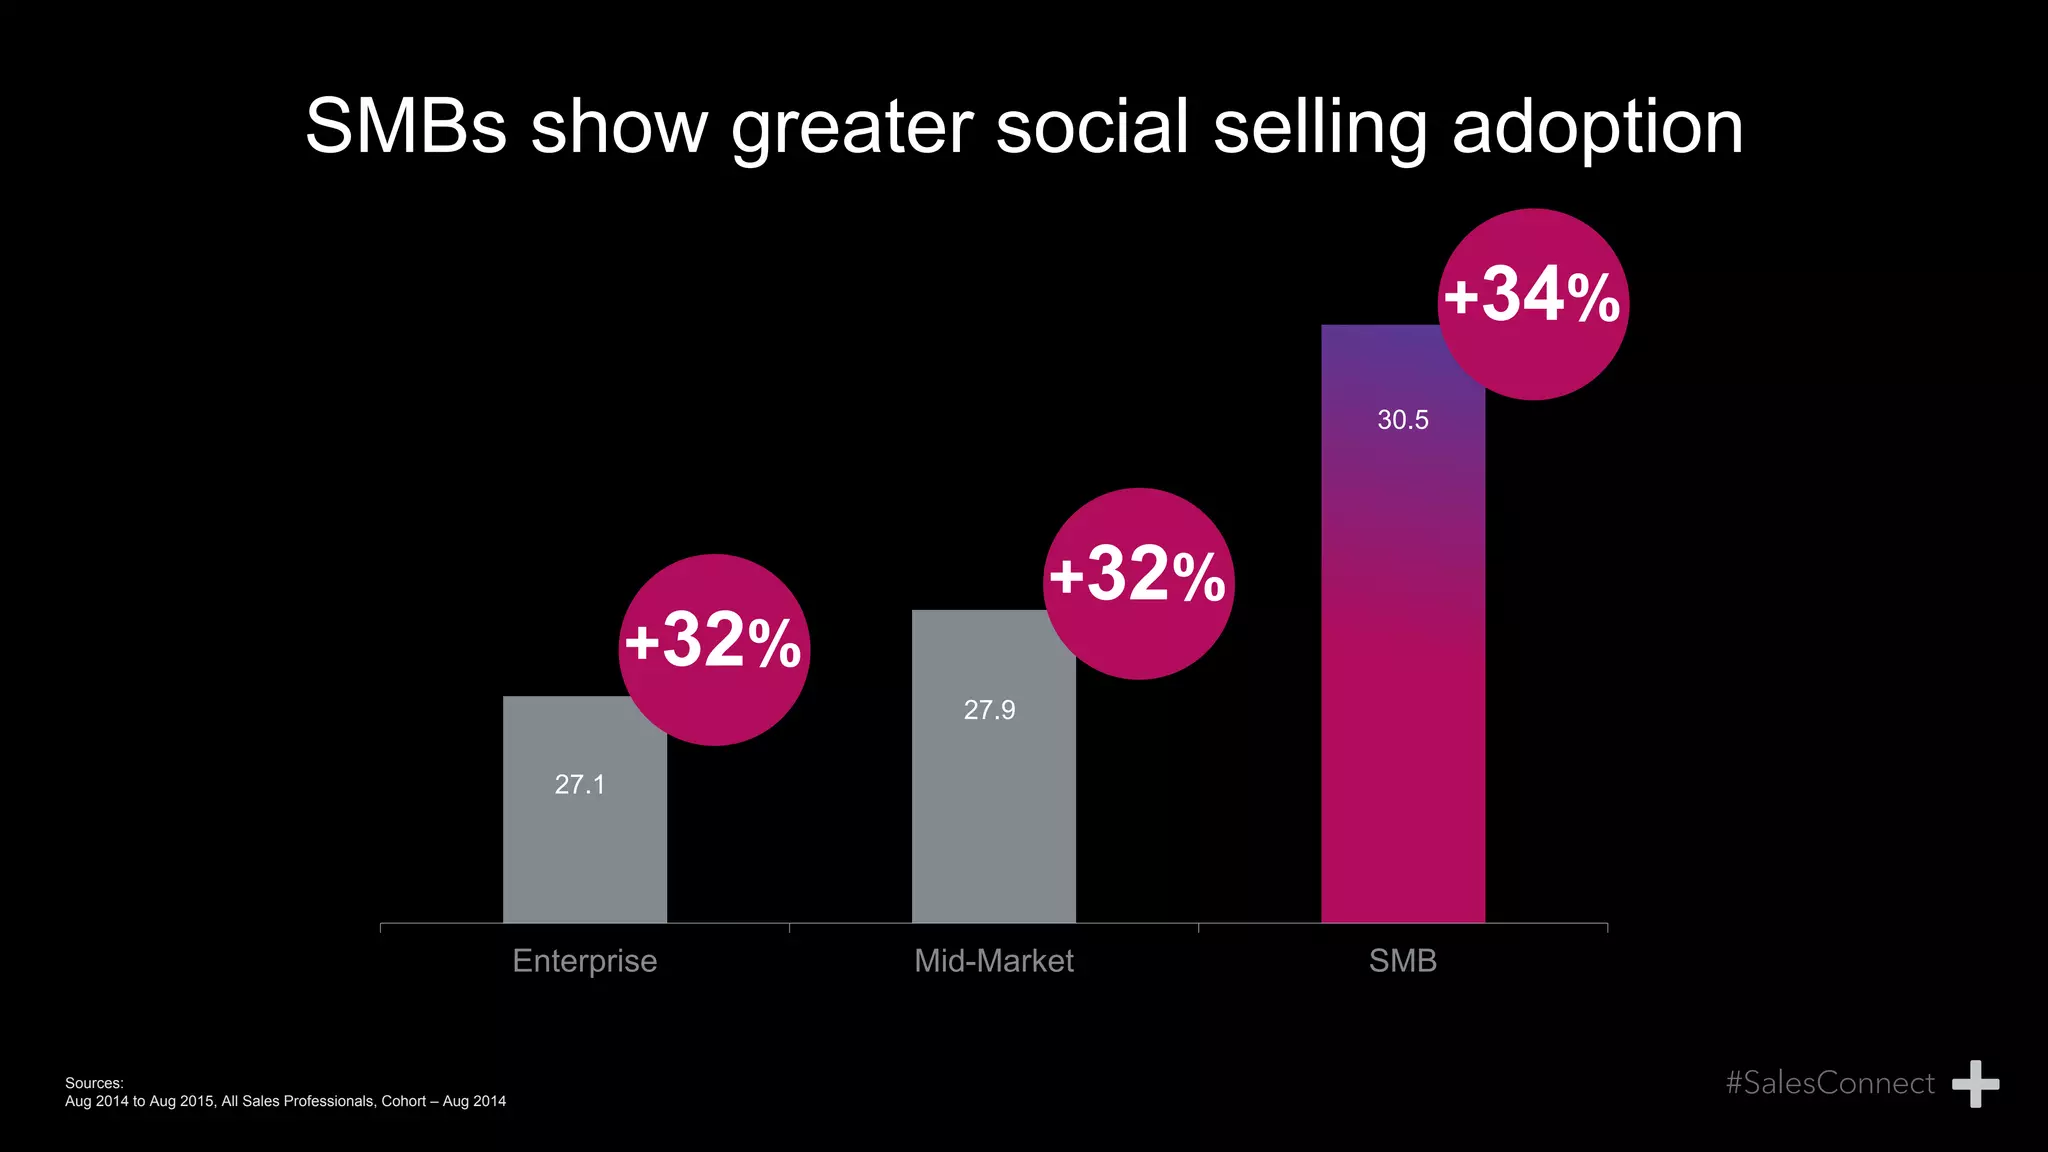
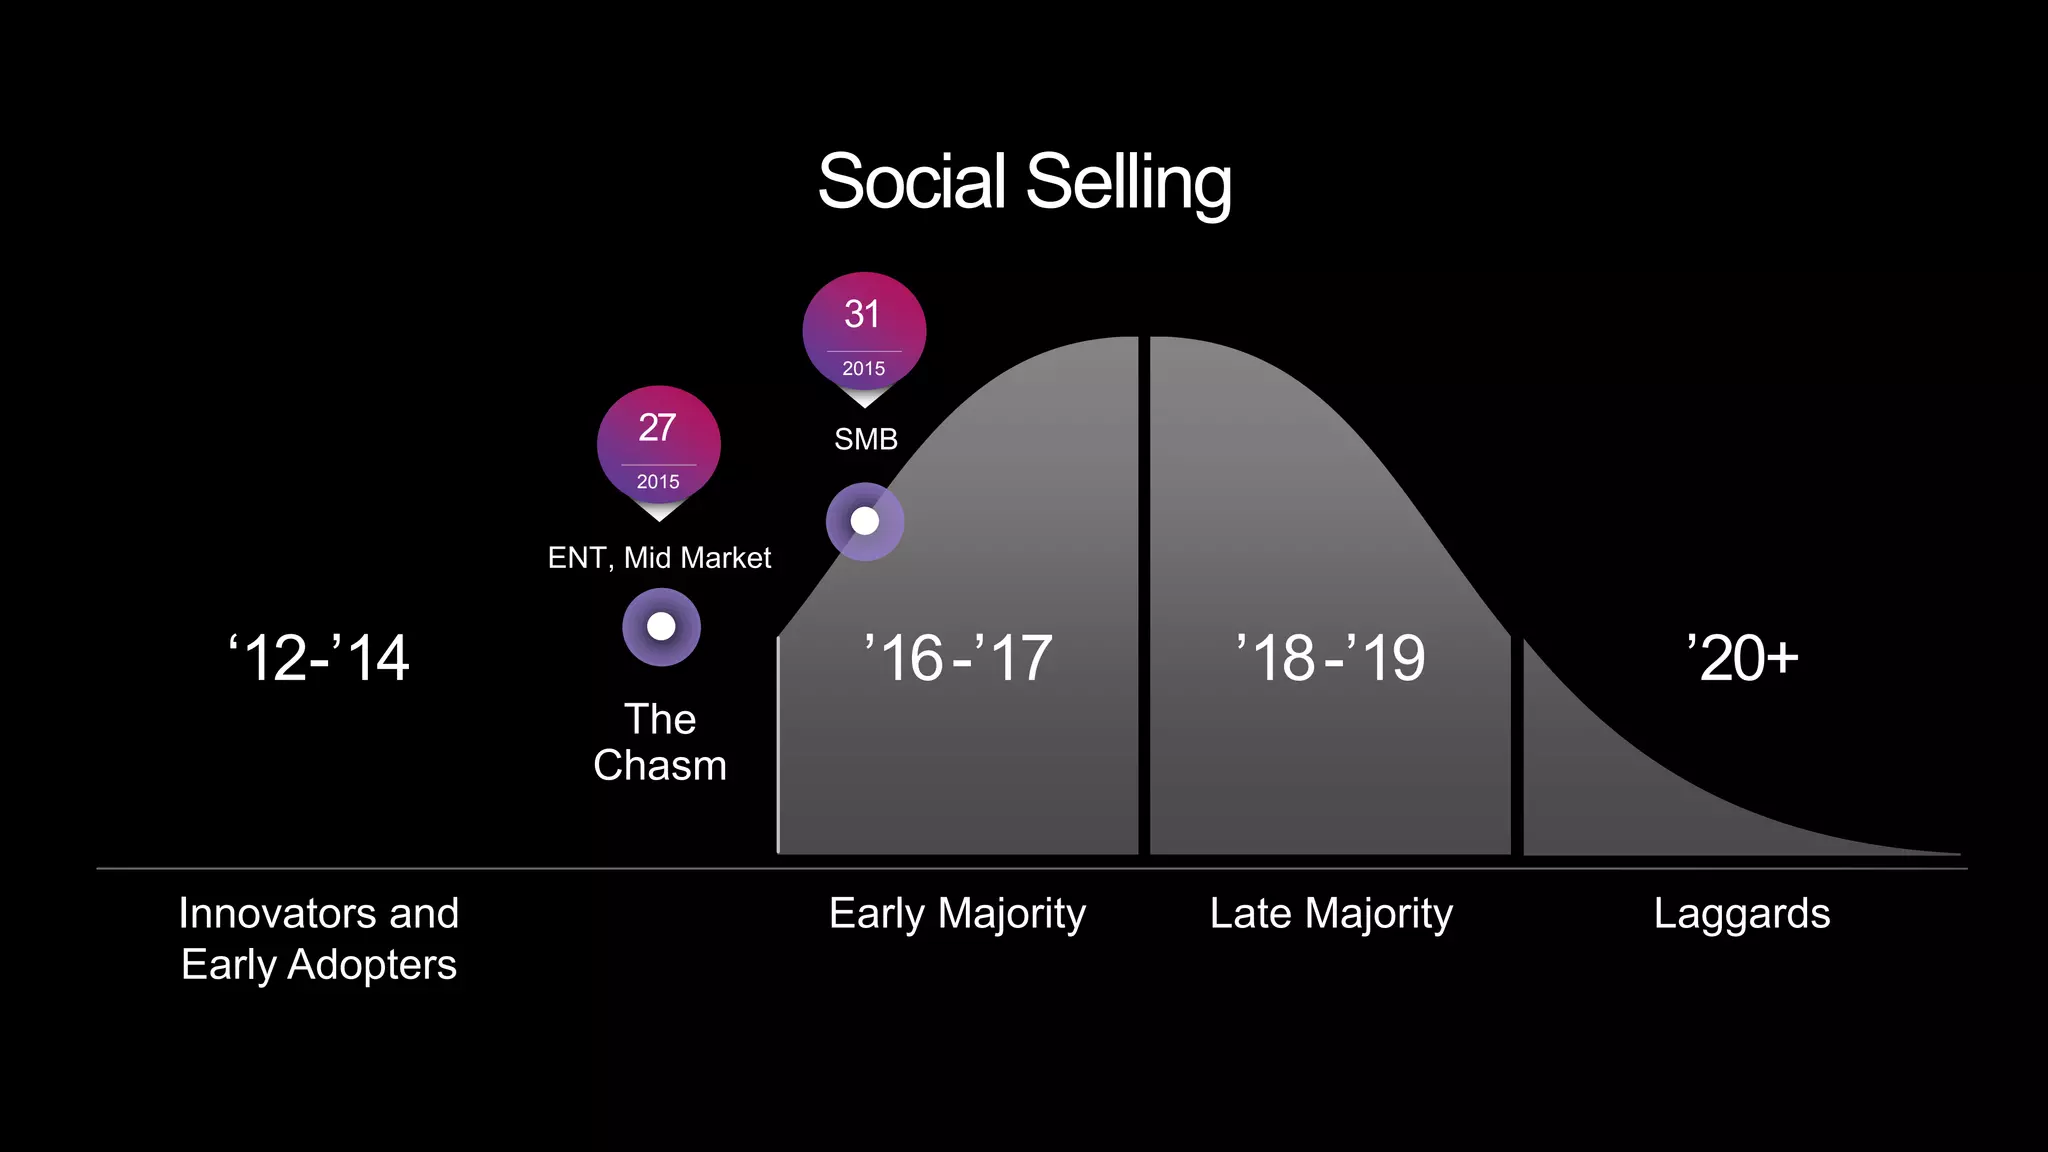
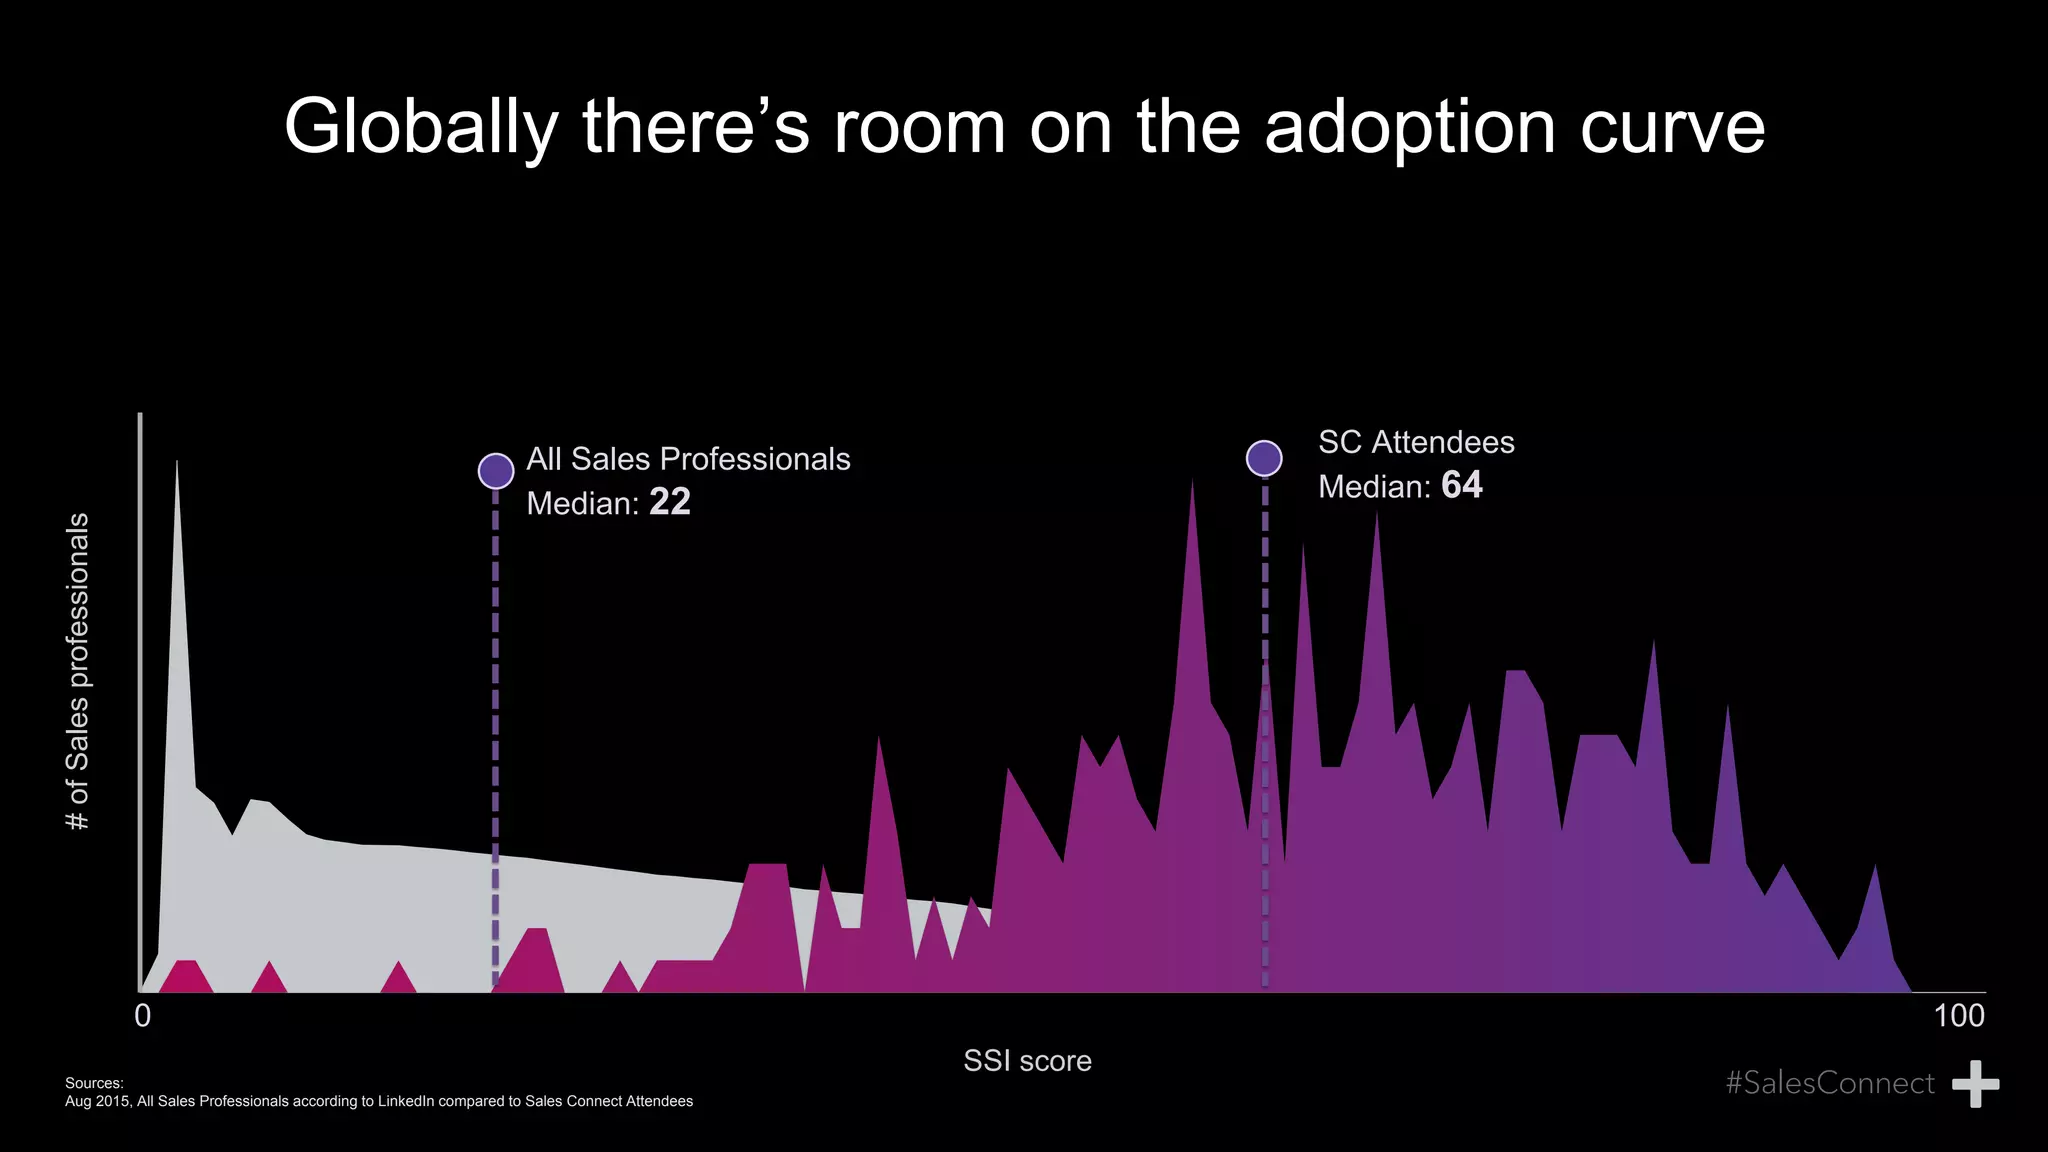
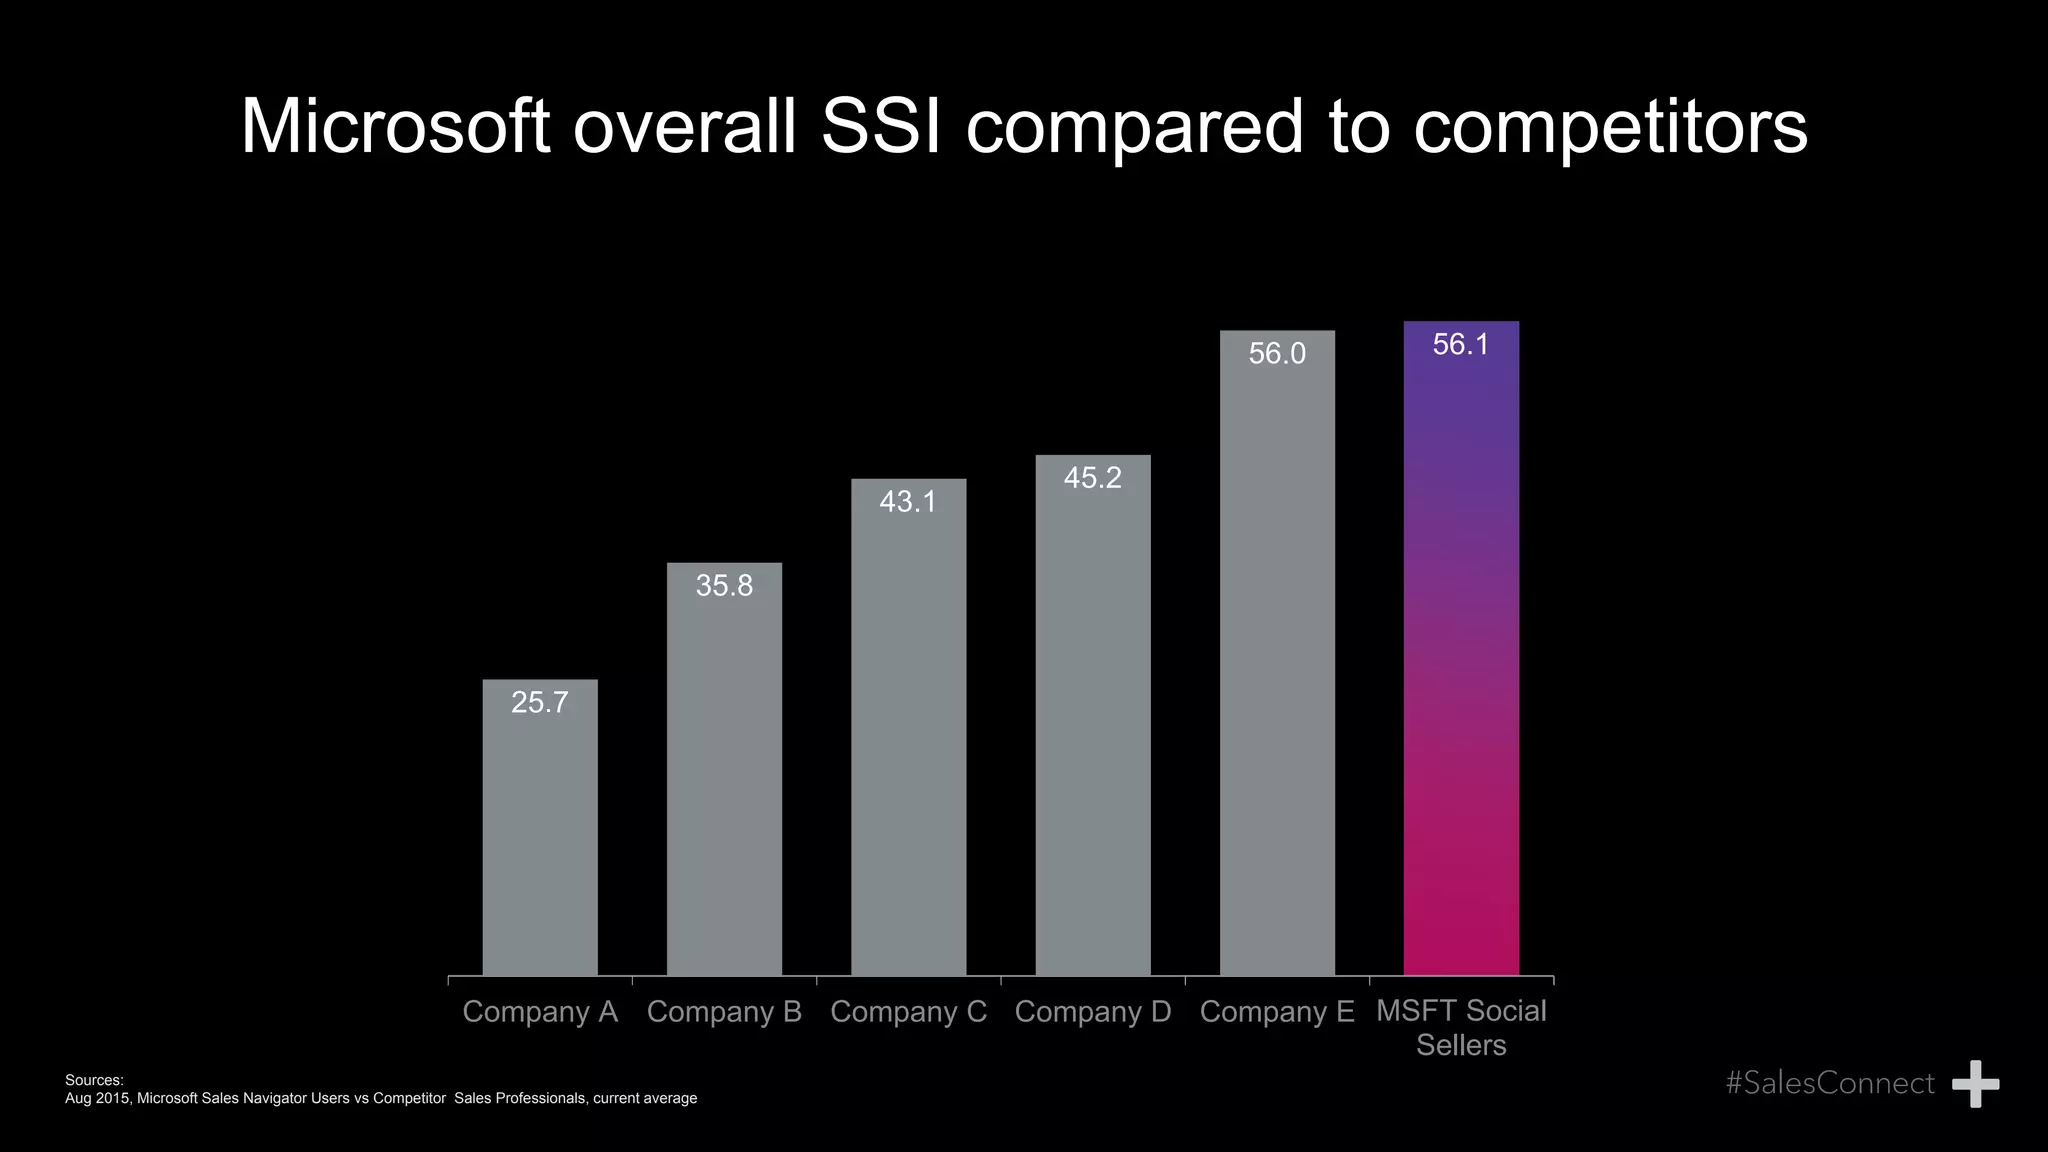
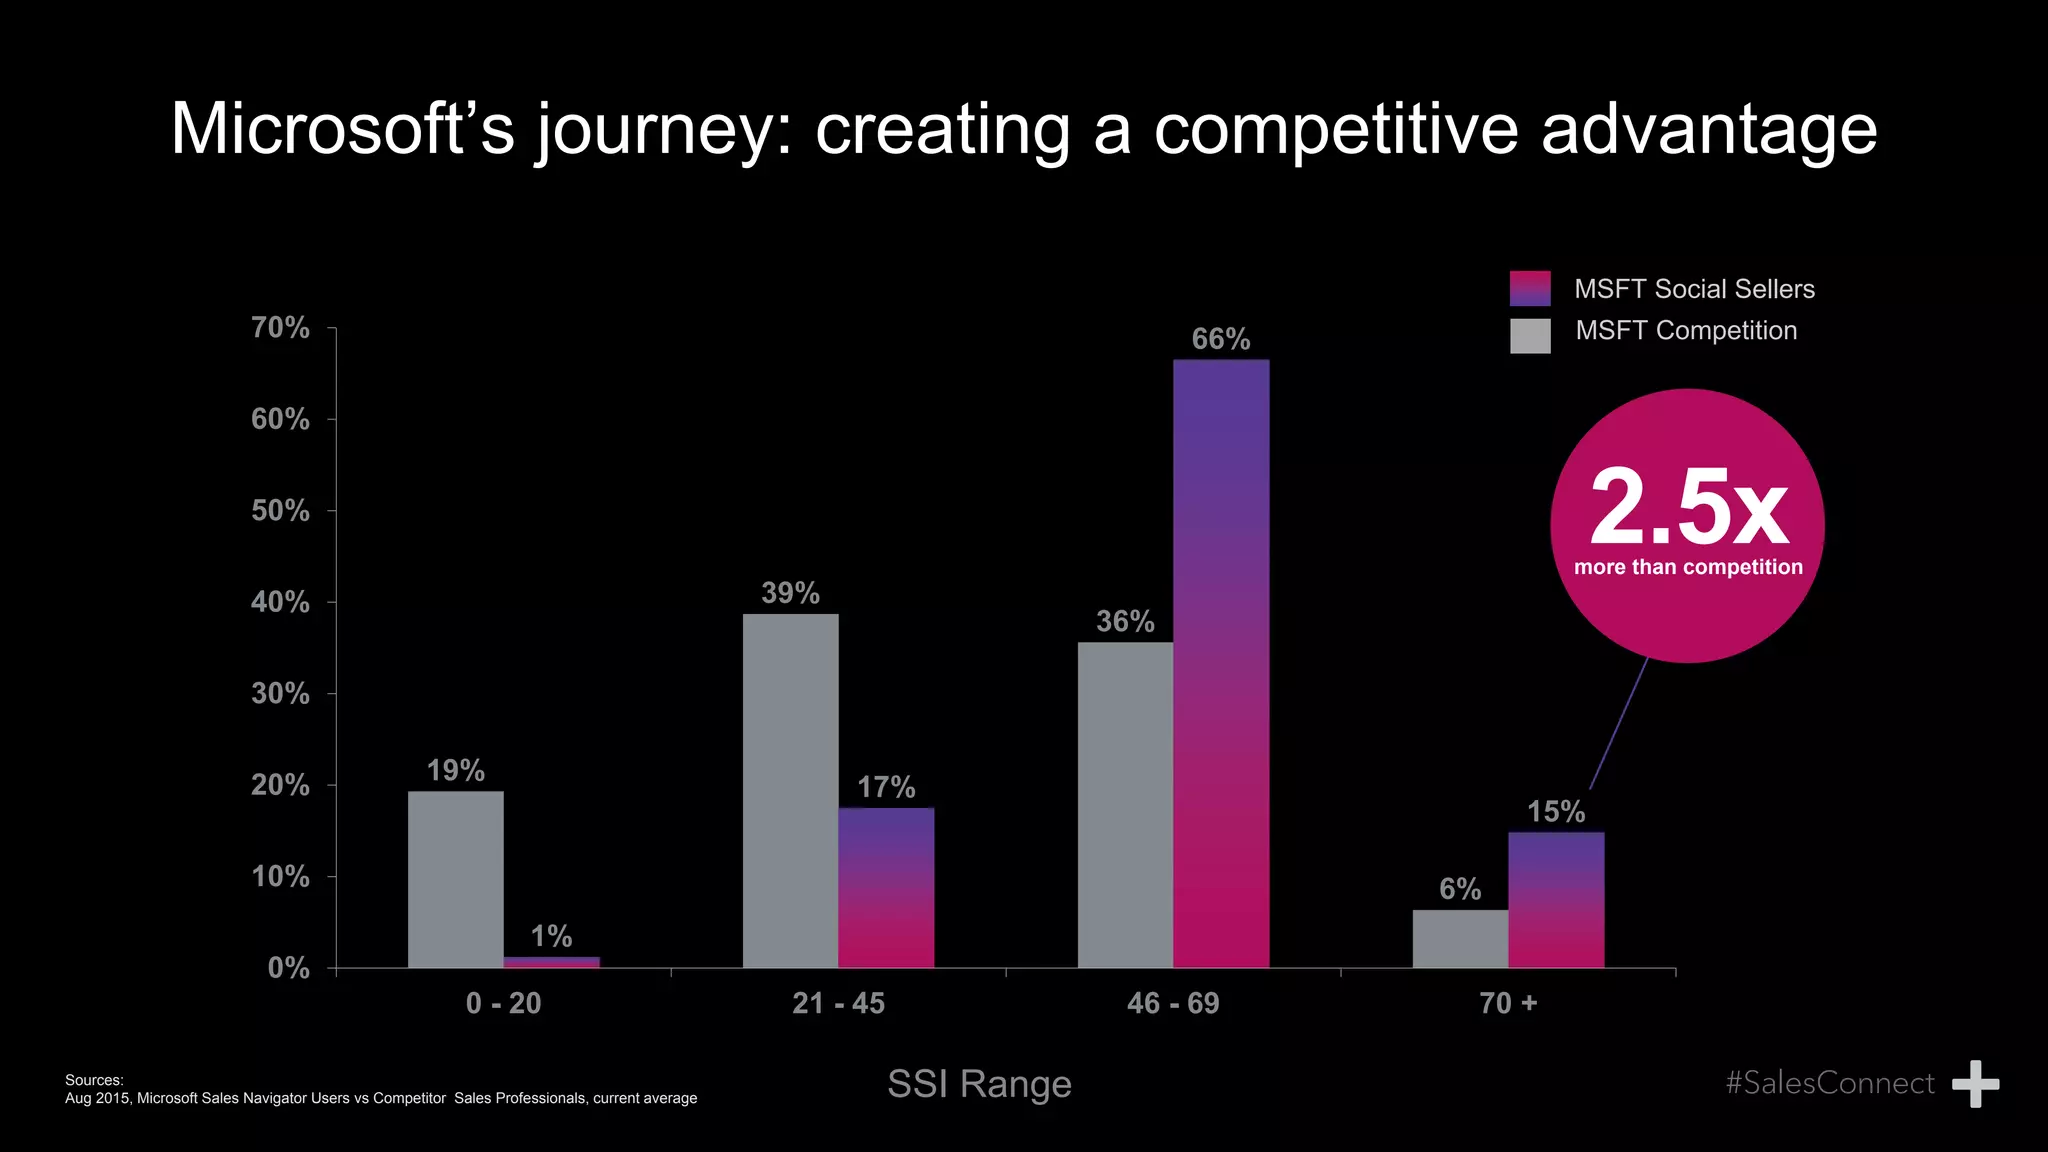
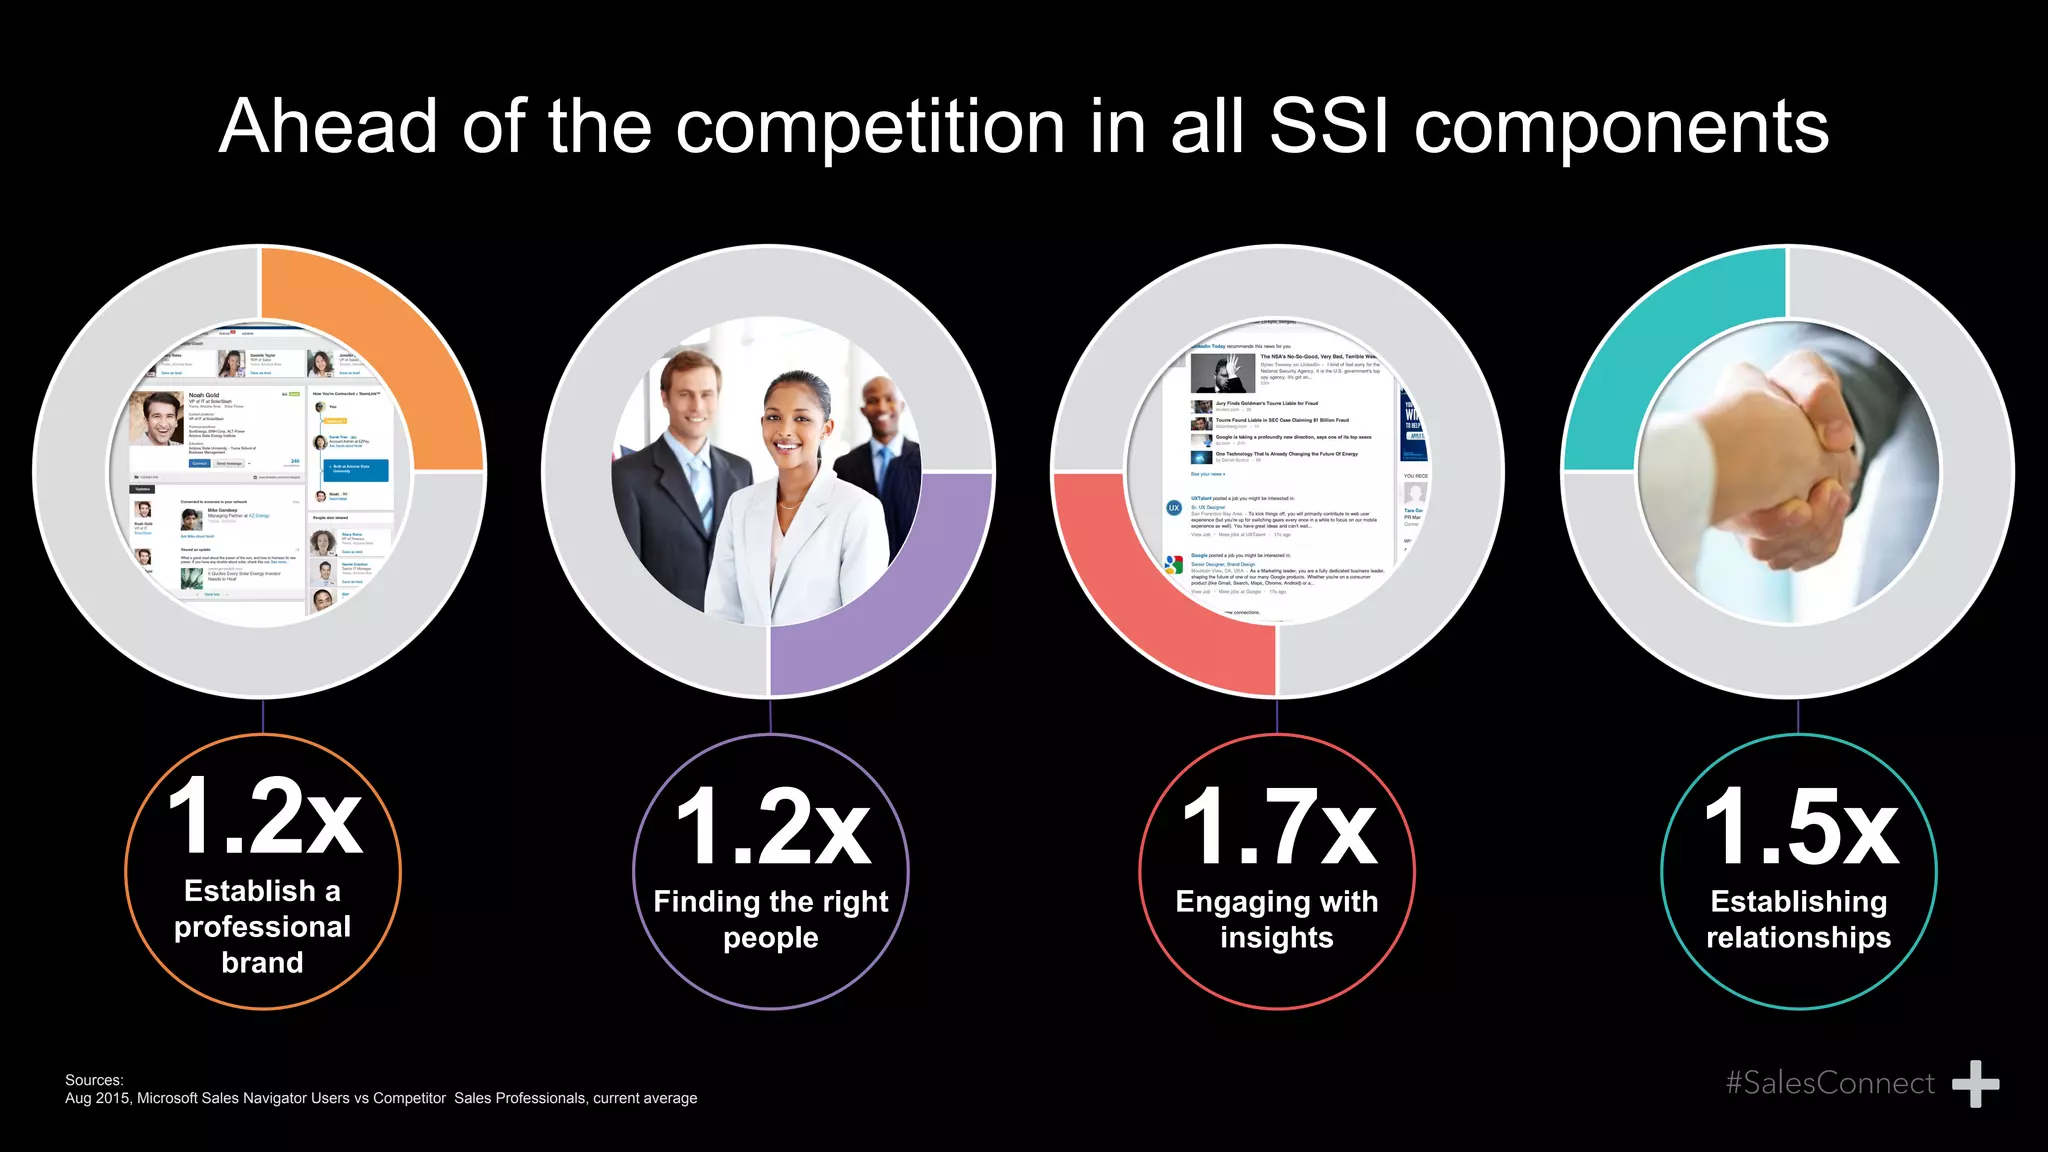
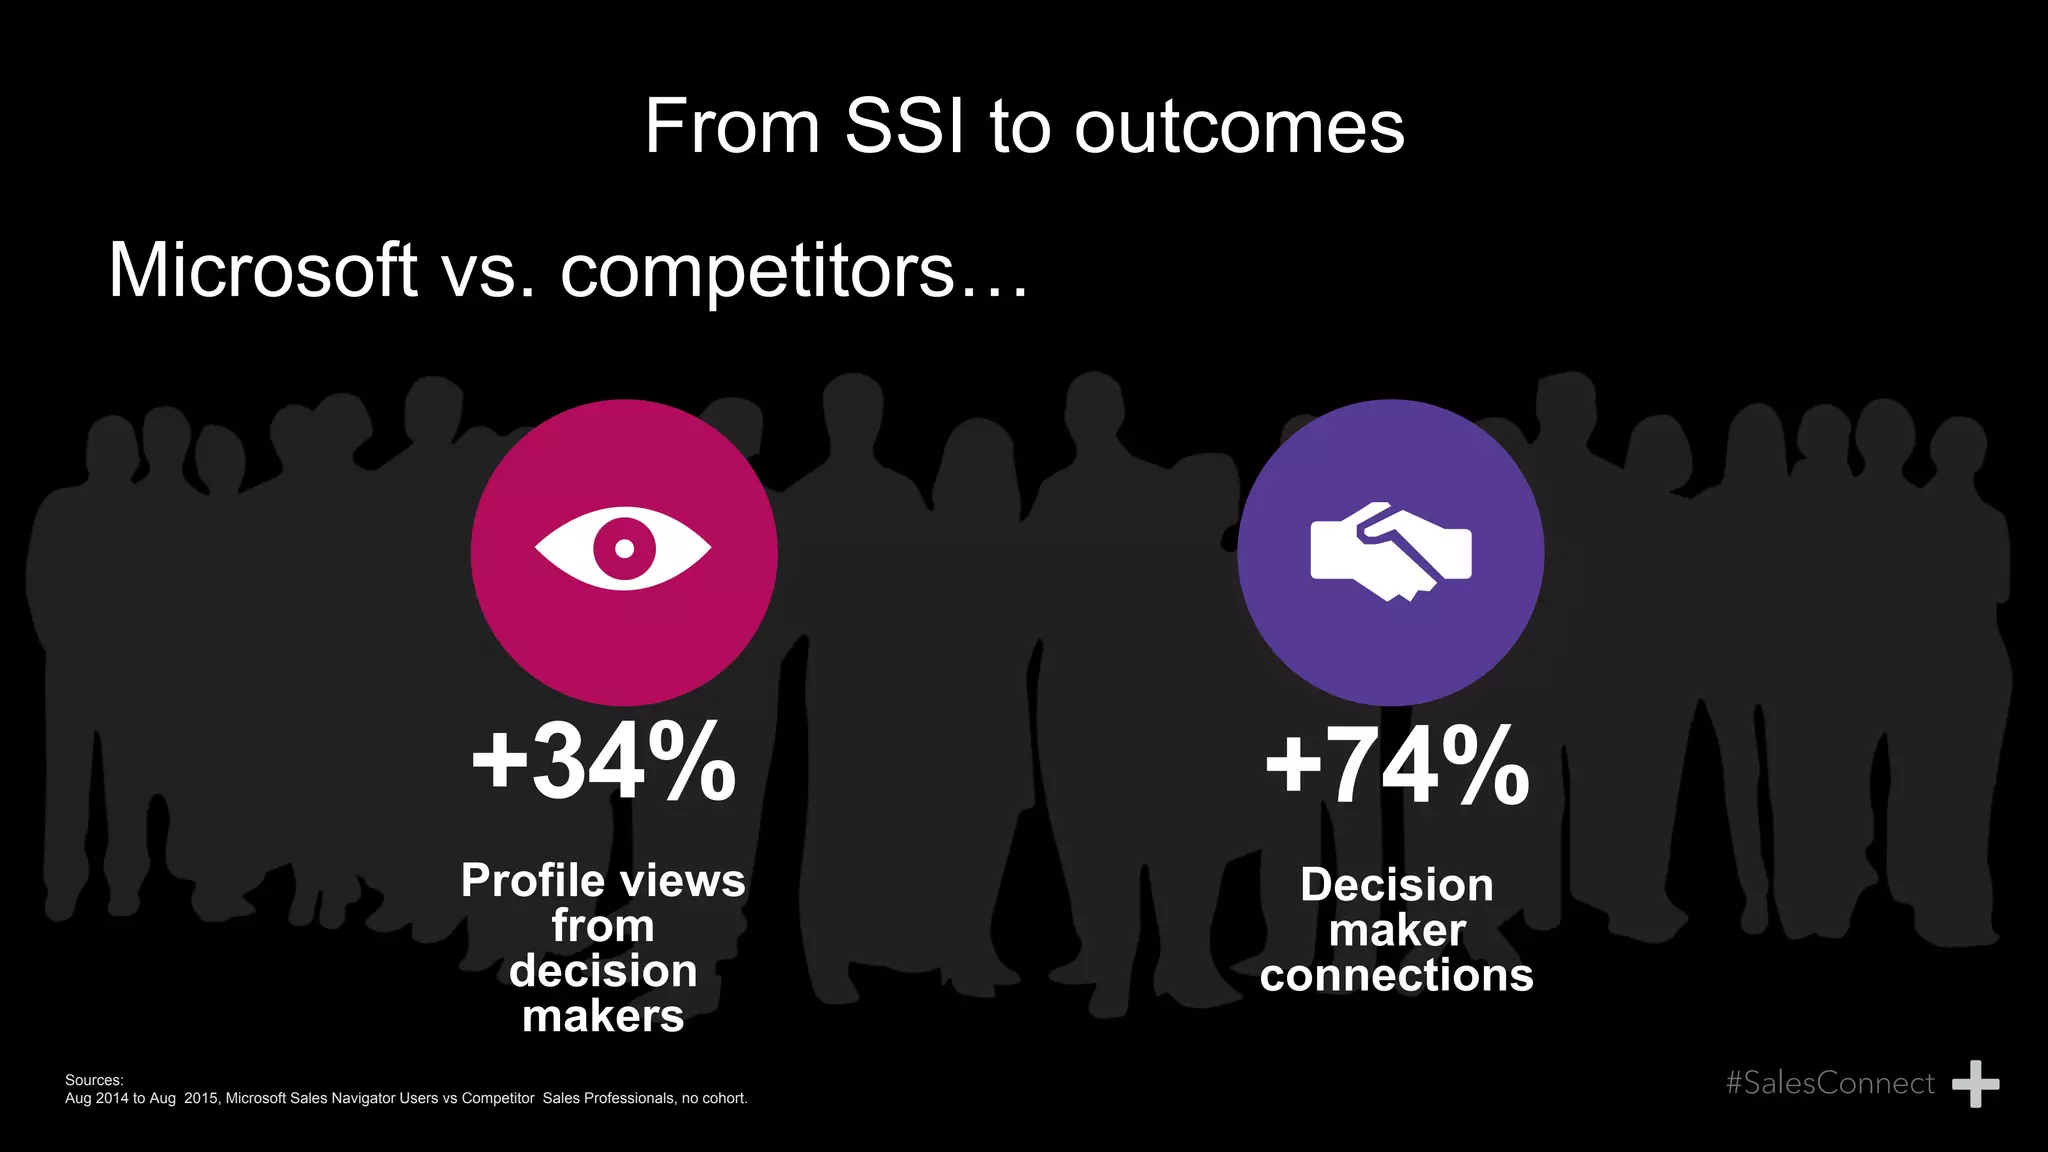
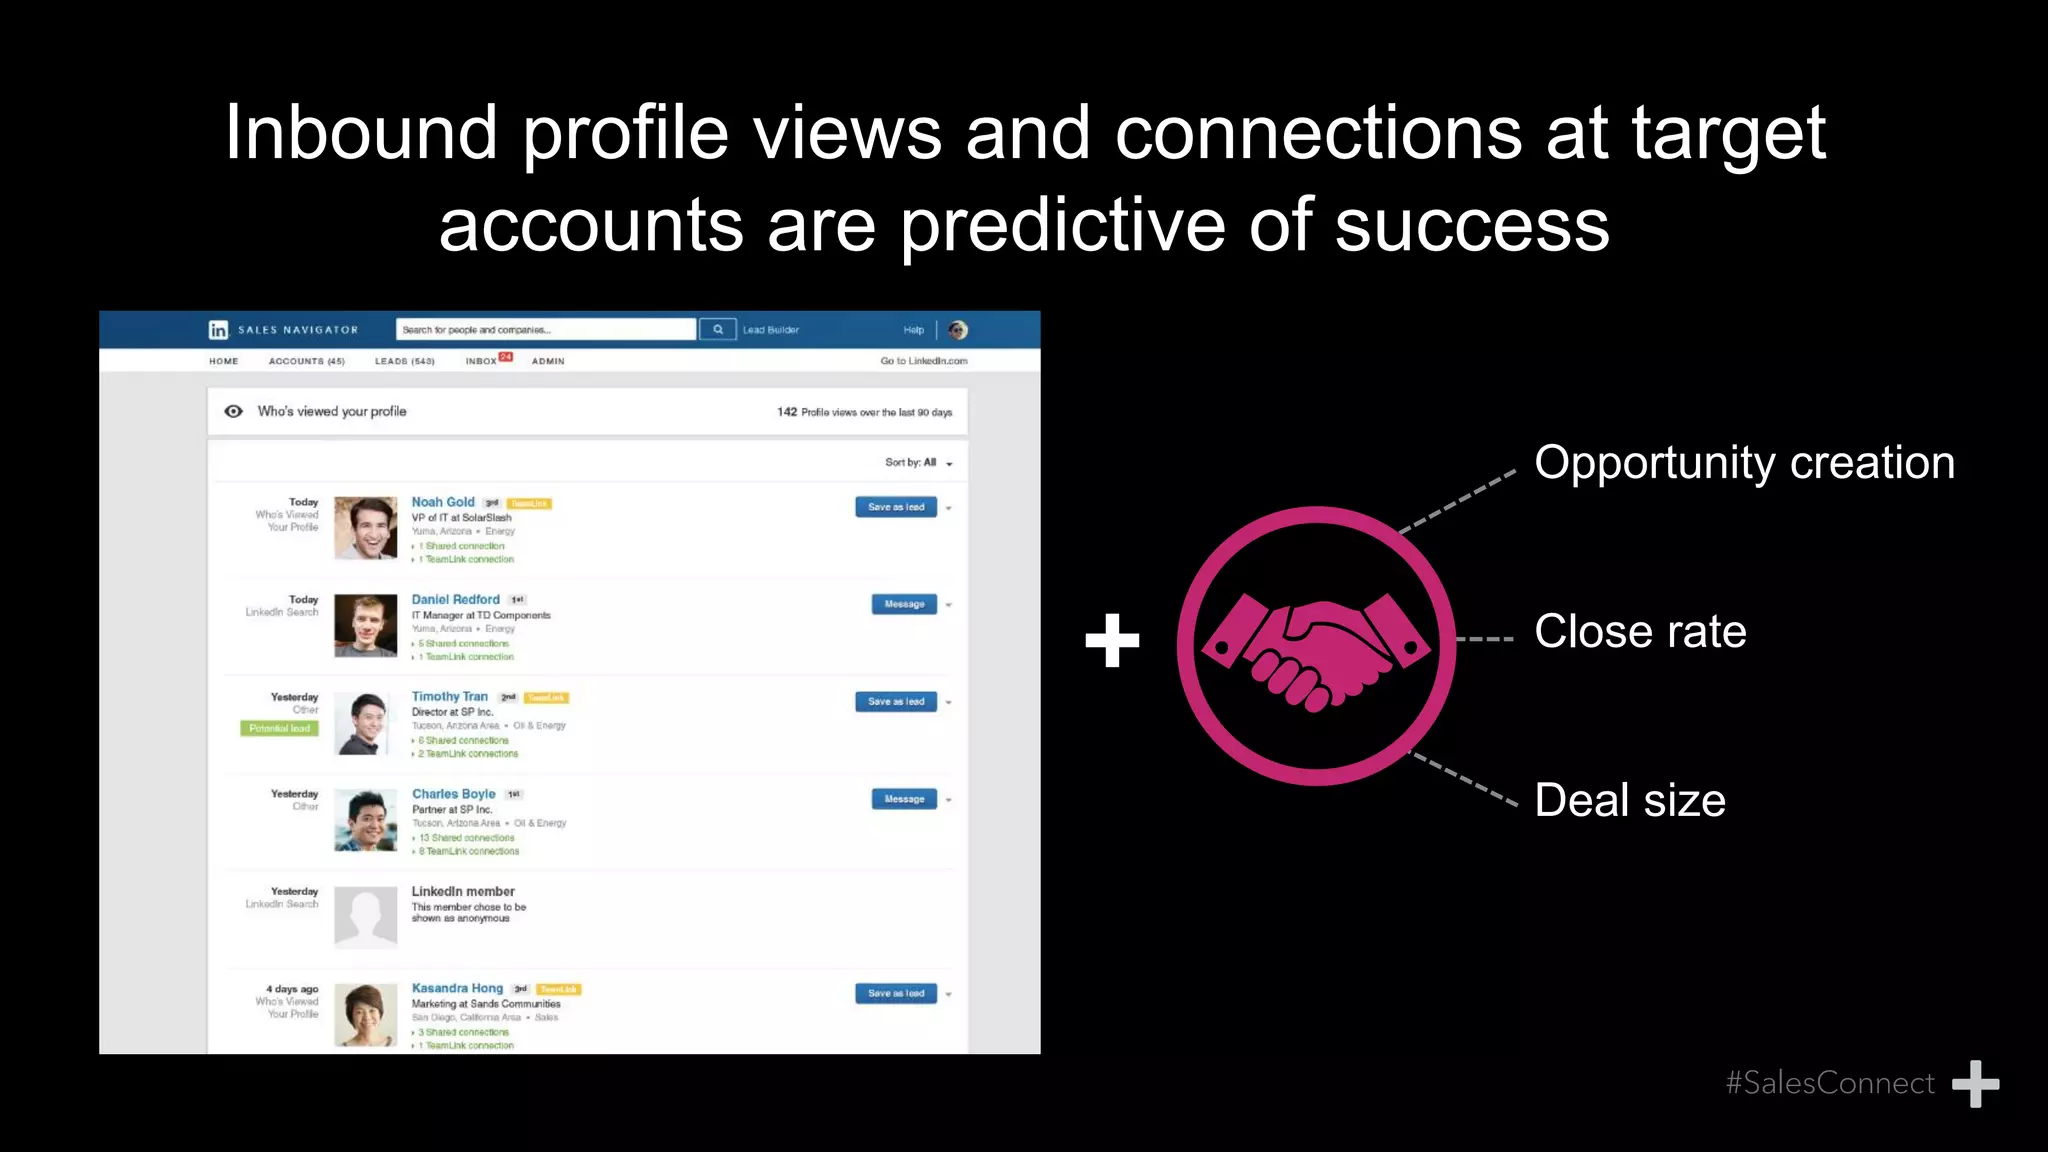

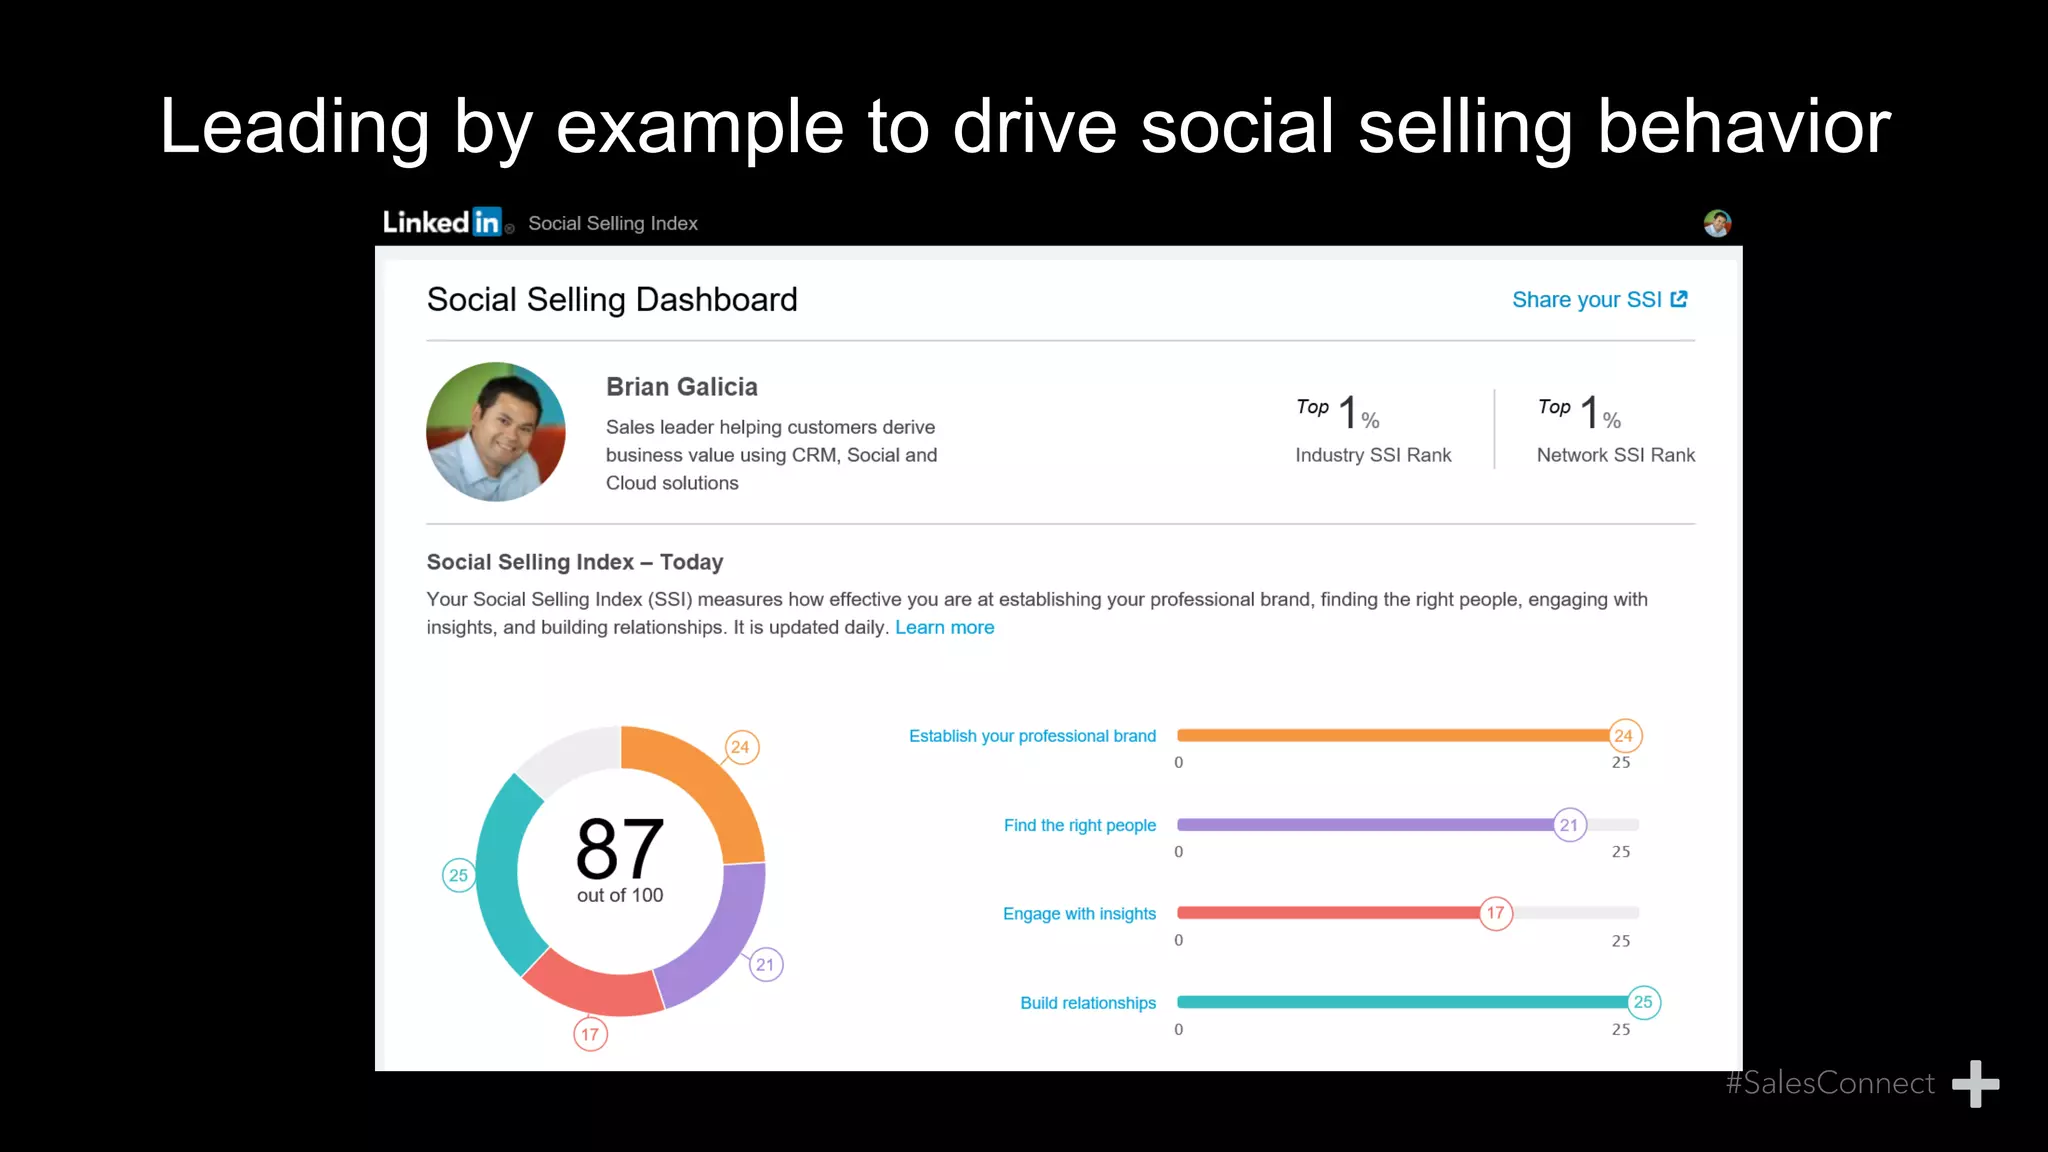
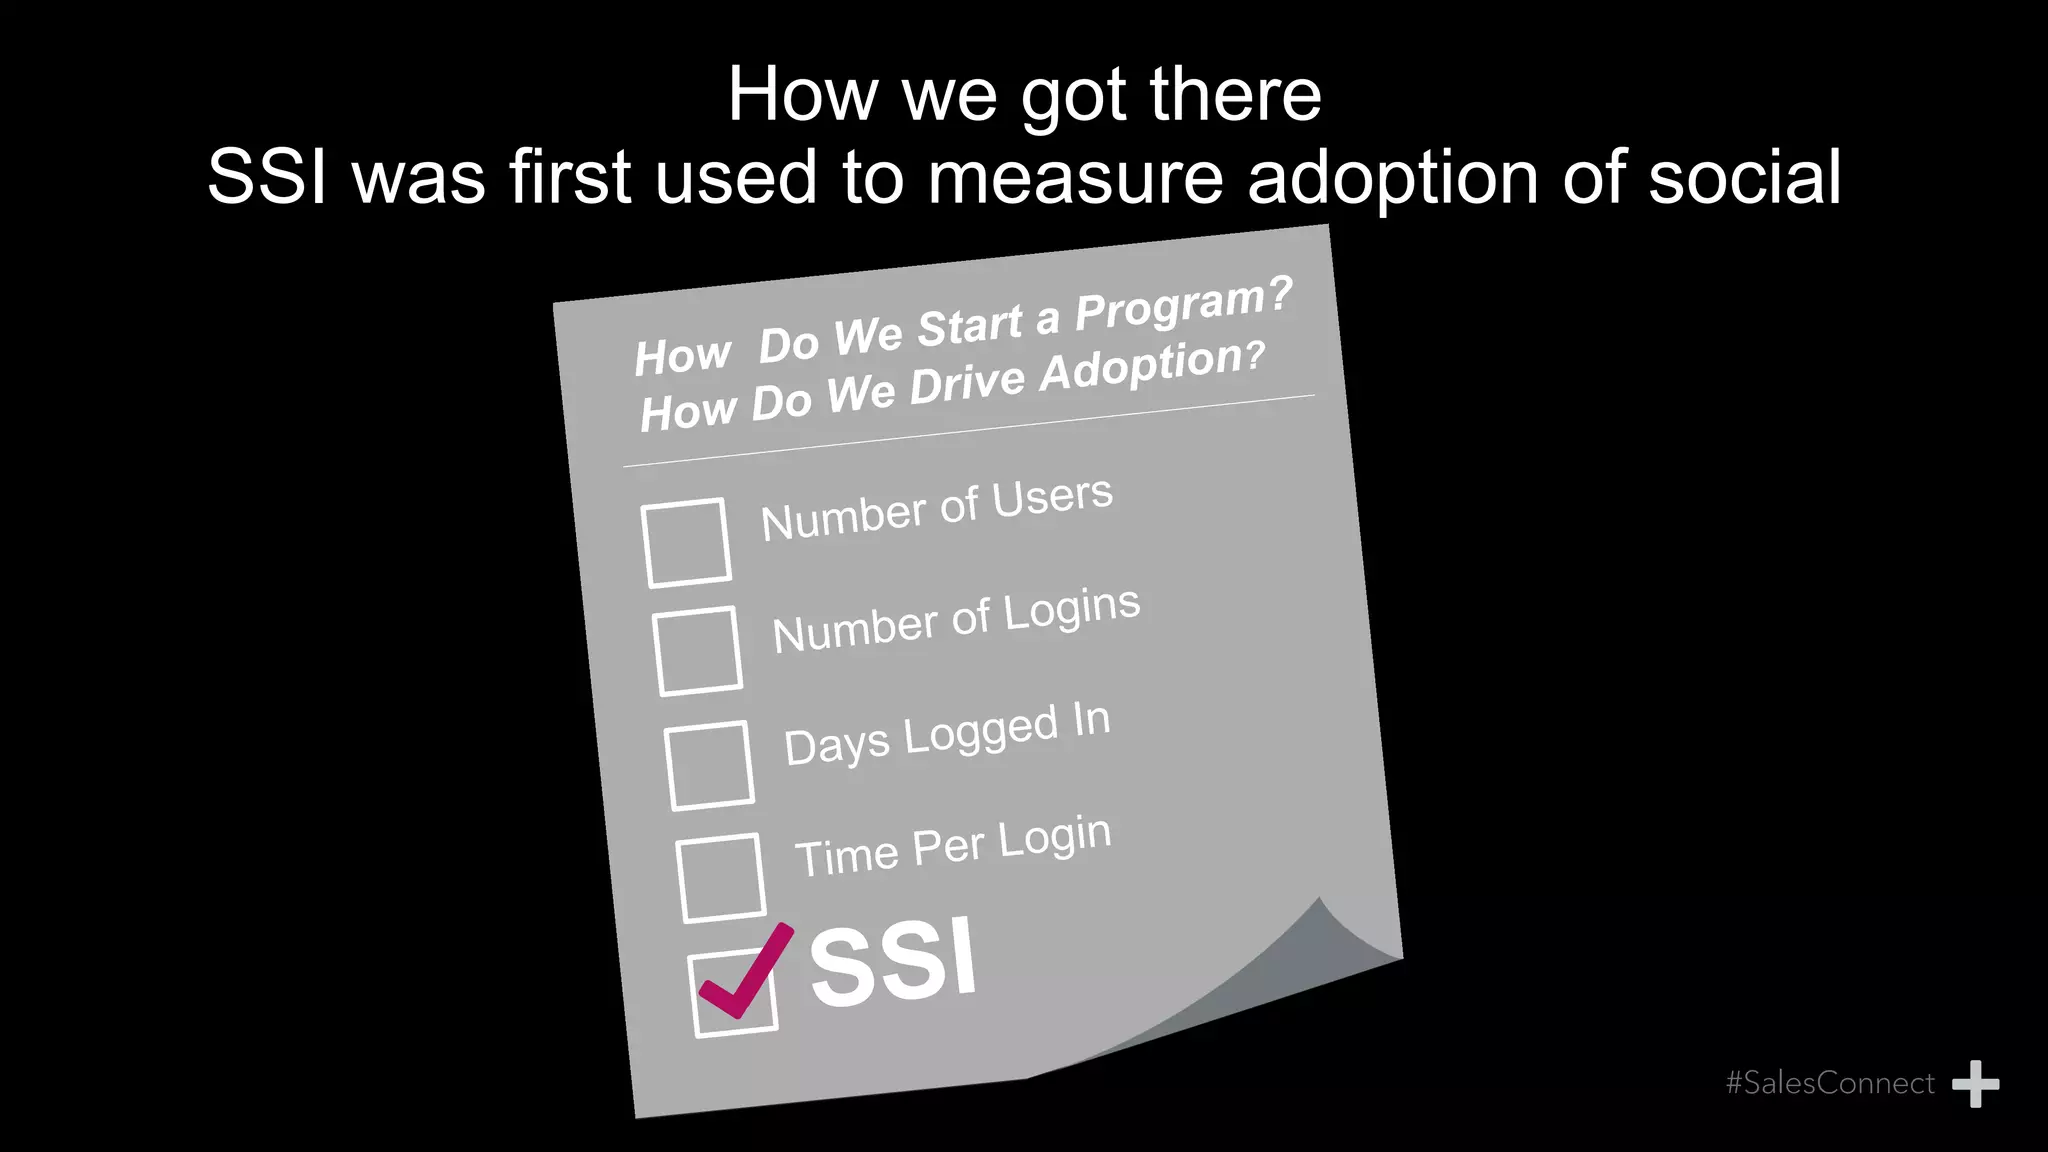
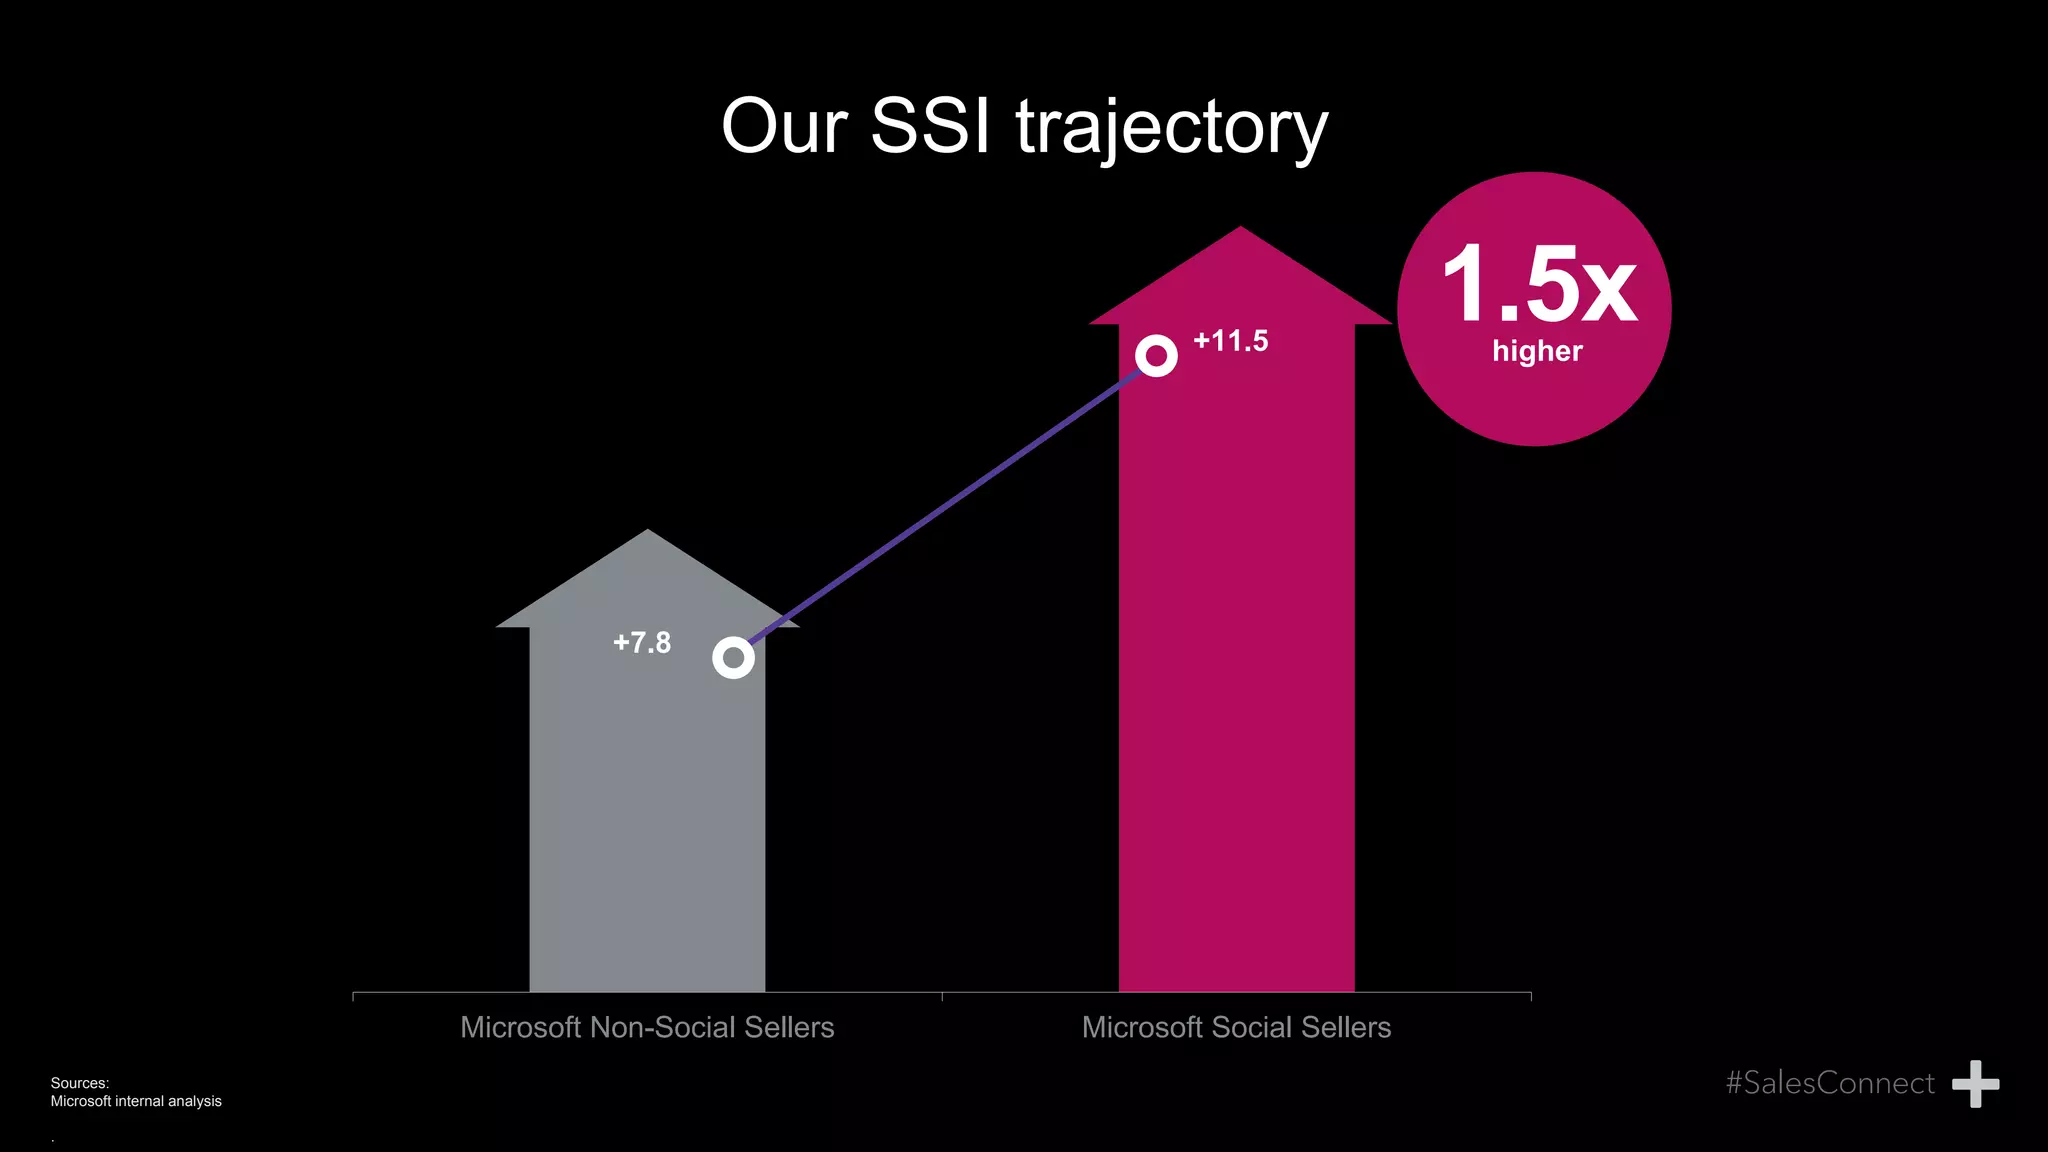
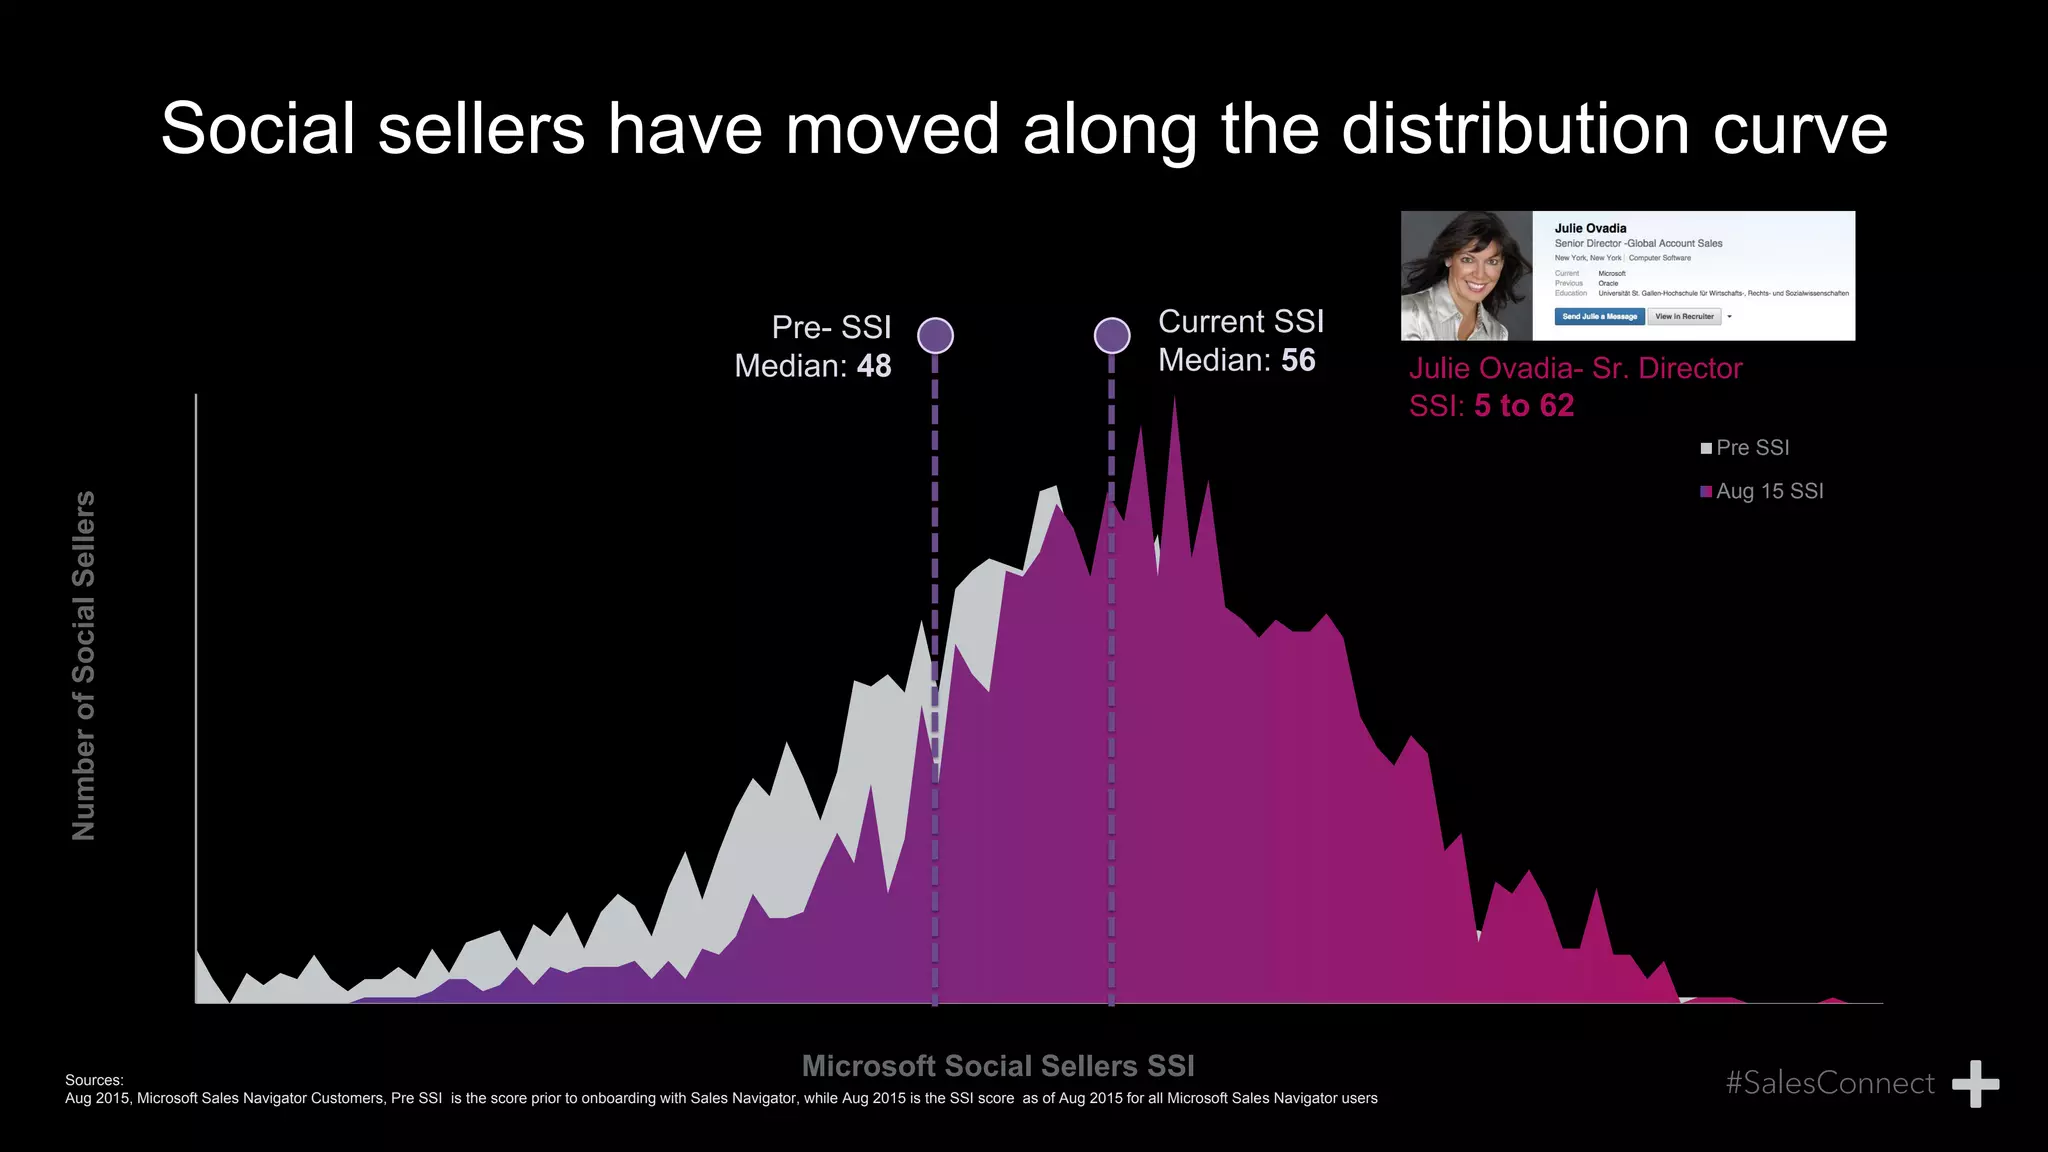
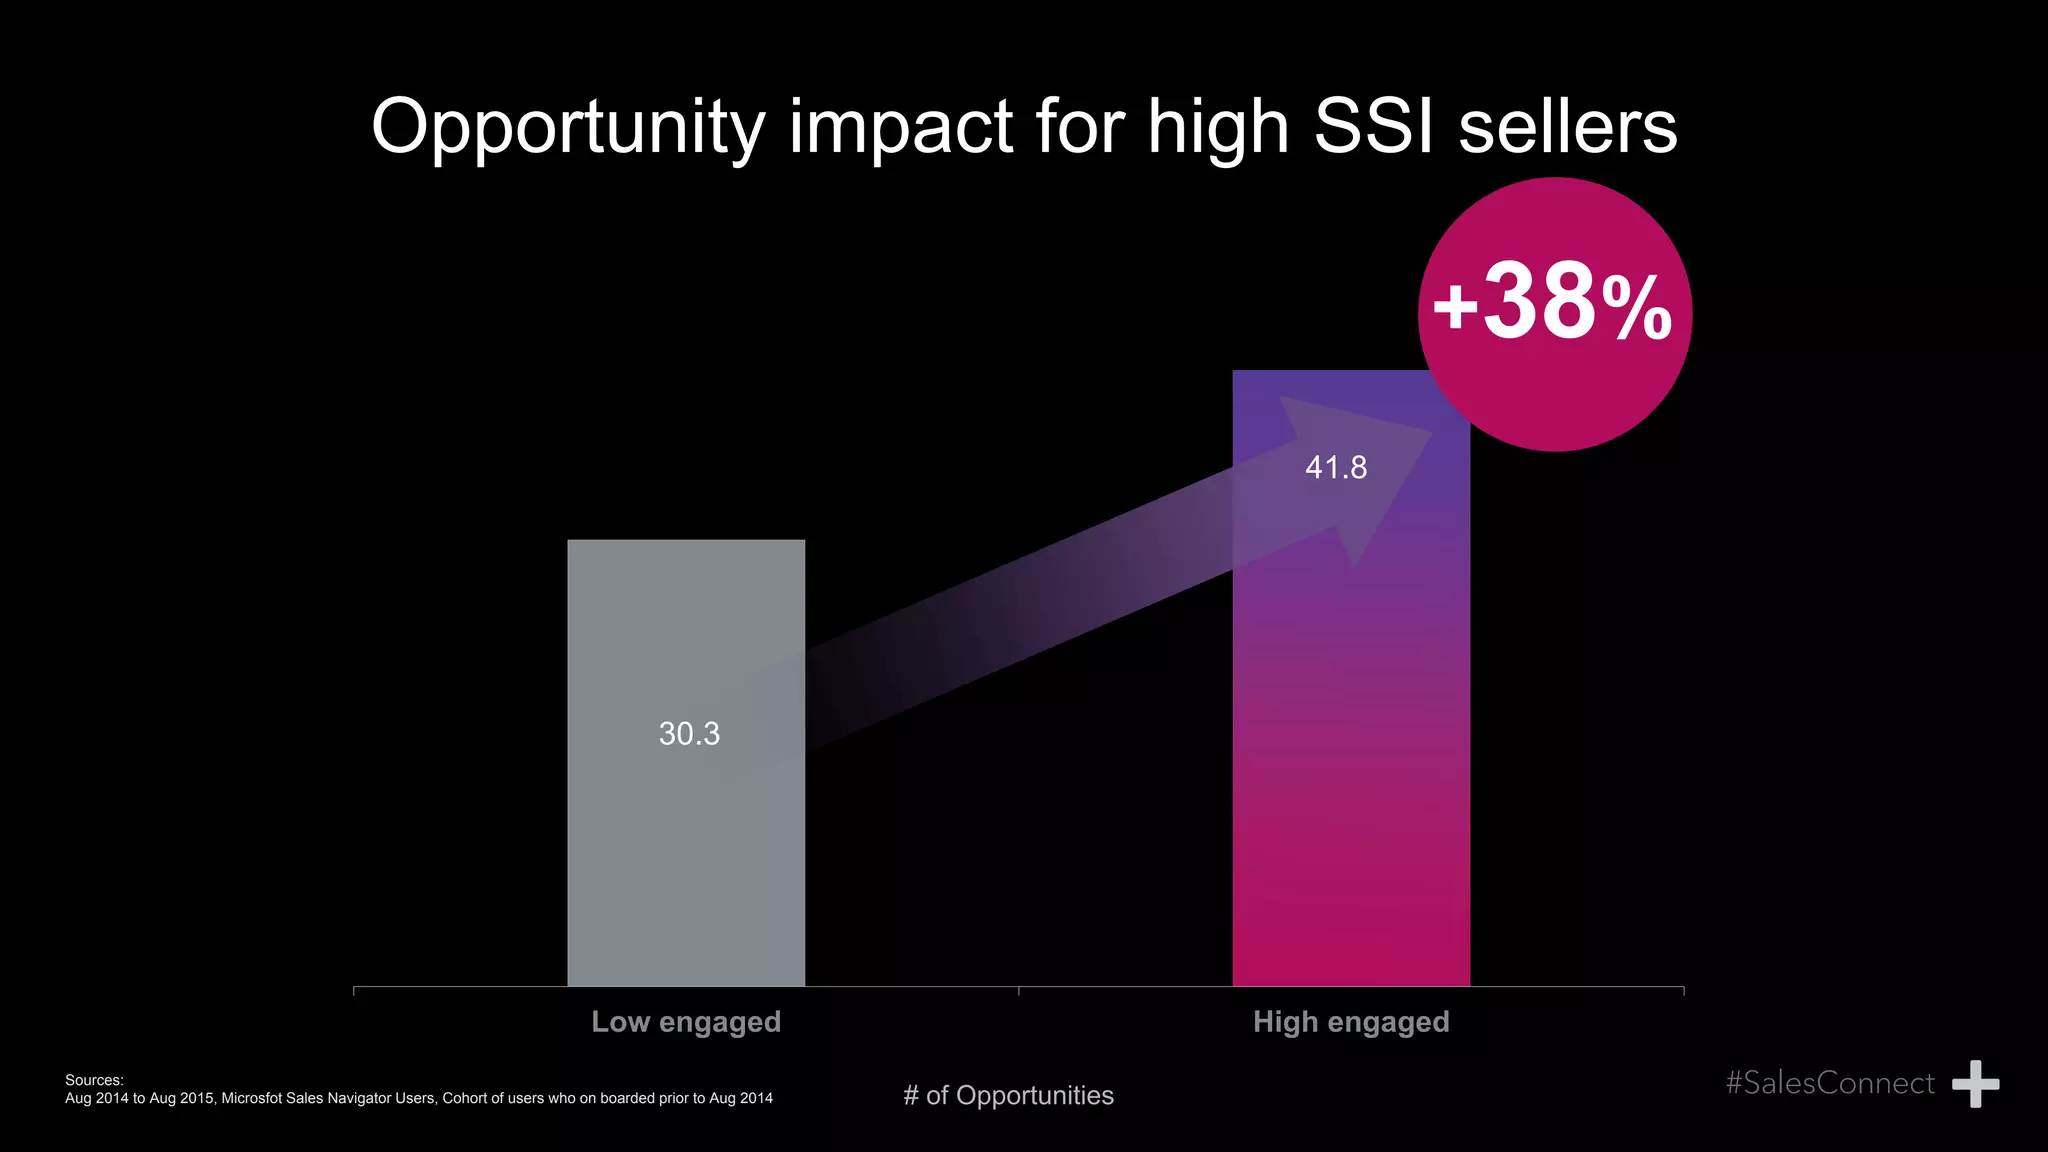
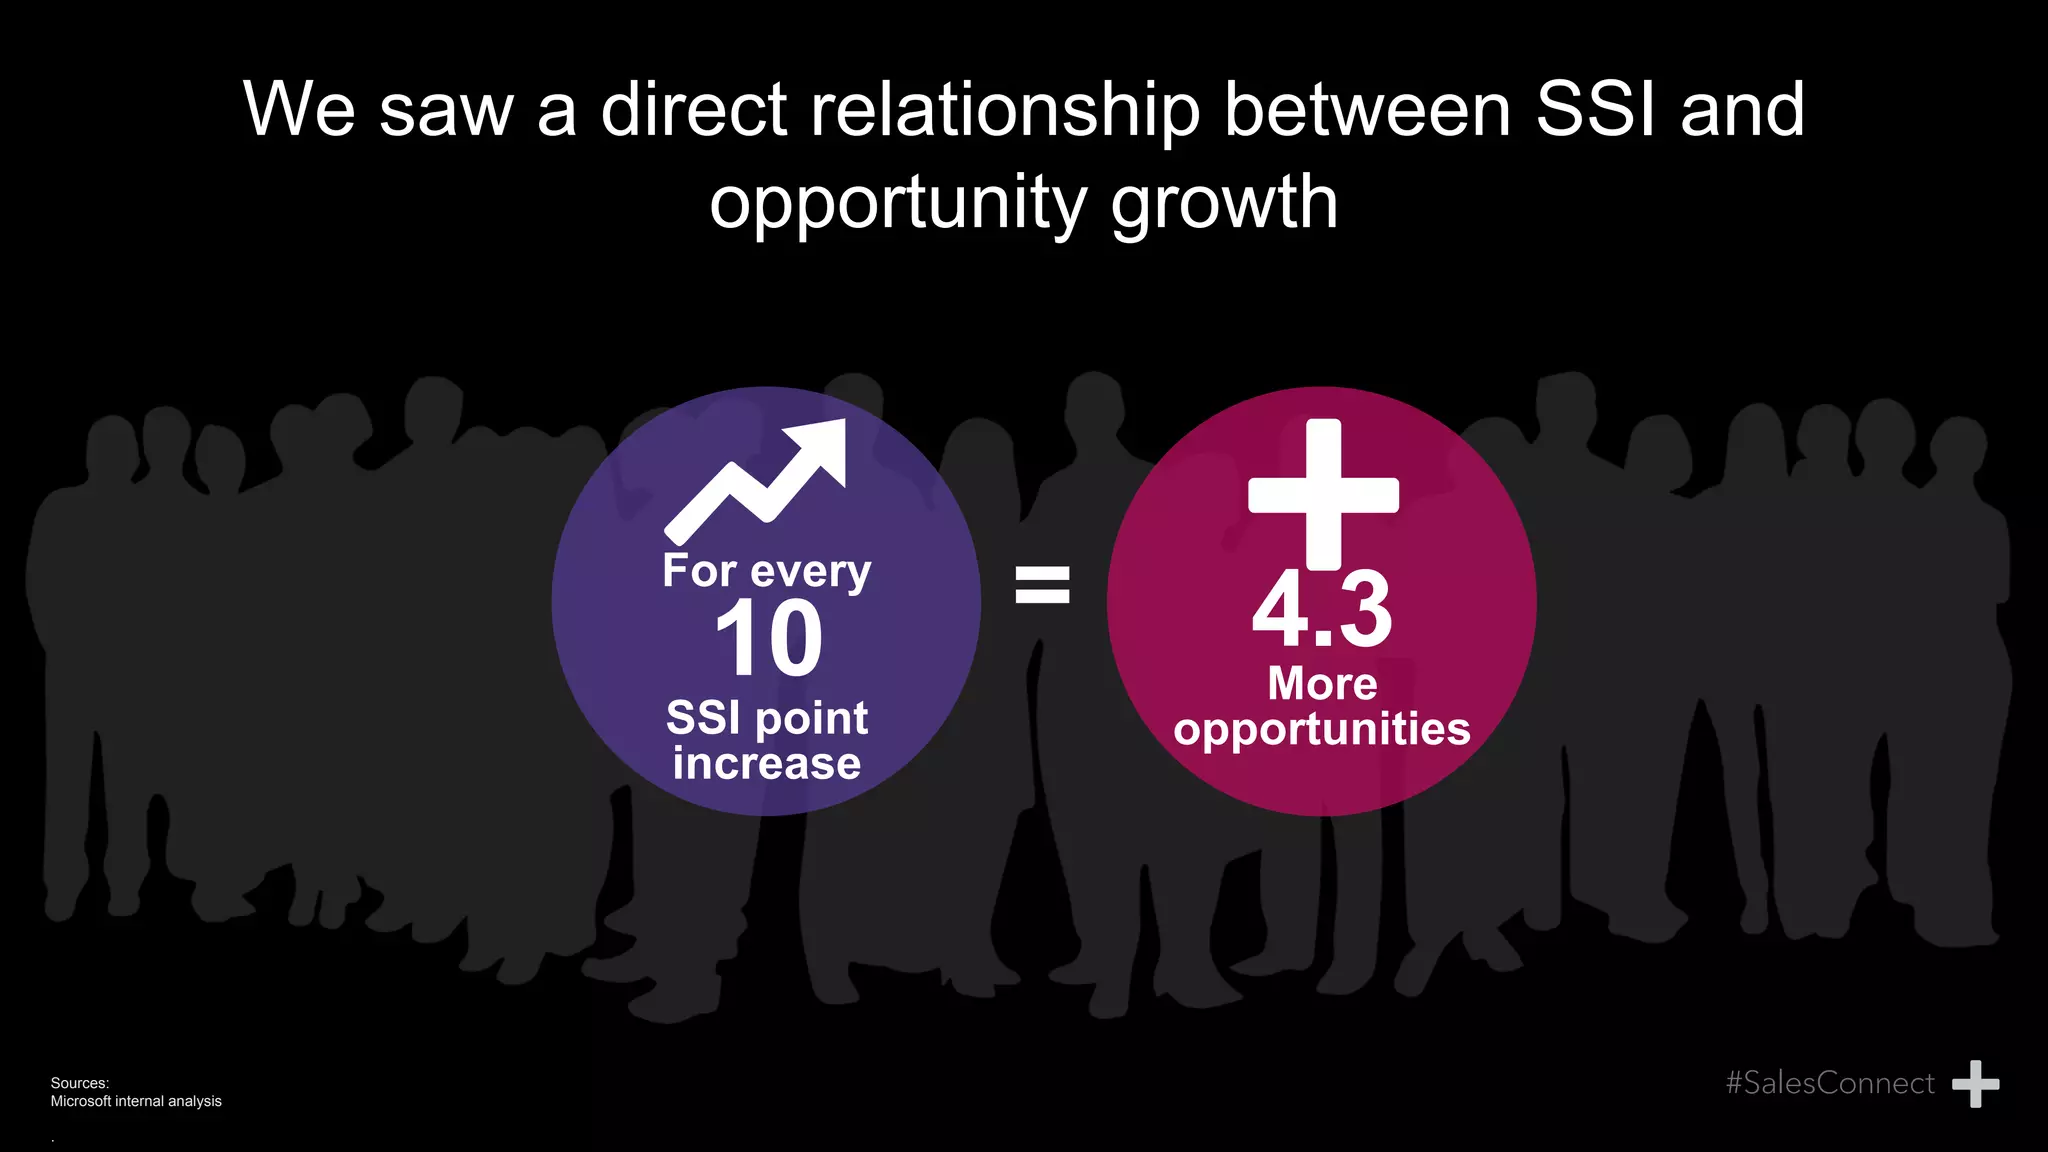
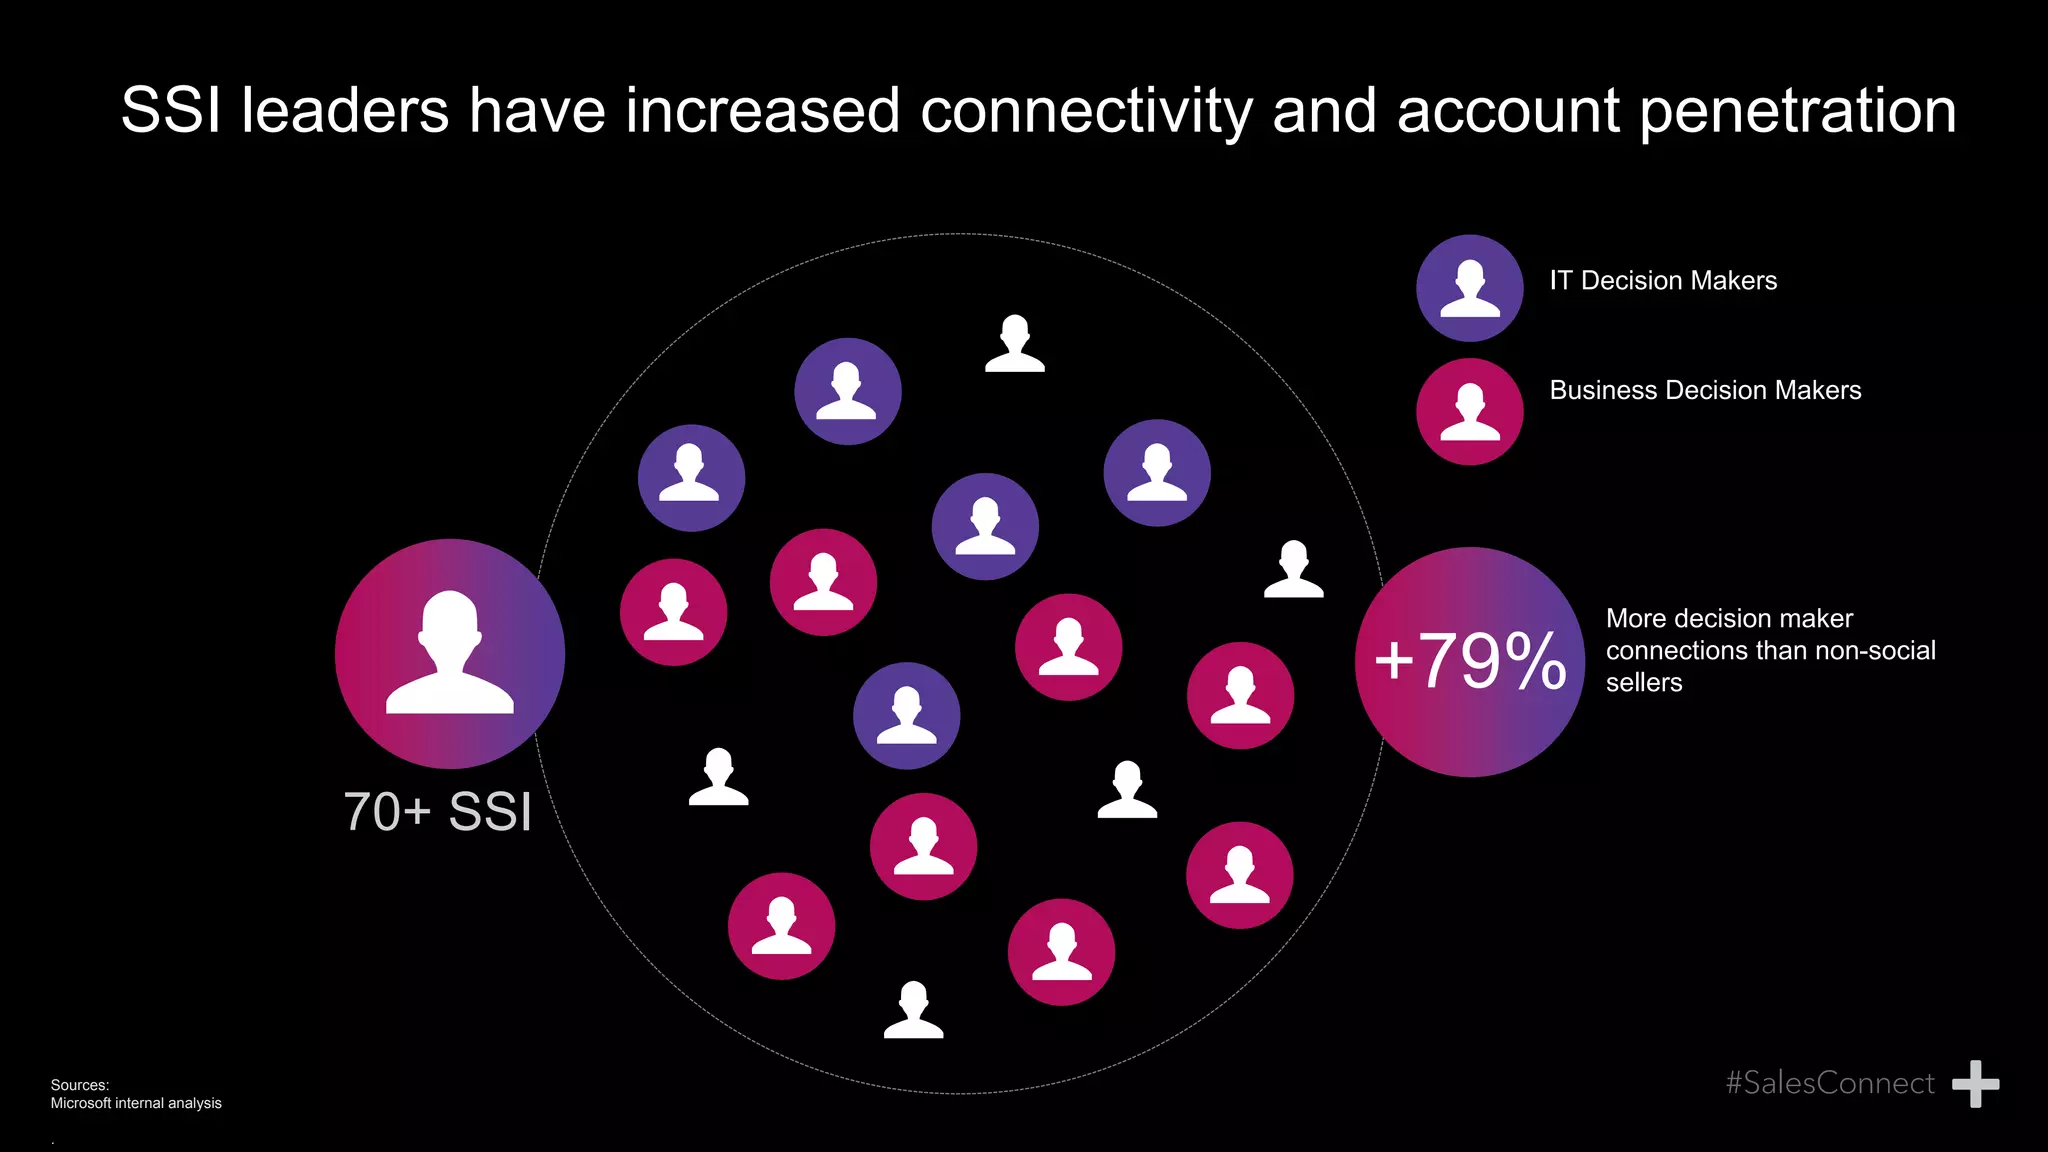
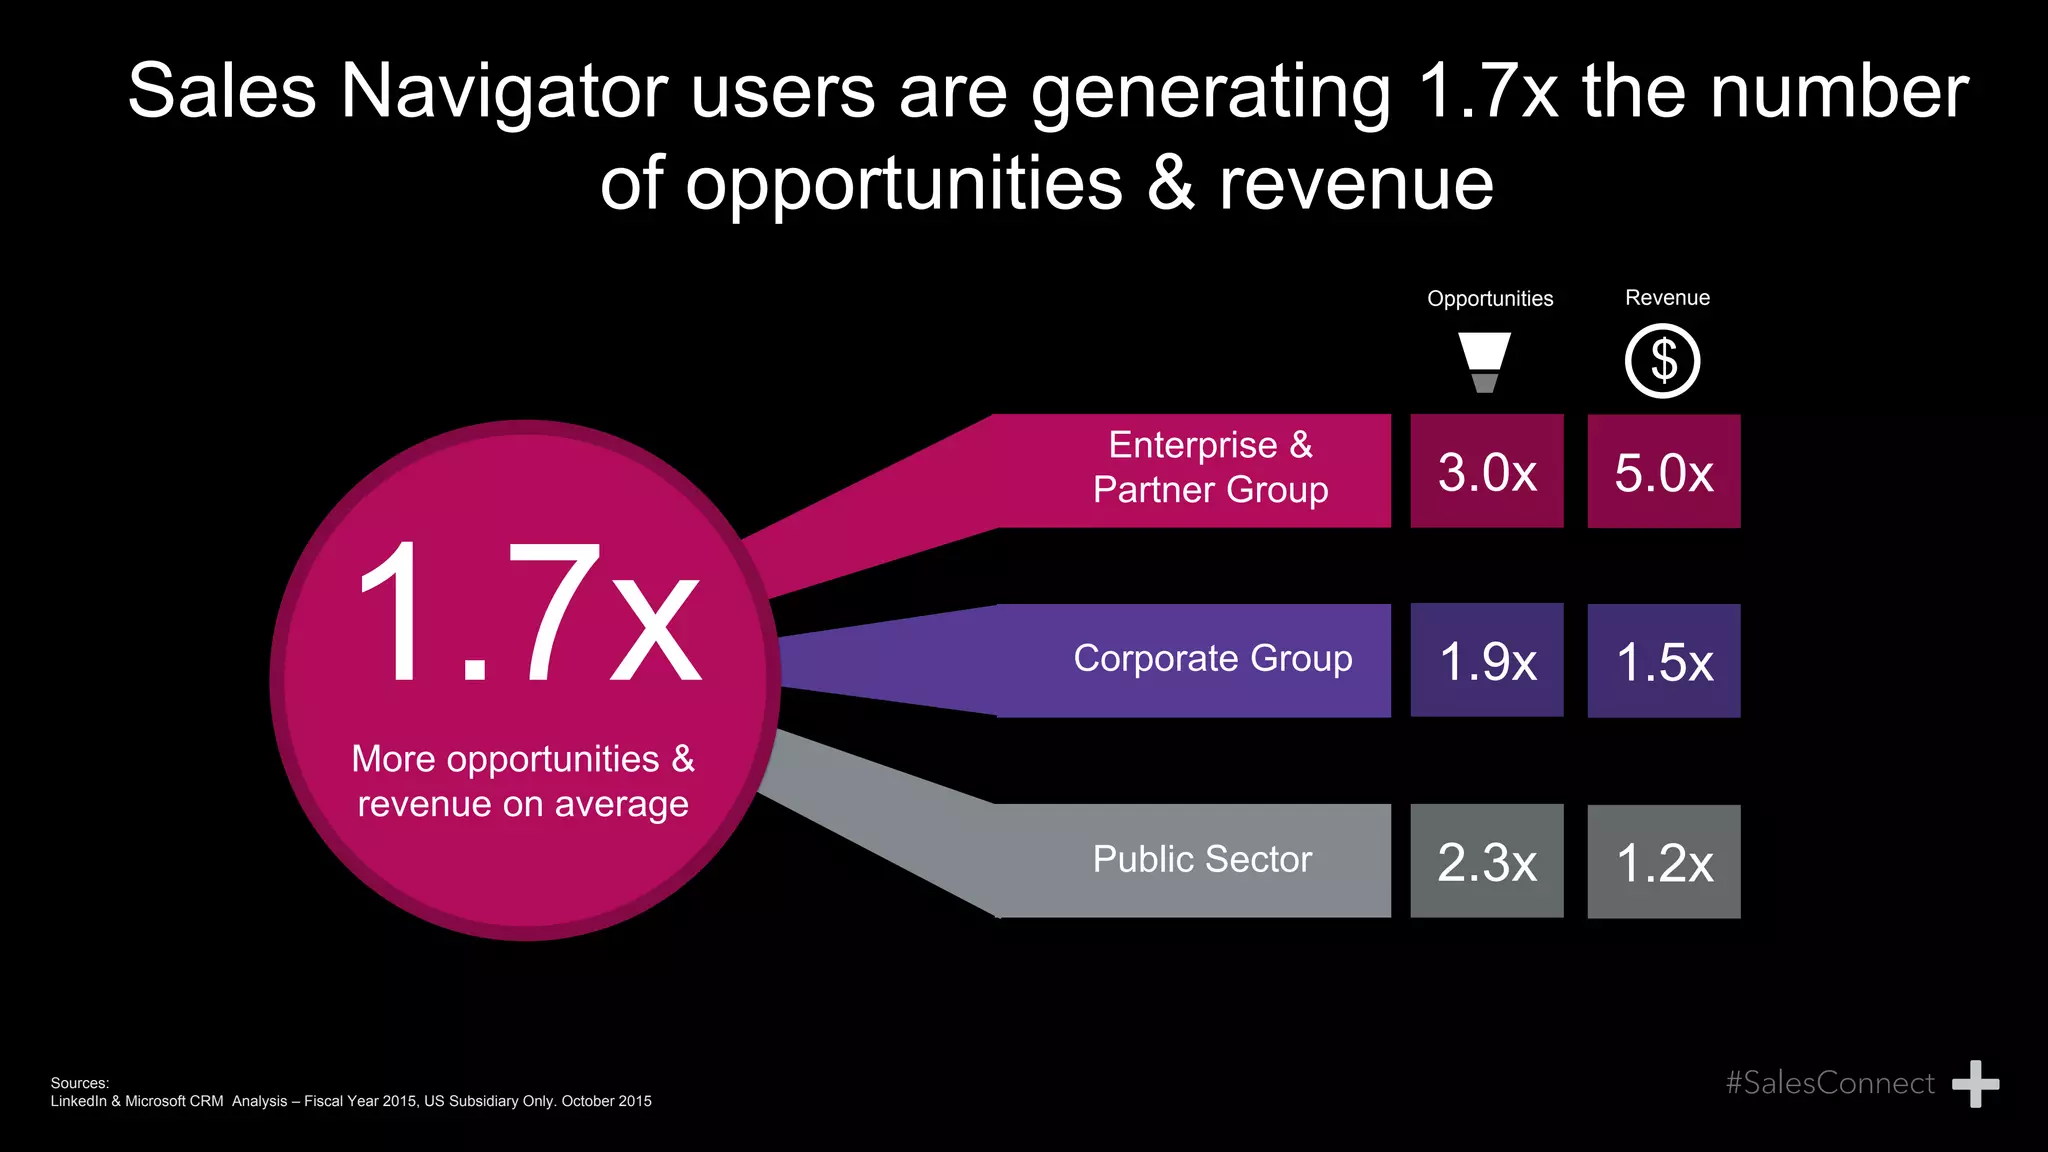
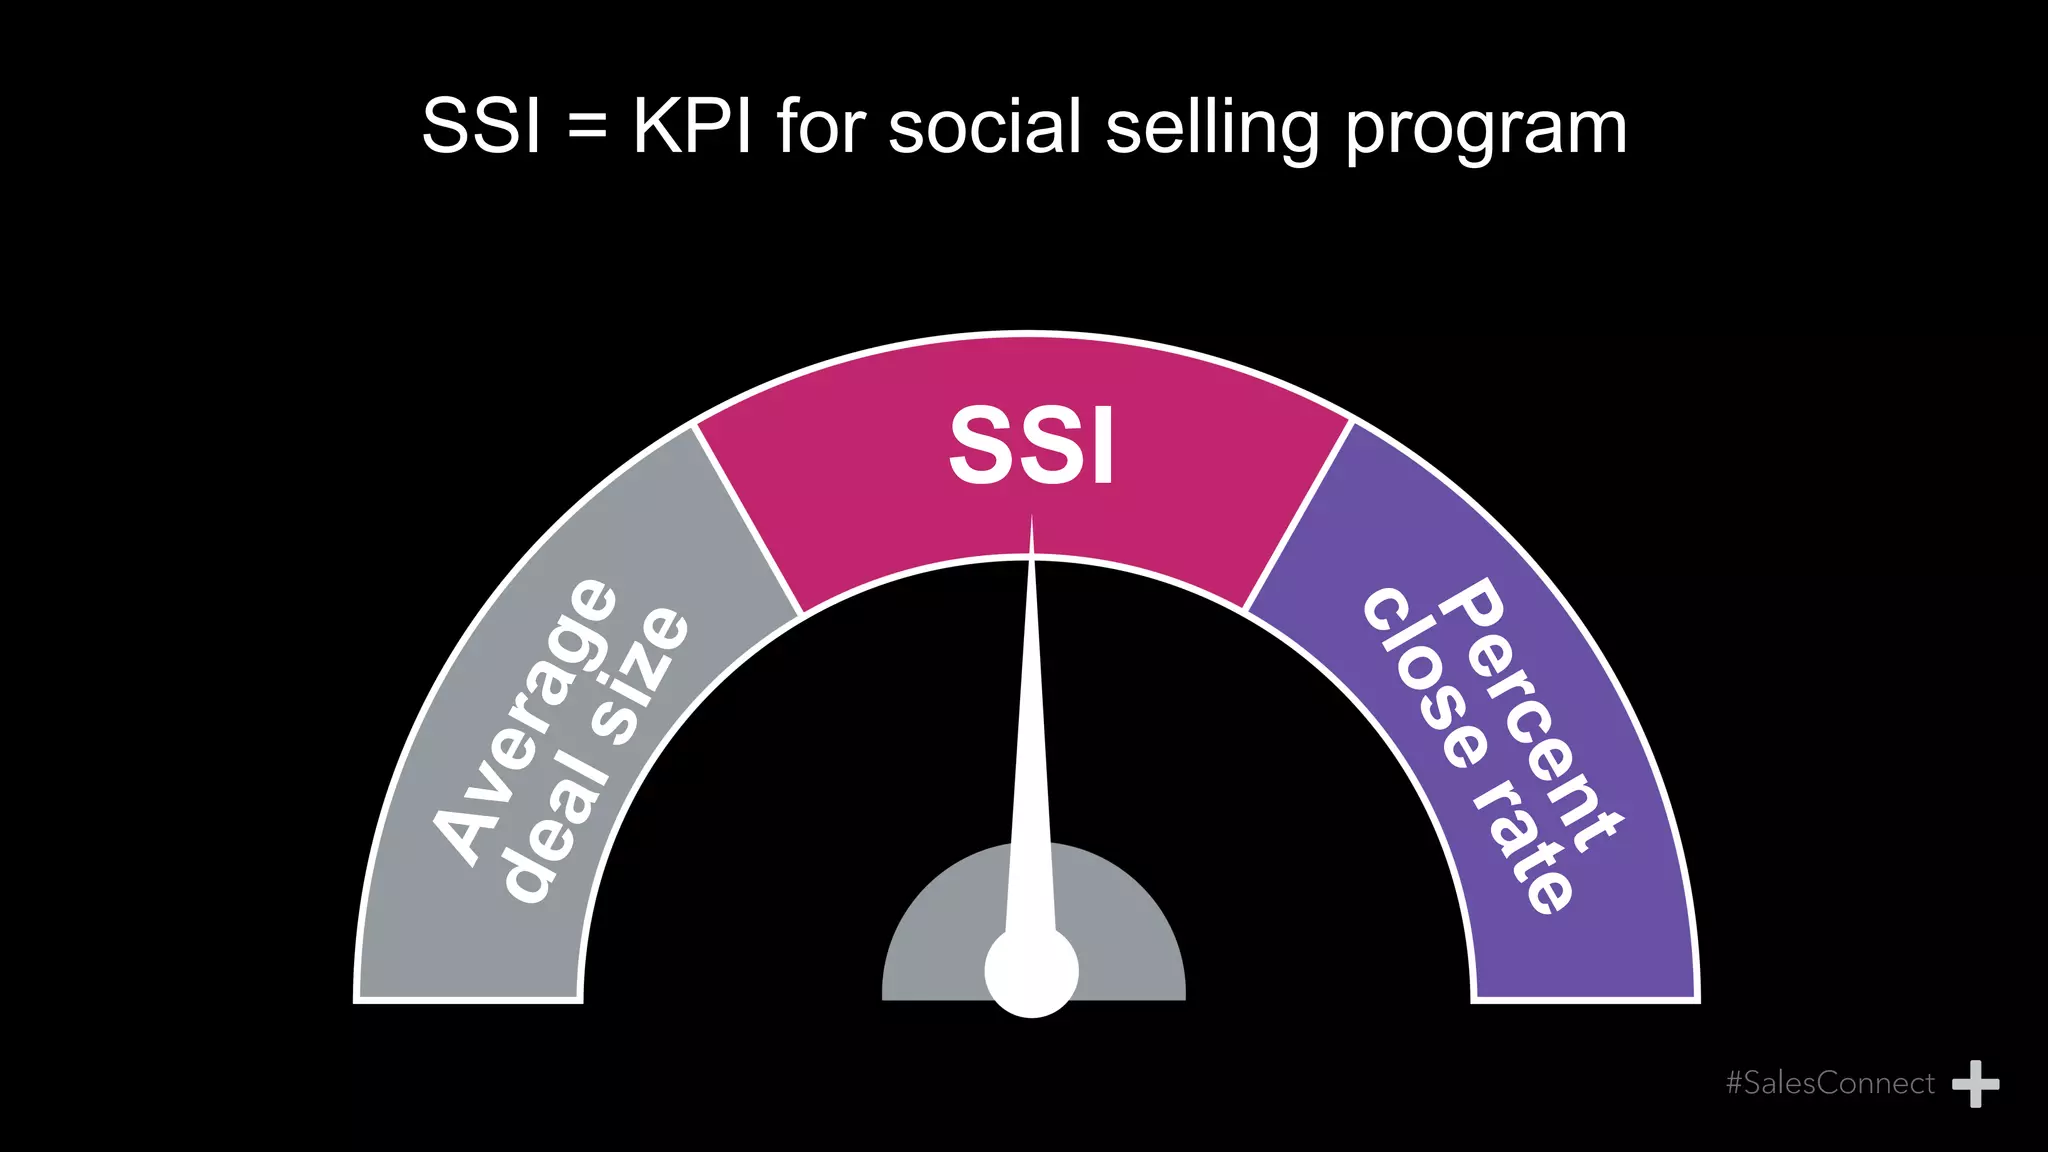
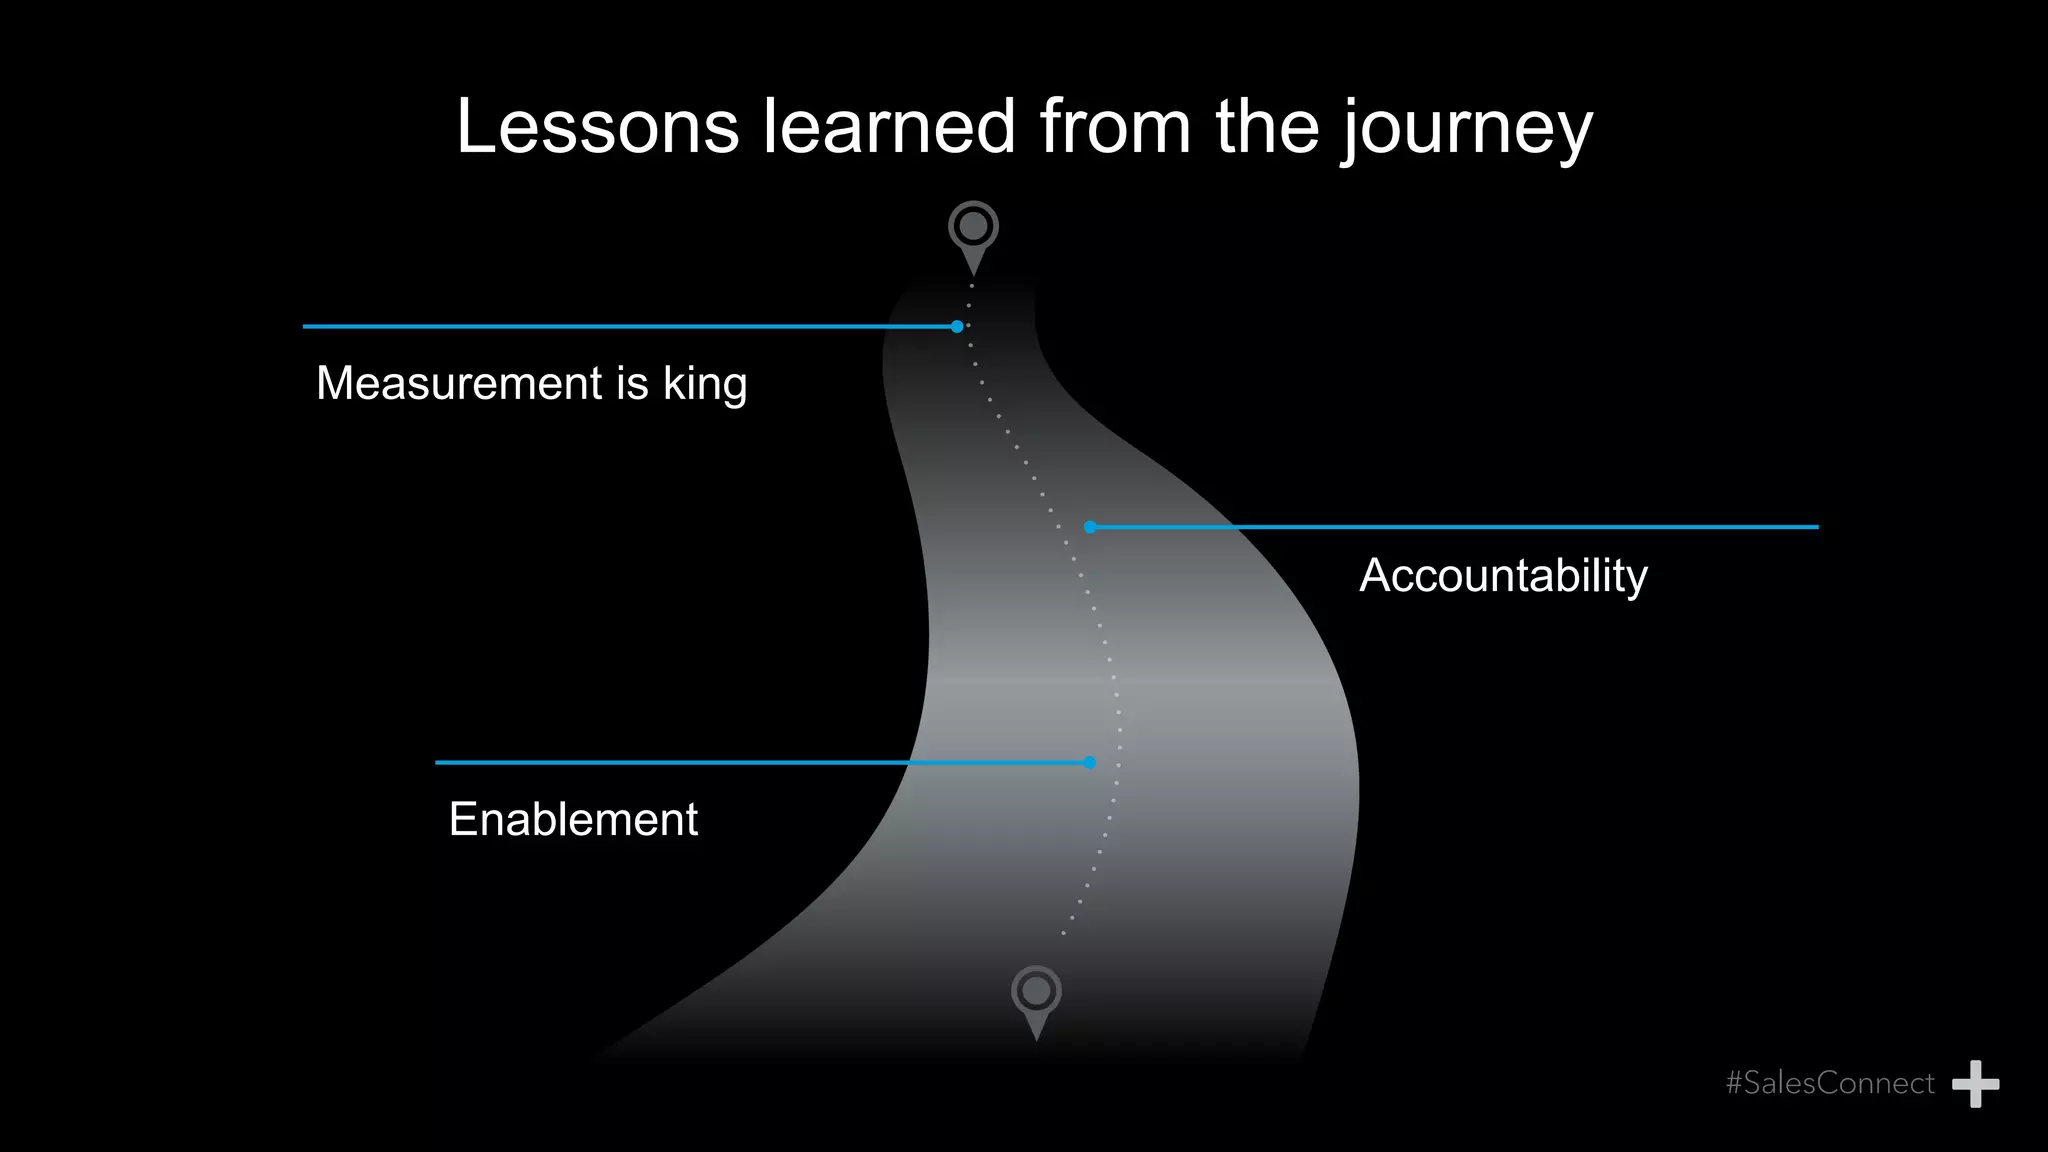
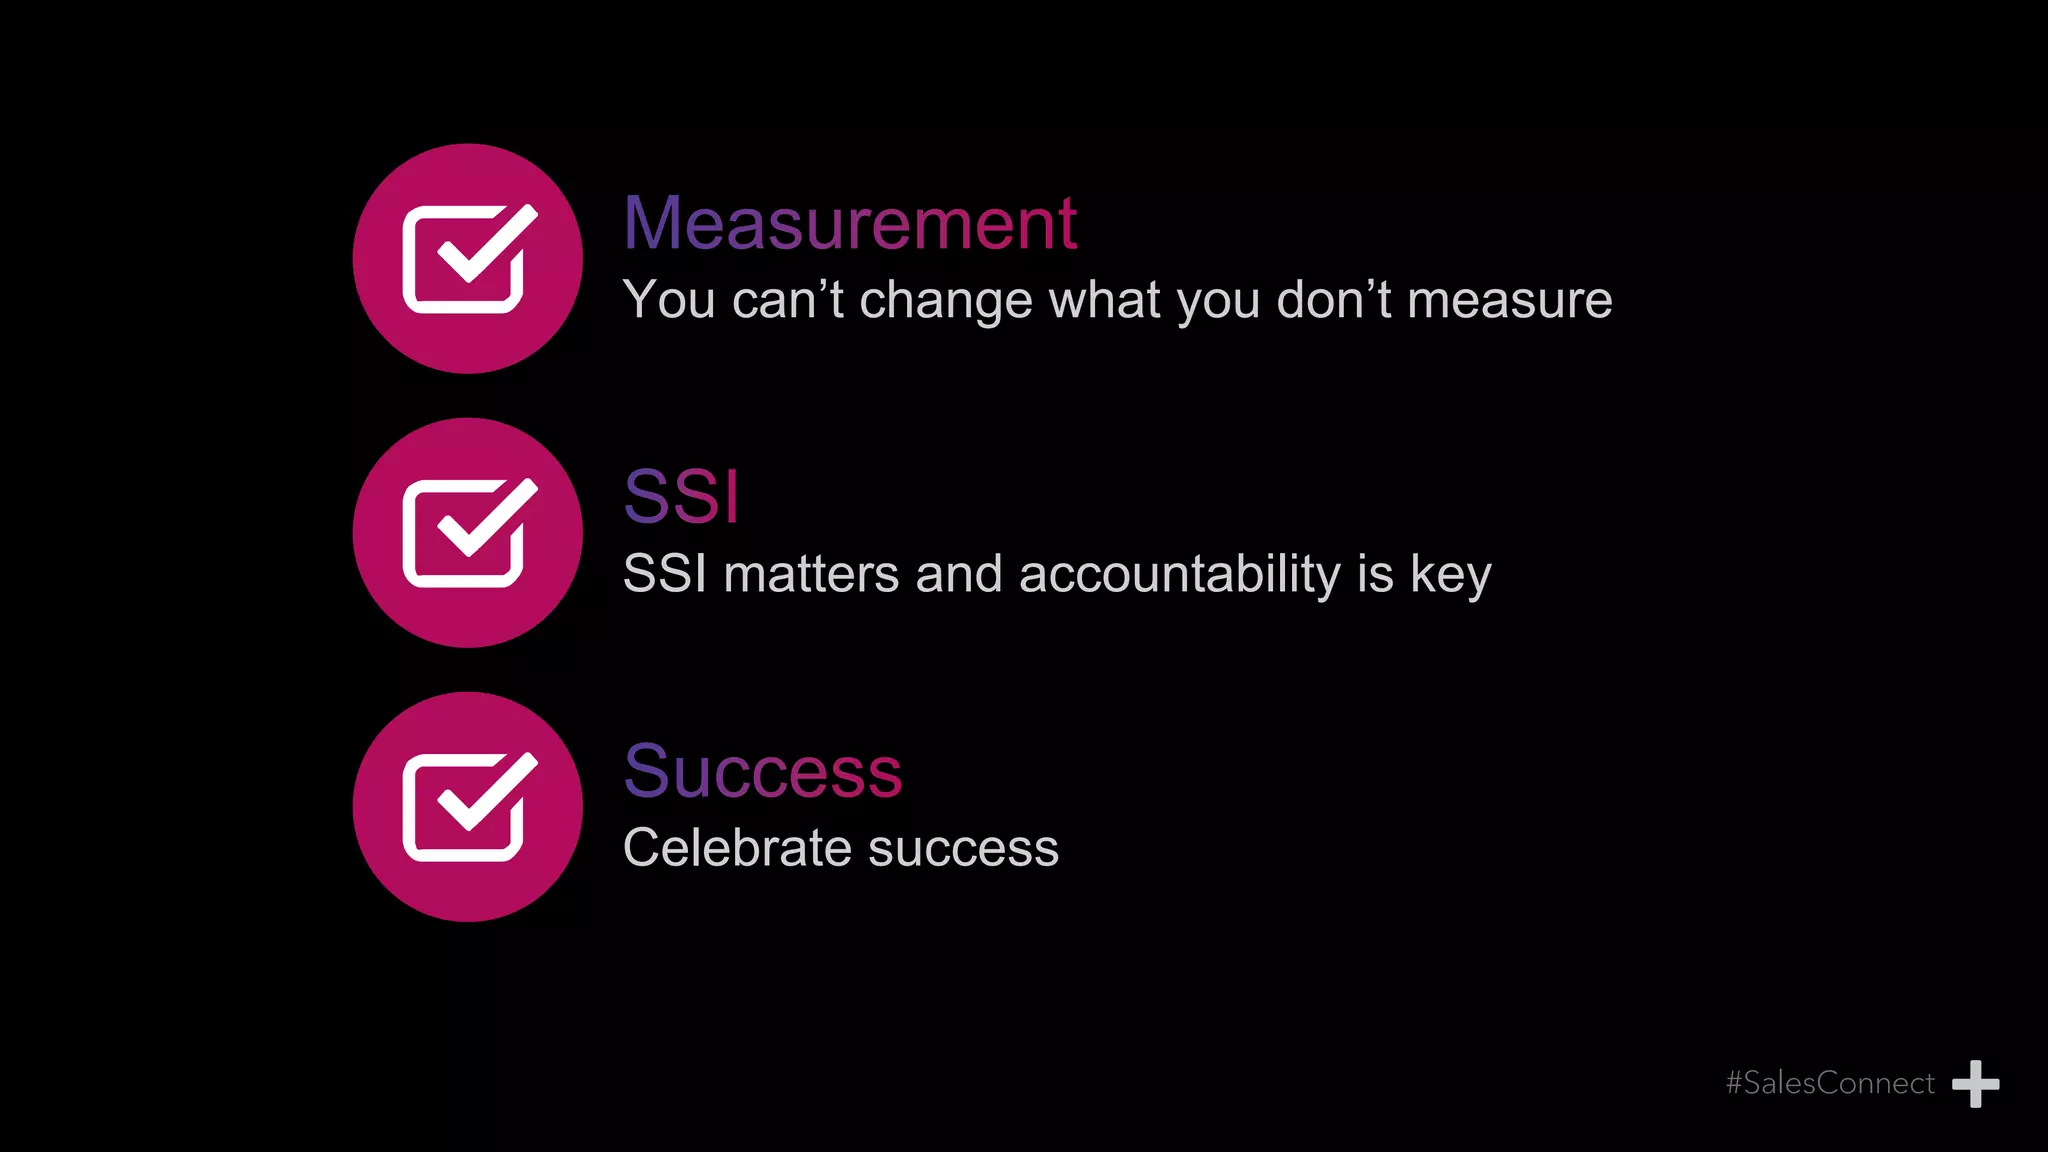

The document discusses the importance of the Social Selling Index (SSI) as a measurement tool for social selling effectiveness among sales professionals, highlighting its components such as creating a professional brand and engaging with insights. Evidence shows that those with higher SSI scores generate more opportunities and demonstrate improved engagement with decision makers, resulting in greater revenue. The document emphasizes the significance of measurement and accountability in driving social selling adoption and success, particularly within Microsoft and compared to competitors.


