Download to read offline


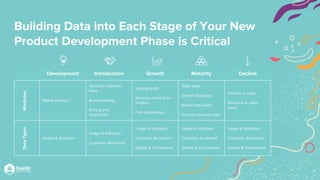


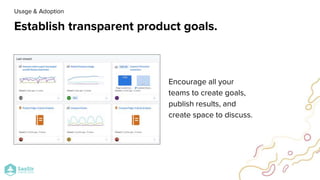
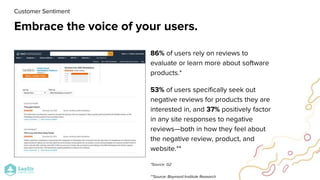


The document outlines the importance of integrating data into all stages of product development to drive growth and innovation. It emphasizes transparency in product goals and customer interactions to build loyalty and improve user sentiment. Key strategies include monitoring product data, addressing user feedback, and fostering conversations around data to enhance customer relationships.


![Three ways to harness the power of innovation p camp austin aug 2016[162070]](https://cdn.slidesharecdn.com/ss_thumbnails/threewaystoharnessthepowerofinnovation-pcampaustinaug2016162070-160815223109-thumbnail.jpg?width=640&height=640&fit=bounds)


