SlideShare a Scribd company logo
WHV in Brief
•	 Assets under management as of March 31, 2013: $14.3 billion
•	 Total staff as of March 31, 2013:  71 employees, 22 investment professionals
Market Highlights:
•	 Developed international equities, as measured by the EAFE index, posted another strong quarter, although the
strong U.S. dollar muted those returns for U.S. based investors.  In local currency terms, the EAFE returned 9.7%
but the strengthening dollar reduced that to 5.1%, significantly lagging the S&P 500’s 10.6% return.
•	 U.S. equities, particularly the smaller market cap segments, outperformed foreign equity markets, and several
indices reached new all time highs.  
•	 The strong equity market rally thus far has signaled a return to equities by investors who were encouraged by
hopes of a European recovery and the aversion of the fiscal cliff in the U.S. at the end of 2012.  However, a strong
degree of risk aversion remains, as evidenced by the leadership of the more defensive and yield oriented health
care and consumer staples sectors, which posted strong returns of 11.2% and 11.5%, respectively.
•	 Despite many concerns about austerity’s impact on what is still a fragile economic recovery, there are several
macroeconomic developments that bode well for the intermediate- and perhaps long-term. These include
continuing improvement in the housing market, the improved balance sheets and debt service ratios of
households and the U.S. energy revolution, to name a few.
Strategy Highlight:
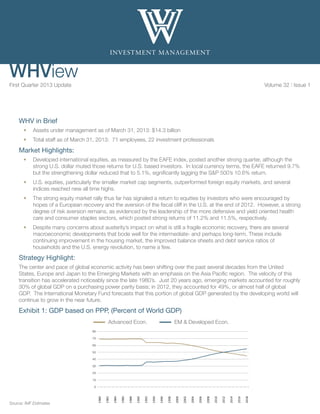
The center and pace of global economic activity has been shifting over the past several decades from the United
States, Europe and Japan to the Emerging Markets with an emphasis on the Asia Pacific region.  The velocity of this
transition has accelerated noticeably since the late 1980’s.  Just 20 years ago, emerging markets accounted for roughly
30% of global GDP on a purchasing power parity basis; in 2012, they accounted for 49%, or almost half of global
GDP.  The International Monetary Fund forecasts that this portion of global GDP generated by the developing world will
continue to grow in the near future.
Exhibit 1: GDP based on PPP, (Percent of World GDP)
  Advanced Econ.   EM & Developed Econ.
0
10
20
30
40
50
60
70
80
1980
1982
1984
1986
1988
1990
1992
1994
1996
1998
2000
2002
2004
2006
2008
2010
2012
2014
2016
2018
First Quarter 2013 Update  Volume 32 | Issue 1
Source: IMF Estimates
While GDP estimates for many developed economies have been decelerating, and 2012 growth rates for many
emerging market countries were disappointing, GDP growth for the emerging markets as a whole is expected to
continue to outpace growth in the developed countries.
Exhibit 2: Emerging Markets GDP Growth Continues to Outpace Developed Markets
  Adv. Econ.   EM  Dev. Econ.   World
-6
-4
-2
0
2
4
6
8
10
1980
1982
1984
1986
1988
1990
1992
1994
1996
1998
2000
2002
2004
2006
2008
2010
2012
2014
2016
2018
Source: IMF Estimates
However, in spite of these optimistic prospects, the recent returns of emerging market equities have not been reflective
of this continuing trend.  WHV believes an unsustainable imbalance exists which has created a compelling investment
opportunity: emerging markets account for only 14% of the world’s market capitalization of publicly traded companies.  
As urbanization and industrialization take hold in the developing world, the share of global market cap for emerging
market companies is expected to grow as well.  This will create more opportunities for investment in their capital
markets.
Companies within these countries are also becoming increasingly competitive with their developed market counterparts.  
For example, industrial production has grown faster in the emerging economies than in the developed economies for
the past decade.1
  As noted in the International Monetary Fund’s April 2013 Economic Outlook, “Emerging market
risks have declined, growth has stabilized and external funding conditions for emerging market economies are very
favorable.”
The more favorable demographic trends within the emerging markets are yet another compelling reason to invest in
these countries with their expanding populations and consumer consumption.  With increased urbanization, millions
of people around the developing world are moving to cities at an unprecedented speed and scale in search of higher
paying jobs.  The world’s middle class consumption is becoming increasingly driven by these emerging economies.  
WHV believes in investing in companies that are positioned to benefit from this growing consumer trend in the emerging
economies.
Exhibit 3: Spending by the Global Middle Class
Sub-Saharan
Africa
1%
Middle East 
North Africa
5%
North
America
26%
Europe
38%
Central 
South America
7%
Asia Pacific
23%
2009
     
Sub-Saharan
Africa
1%
Middle East 
North Africa
4%North
America
10%
Europe
20%
Central 
South America
6%
Asia Pacific
59%
2030E
Source: OECD Factbook 2011-2012
Lastly, emerging market equity valuations are indicative of an attractive investment opportunity on both an absolute and
relative basis.  Exhibit 3 shows that price-to-book and price-to-earnings valuations in emerging market economies are
currently cheaper relative to their historical averages.  While the U.S. equity markets have had a strong run during the
first quarter of 2013, investors seem to be increasingly focused on the relative attractiveness of the U.S. economy and
capital markets compared to the other developed international markets.  WHV believes that this is a short-term “sweet
spot” of earnings re-acceleration and cheaper valuations in the U.S.  Over the longer term, emerging markets will still
continue to grow at significantly faster rates than the U.S. and other developed economies.
Exhibit 5: Relative Indices Valuations
As of 3/31/2012
MSCI
Emerging
Markets
Index
MSCI
EAFE
Index
SP
500
Index
P/E Forward 12 Mo. 10.5x 12.6x 13.7x
P/B 1.4x 1.5x 2.3x
Dividend Yield 2.8% 3.2% 2.1%
3 Year EPS Growth 14.1% 22.5% 16.9%
Source: FactSet
Exhibit 4: Global Equity Valuations
–2.5
–2.0
–1.5
–1.0
–0.5
0.0
0.5
1.0
1.5
2.0
Cheaper
Richer
Maximum
Minimum
2006 2007 2008 2009 2010 2011 2012
(In z-scores)
10th–90th Percentile Advanced Economies Emerging Market Economies
Sources: IMF Financial Stability Report (Bloomberg L.P.; IBES; and IMF staff
estimates.)
Note: Based on GDP-weighted average of z-scores of price-to-book (P/B)
and forward price-to-earnings (P/E) ratios. The z-scores represent the
deviation from the period average expressed in the number of standard
deviations. Values above zero denote richer valuations relative to historical
averages, while those below zero denote cheaper valuations. P/B and P/E
ratios are monthly series beginning in 1996 and 1987, respectively, or earliest
available. Advanced economies include 22 countries, and emerging market
economies include 17 countries.
WHV believes institutional investors can take advantage of this investment opportunity by having exposure to a well
diversified emerging markets equity strategy in their portfolio. A strategy that allows for diverse exposure across different
countries, sectors and market-capitalizations is a sensible way to implement broad exposure to the emerging markets
asset class.
WHV does not guarantee the future performance of any client’s account or any specific level of performance, the success of any investment decision or
strategy that we may use, or the success of our overall management of any account. Certain statements contained in this commentary are forward-looking,
including those that discuss strategies, goals, outlook or other non-historical matters; or project revenues, income, returns or other financial measures. These
forward-looking statements are made only as of the date on which they are made, and WHV undertakes no obligation to update or revise any forward-looking
statements.
1
FactSet Economic Data
901 5th Avenue, Suite 3130
Seattle, WA 98164-2008
Tel: (800) 258-1388
Fax: (206) 219-2479
301 Battery Street, Suite 400
San Francisco, CA 94111-3203
Tel: (800) 204-2650
Fax: (415) 288-6153
whv.com
WHV Performance Highlights1
Annualized
1Q13 1 Yr. 3 Yrs. 5 Yrs. 10 Yrs.
International Equity
Gross of Fees 4.01% 8.65% 5.39% 0.34% 15.81%
Net of Fees 3.80% 7.78% 4.43% -0.62% 14.69%
MSCI EAFE 5.13% 11.25% 5.00% -0.89% 9.69%
Global Equity
Gross of Fees 4.36% 9.27% 5.26% 0.88% n/a
Net of Fees 4.17% 8.43% 4.31% -0.07% n/a
MSCI World 7.73% 11.85% 8.46% 2.23% n/a
Small Cap Equity
Gross of Fees 11.76% 11.32% 11.50% 6.92% 13.85%
Net of Fees 11.59% 10.63% 10.57% 5.95% 12.78%
Russell 2000 12.39% 16.30% 13.45% 8.24% 11.52%
Micro Cap Equity
Gross of Fees 9.04% -2.46% 10.58% n/a n/a
Net of Fees 8.78% -3.44% 9.48% n/a n/a
Dow Jones Micro 15.03% 7.40% 12.92% n/a n/a
Emerging Markets
Gross of Fees -1.39% -1.28% 3.82% n/a n/a
Net of Fees -1.64% -2.26% 2.79% n/a n/a
MSCI Emerging -1.62% 1.96% 3.27% n/a n/a
Select World Equity
Gross of Fees 8.43% 9.33% 9.43% 5.42% n/a
Net of Fees 8.17% 8.25% 8.35% 4.38% n/a
MSCI All Country World ex 6.50% 10.55% 10.79% 5.30% n/a
International Small Cap
Gross of Fees 11.44% 9.40% n/a n/a n/a
Net of Fees 11.17% 8.32% n/a n/a n/a
MSCI All Country World ex 6.54% 10.48% n/a n/a n/a
Large Cap Core
Gross of Fees 8.26% 8.93% 10.51% 6.16% 8.60%
Net of Fees 8.15% 8.49% 9.81% 5.42% 7.79%
SP 500 10.61% 13.96% 12.67% 5.81% 8.53%
1
This information is supplemental to the GIPS-compliant presentations, which are attached.
International Equity Composite
Definition of the Firm
WHV is an investment adviser, registered under the
Investment Advisers Act of 1940. WHV manages a
variety of equity and balanced portfolios working from
offices in San Francisco and Seattle. WHV is “the firm”
for purposes of determining the Total Firm Assets under
management and firm-wide compliance. Registration with
the SEC does not imply a certain level of skill or training.
Year Ended
Total Return
(%)
Gross of
Fees
Total Return
(%)
Net of Fees
Benchmark
Returns
(%)
Composite
Dispersion
(%)
Ex-Post Standard
Deviation (%) Number of
Portfolios
at End of
Period
Total Assets
at End of
Period
($ millions)
Non-Fee-
Paying
Portfolios
(% of
Composite
Assets)
Total Firm
Assets
($ millions)Composite Benchmark
Y 12/31/12 15.24 14.32 17.32 1.34 22.54 19.37 413 4,091.4 0.01 13,404
Y 12/31/11 -14.82 -15.68 -12.14 1.63 25.98 22.43 446 4,006.5 n/a 13,250
Y 12/31/10 18.62 17.46 7.75 1.82 n/a n/a 404 4,335.0 n/a 15,213
Y 12/31/09 62.10 60.55 31.78 5.19 n/a n/a 415 3,371.7 n/a 12,646
Y 12/31/08 -49.17 -49.71 -43.38 2.43 n/a n/a 456 2,252.5 n/a 8,376
Y 12/31/07 44.35 42.95 11.17 3.82 n/a n/a 414 4,040.1 n/a 14,400
Y 12/31/06 23.73 22.51 26.34 4.41 n/a n/a 310 2,000.4 n/a 9,013
Y 12/31/05 40.92 39.56 13.54 4.77 n/a n/a 148 830.5 n/a 6,630
Y 12/31/04 30.20 28.93 20.25 3.19 n/a n/a 54 292.9 n/a 5,700
Y 12/31/03 29.26 28.00 38.59 6.59 n/a n/a 40 177.6 n/a 5,424
WHV Investment Management
Compliance Statement
WHV Investment Management (WHV) claims compliance
with the Global Investment Performance Standards
(GIPS®) and has prepared and presented this report in
compliance with the GIPS standards. WHV has been
independently verified for the periods from October 1,
1994 through December 31, 2011.
Verification assesses whether (1) the firm has complied
with all the composite construction requirements of
the GIPS standards on a firm-wide basis and (2) the
firm’s policies and procedures are designed to calculate
and present performance in compliance with the GIPS
standards. The International Equity composite has been
examined for the periods from January 1, 1995 through
December 31, 2011. The verification and performance
examination reports are available upon request.
Polices
WHV’s policies for valuing portfolios, calculating
performance, and preparing compliant presentations are
available upon request.
Composite Description
The composite was created on October 31, 2004. The
composite includes all non-wrap accounts, excluding
mutual funds, invested in the firm’s International Equity
strategy, a portfolio of international equity growth
stocks that is expected to generate long-term capital
appreciation. A list of composite descriptions is available
upon request.
Since August 2008, WHV has used the services of its
affiliated sub-advisor Hirayama Investments, LLC in the
management of this strategy.
Minimum Account Size
Currently there is no minimum asset level for inclusion in
the composite. Prior to January 1, 2012, the minimum
asset level for inclusion was $100,000. Prior to January 1,
2010, the minimum asset level for inclusion was $50,000.
Benchmark
The benchmark for the International Equity composite
is the MSCI-EAFE (Net) Index, which measures the
equity performance of developed markets in Europe,
Australia and the Far East. Previously, the benchmark
presented was the MSCI-EAFE (Gross) Index. In June
2011, the benchmark was changed for all periods
since the composite’s inception to better reflect how
composite returns are calculated. The returns of the
benchmark are provided to represent the investment
environment that existed during the time period shown
and are not covered by the report of the independent
verifiers. For comparison purposes, the index includes
the reinvestment of income and other earnings but does
not include any trading expenses, management fees or
other costs. The volatility of the composite and that of
the benchmark may be materially different due to varying
degrees of diversification and/or other factors.
A large percentage of the equity assets in the composite
is invested in countries or regions not included in the
benchmark.
Dispersion
Composite dispersion is measured by the standard
deviation across returns of portfolios represented within
the composite for the full period. Standard deviation
is calculated on asset-weighted portfolio returns.
Composite dispersion is not presented for quarterly
periods or for years where the composite consisted of
five or fewer accounts as it is not considered statistically
meaningful. Ex-post standard deviation is the annualized
standard deviation of monthly returns for the trailing 36
months of both the composite and benchmark.
Returns and Fees
Returns reflect the deduction of all trading expenses
and the reinvestment of dividends and other earnings.
Gross returns do not reflect the deduction of investment
advisory fees or any other expenses that may be incurred
in the management of the account. Net returns are
net of model investment advisory fees in effect for the
respective time period. Actual fees may vary depending
on, among other things, the applicable fee schedule and
portfolio size. Further, the impact of management fees
over time may be different from the actual management
fees used in the calculation during periods of significant
volatility. WHV’s investment advisory fees are described
in Form ADV Part II. Valuations and returns are computed
and stated in U.S. dollars. Past performance is not a
guarantee of future results.
The Management Fee Schedule is as follows:
Incremental Annual Fee Rate as a Percentage of Market
Value
First $10 million @ 1.00% | Next $15 million @ 0.80% |
Next $25 million @ 0.75% | Next $50 million @ 0.60% |
All over $100 million @ 0.50%
901 5th Avenue, Suite 3130
Seattle, WA 98164-2008
Tel: (800) 258-1388
Fax: (206) 219-2479
301 Battery Street, Suite 400
San Francisco, CA 94111-3203
Tel: (800) 204-2650
Fax: (415) 288-6153
whv.com
Global Equity Composite
WHV Investment Management
Definition of the Firm
WHV	is	an	investment	adviser,	registered	under	the	
Investment	Advisers	Act	of	1940.	WHV	manages	a	variety	of	
equity	and	balanced	portfolios	working	from	offices	in	San	
Francisco	and	Seattle.			WHV	is	“the	firm”	for	purposes	of	
determining	the	Total	Firm	Assets	under	management	and	
firm-wide	compliance.	Registration	with	the	SEC	does	not	
imply	a	certain	level	of	skill	or	training.	
Year Ended
Total Return
(%)
Gross of
Fees
Total Return
(%)
Net of Fees
Benchmark
Returns
(%)
Composite
Dispersion
(%)
Ex-Post Standard Deviation
(%)
Number of
Portfolios at
End of Period
Total Assets
at End of
Period
($ millions)
Total Firm
Assets
($ millions)Composite Benchmark
Y 12/31/12 14.92 14.03 15.83 1.21 22.68 16.74 80 578.6 13,404
Y 12/31/11 -15.22 -16.08 -5.54 1.45 25.93 20.15 102 553.2 13,250
Y 12/31/10 17.96 16.80 11.76 2.12 n/a n/a 91 372.9 15,213
Y 12/31/09 62.92 61.36 29.99 5.69 n/a n/a 80 296.2 12,646
Y 12/31/08 -48.26 -48.80 -40.71 2.17 n/a n/a 67 124.1 8,376
Y 12/31/07 44.94 43.54 9.04 n/m n/a n/a 23 128.7 14,400
Y 12/31/06 23.28 22.07 20.07 n/m n/a n/a 3 40.2 9,013
Y 12/31/05^ 9.63 9.45 5.62 n/m n/a n/a 1 27.9 6,630
^	 Returns	are	for	the	period	from	11/01/2005	through	12/31/2005
Compliance Statement
WHV	Investment	Management	(WHV)	claims	compliance	
with	the	Global	Investment	Performance	Standards	(GIPS®)	
and	has	prepared	and	presented	this	report	in	compliance	
with	the	GIPS	standards.	WHV	has	been	independently	
verified	for	the	periods	from	October	1,	1994	through	
December	31,	2011.
Verification	assesses	whether	(1)	the	firm	has	complied	with	
all	the	composite	construction	requirements	of	the	GIPS	
standards	on	a	firm-wide	basis	and	(2)	the	firm’s	policies	
and	procedures	are	designed	to	calculate	and	present	
performance	in	compliance	with	the	GIPS	standards.	The	
Global	Equity	composite	has	been	examined	for	the	periods	
from	November	1,	2005	through	December	31,	2011.	
The	verification	and	performance	examination	reports	are	
available	upon	request.
Polices
WHV’s	policies	for	valuing	portfolios,	calculating	
performance,	and	preparing	compliant	presentations	are	
available	upon	request.
Composite Description
The	composite	was	created	on	October	31,	2005.		The	
composite	includes	all	non-wrap	accounts	invested	in	the	
firm’s	Global	Equity	strategy,	a	portfolio	of	international	
and	U.S.	companies	that	are	industry	leaders	in	the	global	
marketplace.	The	strategy	seeks	to	identify	stocks	of	
companies	that	are	poised	for	long-term	growth	and	have	
the	potential	to	sustain	a	high	growth	rate	in	regions	and	
countries	around	the	world.	A	list	of	composite	descriptions	
is	available	upon	request.
Since	August	2008,	WHV	has	used	the	services	of	its	
affiliated	sub-advisor	Hirayama	Investments,	LLC	in	the	
management	of	this	strategy.
Minimum Account Size
Currently	there	is	no	minimum	asset	level	for	inclusion	in	the	
composite.		Prior	to	January	1,	2012,	the	minimum	asset	
level	for	inclusion	was	$100,000.		Prior	to	January	1,	2010,	
the	minimum	asset	level	for	inclusion	was	$50,000.
Benchmark
The	benchmark	for	the	Global	Equity	composite	is	the	
MSCI	World	(Net)	Index	which	measures	the	equity	market	
performance	of	24	developed	countries.		Previously,	
the	benchmark	presented	was	the	MSCI	World	(Gross)	
Index.		In	June	2011,	the	benchmark	was	changed	for	all	
periods	since	the	composite’s	inception	to	better	reflect	
how	composite	returns	are	calculated.		The	returns	of	
the	benchmark	are	provided	to	represent	the	investment	
environment	that	existed	during	the	time	period	shown	
and	are	not	covered	by	the	report	of	the	independent	
verifiers.		For	comparison	purposes,	the	index	includes	
the	reinvestment	of	income	and	other	earnings	but	does	
not	include	any	trading	expenses,	management	fees	or	
other	costs.		The	volatility	of	the	composite	and	that	of	
the	benchmark	may	be	materially	different	due	to	varying	
degrees	of	diversification	and/or	other	factors.
A	large	percentage	of	the	equity	assets	in	the	composite	
is	invested	in	countries	or	regions	not	included	in	the	
benchmark.
Dispersion
Composite	dispersion	is	measured	by	the	standard	
deviation	across	returns	of	all	portfolios	represented	within	
the	composite	for	the	full	period.	Standard	deviation	is	
calculated	on	asset-weighted	portfolio	returns.		Composite	
dispersion	is	not	presented	for	quarterly	periods	or	for	years	
where	the	composite	consists	of	five	or	fewer	accounts	as	it	
is	not	considered	statistically	meaningful.		Ex-post	standard	
deviation	is	the	annualized	standard	deviation	of	monthly	
returns	for	the	trailing	36	months	of	both	the	composite	and	
benchmark.
Returns and Fees
Returns	reflect	the	deduction	of	all	trading	expenses	and	
the	reinvestment	of	dividends	and	other	earnings.		Gross	
returns	do	not	reflect	the	deduction	of	investment	advisory	
fees	or	any	other	expenses	that	may	be	incurred	in	the	
management	of	the	account.		Net	returns	are	net	of	model	
investment	advisory	fees	in	effect	for	the	respective	time	
period.		Actual	fees	may	vary	depending	on,	among	other	
things,	the	applicable	fee	schedule	and	portfolio	size.		
Further,	the	impact	of	management	fees	over	time	may	
be	different	from	the	actual	management	fees	used	in	the	
calculation	during	periods	of	significant	volatility.		WHV’s	
investment	advisory	fees	are	described	in	Form	ADV	Part	
II.		Valuations	and	returns	are	computed	and	stated	in	U.S.	
dollars.		Past	performance	is	not	a	guarantee	of	future	
results.
The Management Fee Schedule is as follows:
Incremental	Annual	Fee	Rate	as	a	Percentage	of	Market	
Value
First	$10	million	@	1.00%	|	Next	$15	million	@	.80%	|	Next	
$25	million	@	.75%	|	Next	$50	million	@	.60%	|	All	over	$100	
million	@	.50%
901 5th
Avenue, Suite 3130
Seattle, WA 98164-2008
Tel: (800) 258-1388
Fax:(206) 219-2479
301 Battery Street, Suite 400
San Francisco, CA 94111-3203
Tel: (800) 204-2650
Fax:(415) 288-6153
whv.com
Small Cap Equity Composite
WHV Investment Management
Definition of the Firm
WHV	is	an	investment	adviser,	registered	under	the	
Investment	Advisers	Act	of	1940.	WHV	manages	a	variety	of	
equity	and	balanced	portfolios	working	from	offices	in	San	
Francisco	and	Seattle.		WHV	is	“the	firm”	for	purposes	of	
determining	the	Total	Firm	Assets	under	management	and	
firm-wide	compliance.		Registration	with	the	SEC	does	not	
imply	a	certain	level	of	skill	or	training.
Year Ended
Total Return
(%)
Gross of
Fees
Total Return
(%)
Net of Fees
Benchmark
Returns
(%)
Composite
Dispersion
(%)
Ex-Post Standard Deviation
(%)
Number of
Portfolios at
End of Period
Total Assets
at End of
Period
($ millions)
Total Firm
Assets
($ millions)Composite Benchmark
Y 12/31/12 13.33 12.63 16.35 1.10 22.16 20.20 31 1,295.2 13,404
Y 12/31/11 -7.06 -7.99 -4.18 0.69 28.24 24.99 33 1,174.0 13,250
Y 12/31/10 26.40 25.16 26.85 0.93 n/a n/a 35 1,165.5 15,213
Y 12/31/09 53.82 52.34 27.17 1.36 n/a n/a 43 1,057.8 12,646
Y 12/31/08 -43.46 -44.06 -33.79 0.65 n/a n/a 47 713.9 8,376
Y 12/31/07 12.82 11.71 -1.57 1.78 n/a n/a 47 1,374.7 14,400
Y 12/31/06 16.88 15.73 18.37 0.75 n/a n/a 51 1,283.0 9,013
Y 12/31/05 16.48 15.33 4.55 4.13 n/a n/a 51 1,027.0 6,630
Y 12/31/04 20.36 19.18 18.33 2.56 n/a n/a 43 727.9 5,700
Y 12/31/03 47.78 46.36 47.25 2.51 n/a n/a 37 598.2 5,424
Compliance Statement
WHV	Investment	Management	(WHV)	claims	compliance	
with	the	Global	Investment	Performance	Standards	(GIPS®)	
and	has	prepared	and	presented	this	report	in	compliance	
with	the	GIPS	standards.	WHV	has	been	independently	
verified	for	the	periods	from	October	1,	1994	through	
December	31,	2011.
Verification	assesses	whether	(1)	the	firm	has	complied	with	
all	the	composite	construction	requirements	of	the	GIPS	
standards	on	a	firm-wide	basis	and	(2)	the	firm’s	policies	
and	procedures	are	designed	to	calculate	and	present	
performance	in	compliance	with	the	GIPS	standards.		The	
Small	Cap	Equity	composite	has	been	examined	for	the	
periods	from	January	1,	2000	through	December	31,	2011.		
The	verification	and	performance	examination	reports	are	
available	upon	request.
Polices
WHV’s	policies	for	valuing	portfolios,	calculating	
performance,	and	preparing	compliant	presentations	are	
available	upon	request.
Composite Description
The	composite	was	created	on	October	31,	2004.		The	
composite	includes	all	non-wrap	accounts	invested	in	the	
firm’s	Small	Cap	Equity	strategy.		The	Small	Cap	Equity	
strategy	is	a	diversified	portfolio	of	companies	having,	at	the	
time	of	purchase,	a	minimum	market	cap	of	the	lower	bound	
and	a	maximum	cap	of	the	upper	bound	of	the	market	cap	
range	of	the	Russell	2000®	Index,	as	of	that	index’s	most	
recent	reconstitution.		Securities	eligible	for	purchase	shall	
be	marketable	with	quotations	available	on	recognized	
exchanges.		The	investment	style	can	be	defined	as	GARP-
oriented	(growth	at	a	reasonable	rate).		A	list	of	composite	
descriptions	is	available	upon	request.
Minimum Account Size
Currently,	there	is	no	minimum	asset	level	for	inclusion	in	the	
composite.		Prior	to	January	1,	2012,	the	minimum	asset	
level	for	inclusion	was	$100,000.		Prior	to	January	1,	2010,	
the	minimum	asset	level	for	inclusion	was	$50,000.
Benchmark
The	benchmark	for	the	Small	Cap	Equity	strategy	is	the	
Russell	2000®	Index,	which	measures	the	performance	
of	the	small	cap	segment	of	the	U.S.	equity	universe.		The	
returns	of	the	benchmark	are	provided	to	represent	the	
investment	environment	that	existed	during	the	time	period	
shown	and	are	not	covered	by	the	report	of	the	independent	
verifiers.		For	comparison	purposes,	the	index	includes	
the	reinvestment	of	income	and	other	earnings	but	does	
not	include	any	trading	expenses,	management	fees	or	
other	costs.		The	volatility	of	the	composite	and	that	of	
the	benchmark	may	be	materially	different	due	to	varying	
degrees	of	diversification	and/or	other	factors.
Dispersion
Composite	dispersion	is	measured	by	the	standard	
deviation	across	returns	of	portfolios	represented	within	
the	composite	for	the	full	period.		Standard	deviation	is	
calculated	on	asset-weighted	portfolio	returns.		Composite	
dispersion	is	not	presented	for	quarterly	periods	or	for	years	
where	the	composite	consisted	of	five	or	fewer	accounts	
as	it	is	not	considered	statistically	meaningful.		Ex-post	
standard	deviation	is	the	annualized	standard	deviation	
of	monthly	returns	for	the	trailing	36	months	of	both	the	
composite	and	benchmark.
Returns and Fees
Returns	reflect	the	deduction	of	all	trading	expenses	and	
the	reinvestment	of	dividends	and	other	earnings.		Gross	
returns	do	not	reflect	the	deduction	of	investment	advisory	
fees	or	any	other	expenses	that	may	be	incurred	in	the	
management	of	the	account.		Net	returns	are	net	of	model	
investment	advisory	fees	in	effect	for	the	respective	time	
period.		Actual	fees	may	vary	depending	on,	among	other	
things,	the	applicable	fee	schedule	and	portfolio	size.		
Further,	the	impact	of	management	fees	over	time	may	
be	different	from	the	actual	management	fees	used	in	the	
calculation	during	periods	of	significant	volatility.		WHV’s	
investment	advisory	fees	are	described	in	Form	ADV	Part	
II.		Valuations	and	returns	are	computed	and	stated	in	
U.S.	dollars.	Past	performance	is	not	a	guarantee	of	future	
results.
The Management Fee Schedule is as follows:
Incremental	Annual	Fee	Rate	as	a	Percentage	of	Market	
Value
First	$10	million	@	1.00%	|	Next	$15	million	@	.80%	|	Next	
$25	million	@	.75%	|	Next	$50	million	@	.60%	|	All	over	$100	
million	@	.50%
901 5th
Avenue, Suite 3130
Seattle, WA 98164-2008
Tel: (800) 258-1388
Fax:(206) 219-2479
301 Battery Street, Suite 400
San Francisco, CA 94111-3203
Tel: (800) 204-2650
Fax:(415) 288-6153
whv.com
Micro Cap Equity Composite
WHV Investment Management
Definition of the Firm
WHV is an investment adviser, registered under the
Investment Advisers Act of 1940. WHV manages a
variety of equity and balanced portfolios working from
offices in San Francisco and Seattle. WHV is “the firm”
for purposes of determining the Total Firm Assets under
management and firm-wide compliance. Registration with
the SEC does not imply a certain level of skill or training.
Year Ended
Total Return
(%)
Gross of
Fees
Total Return
(%)
Net of Fees
Benchmark
Returns
(%)
Composite
Dispersion
(%)
Ex-Post Standard
Deviation (%)
Number of
Portfolios
at End of
Period
Total Assets
at End of
Period
($ millions)
Non-Fee-
Paying
Portfolios
(% of
Composite
Assets)
Total Firm
Assets
($ millions)Composite Benchmark
Y 12/31/12 12.90 11.79 21.11 n/m 26.06 20.23 5 6.6 79 13,404
Y 12/31/11 -11.29 -12.18 -11.33 n/m 34.60 25.51 5 6.4 n/a 13,250
Y 12/31/10 40.88 39.51 30.08 n/m n/a n/a 3 6.0 n/a 15,213
Y 12/31/09 141.62 139.37 46.62 n/m n/a n/a 3 6.0 n/a 12,646
Y 12/31/08^ 4.56 4.48 1.92 n/m n/a n/a 2 2.1 n/a 8,376
^ Returns are for the period from 12/01/2008 through 12/31/2008.
Compliance Statement
WHV Investment Management (WHV) claims compliance
with the Global Investment Performance Standards
(GIPS®) and has prepared and presented this report in
compliance with the GIPS standards. WHV has been
independently verified for the periods from October 1,
1994 through December 31, 2011.
Verification assesses whether (1) the firm has complied
with all the composite construction requirements of
the GIPS standards on a firm-wide basis and (2) the
firm’s policies and procedures are designed to calculate
and present performance in compliance with the GIPS
standards. The Micro Cap Equity composite has been
examined for the periods from December 1, 2008 through
December 31, 2011. The verification and performance
examination reports are available upon request.
Polices
WHV’s policies for valuing portfolios, calculating
performance, and preparing compliant presentations are
available upon request.
Composite Description
The composite was created on November 30, 2008. The
composite includes all non-wrap accounts invested in
the firm’s Micro Cap Equity strategy, a portfolio of equity
securities with market capitalization between $10 million
and $500 million upon purchase that seeks to generate
long-term capital appreciation. A list of composite
descriptions is available upon request.
Minimum Account Size
Currently, there is no minimum asset level for inclusion in
the composite. Prior to January 1, 2012, the minimum
asset level for inclusion was $100,000. Prior to January 1,
2010, the minimum asset level for was $50,000.
Benchmark
The benchmark for the Micro Cap Equity composite is
the Dow Jones U.S. Micro-Cap Total Stock Market Index�
which is comprised of stocks with market capitalization
rankings ranked below 2,501 and below within the Dow
Jones U.S. Total Stock Market Index�. The returns of
the benchmark are provided to represent the investment
environment that existed during the time period shown
and are not covered by the report of the independent
verifiers. For comparison purposes, the index includes
the reinvestment of income and other earnings but does
not include any trading expenses, management fees or
other costs. The volatility of the composite and that of
the benchmark may be materially different due to varying
degrees of diversification and/or other factors.
Dispersion
Composite dispersion is measured by the standard
deviation across returns of portfolios represented within
the composite for the full period. Standard deviation
is calculated on asset-weighted portfolio returns.
Composite dispersion is not presented for quarterly
periods or for years where the composite consisted of
five or fewer accounts as it is not considered statistically
meaningful. Ex-post standard deviation is the annualized
standard deviation of monthly returns for the trailing 36
months of both the composite and benchmark.
Returns and Fees
Returns reflect the deduction of all trading expenses
and the reinvestment of dividends and other earnings.
Gross returns do not reflect the deduction of investment
advisory fees or any other expenses that may be incurred
in the management of the account. Net returns are
net of model investment advisory fees in effect for the
respective time period. Actual fees may vary depending
on, among other things, the applicable fee schedule and
portfolio size. Further, the impact of management fees
over time may be different from the actual management
fees used in the calculation during periods of significant
volatility. WHV’s investment advisory fees are described
in Form ADV Part II. Valuations and returns are computed
and stated in U.S. dollars. Past performance is not a
guarantee of future results.
The Management Fee Schedule is as follows:
1.00% Annual Fee Rate as a Percentage of Market Value
+ Performance Fee
901 5th Avenue, Suite 3130
Seattle, WA 98164-2008
Tel: (800) 258-1388
Fax: (206) 219-2479
301 Battery Street, Suite 400
San Francisco, CA 94111-3203
Tel: (800) 204-2650
Fax: (415) 288-6153
whv.com
Emerging Markets Equity Composite
WHV Investment Management
Definition of the Firm
WHV	is	an	investment	adviser,	registered	under	the	
Investment	Advisers	Act	of	1940.	WHV	manages	a	variety	of	
equity	and	balanced	portfolios	working	from	offices	in	San	
Francisco	and	Seattle.			WHV	is	“the	firm”	for	purposes	of	
determining	the	Total	Firm	Assets	under	management	and	
firm-wide	compliance.	Registration	with	the	SEC	does	not	
imply	a	certain	level	of	skill	or	training.	
Year Ended
Total Return
(%)
Gross of
Fees
Total Return
(%)
Net of Fees
Benchmark
Returns
(%)
Composite
Dispersion
(%)
Ex-Post Standard Deviation
(%)
Number of
Portfolios at
End of Period
Total Assets
at End of
Period
($ millions)
Total Firm
Assets
($ millions)Composite Benchmark
Y 12/31/12 17.27 16.12 18.22 n/m 23.91 21.50 2 10.5 13,404
Y 12/31/11 -18.76 -19.59 -18.42 n/m n/a n/a 2 9.0 13,250
Y 12/31/10 19.74 18.56 18.88 n/m n/a n/a 2 11.2 15,213
Y 12/31/09^ 29.90 29.27 31.24 n/m n/a n/a 1 2.5 12,646
^	 Returns	are	for	the	period	from	7/1/2009	through	12/31/2009.
Compliance Statement
WHV	Investment	Management	(WHV)	claims	compliance	
with	the	Global	Investment	Performance	Standards	(GIPS®)	
and	has	prepared	and	presented	this	report	in	compliance	
with	the	GIPS	standards.	WHV	has	been	independently	
verified	for	the	periods	from	October	1,	1994	through	
December	31,	2011.
Verification	assesses	whether	(1)	the	firm	has	complied	with	
all	the	composite	construction	requirements	of	the	GIPS	
standards	on	a	firm-wide	basis	and	(2)	the	firm’s	policies	
and	procedures	are	designed	to	calculate	and	present	
performance	in	compliance	with	the	GIPS	standards.		The	
Emerging	Markets	Equity	composite	has	been	examined	for	
the	periods	from	July	1,	2009	through	December	31,	2011.		
The	verification	and	performance	examination	reports	are	
available	upon	request.
Polices
WHV’s	policies	for	valuing	portfolios,	calculating	
performance,	and	preparing	compliant	presentations	are	
available	upon	request.
Composite Description
The	composite	was	created	on	June	1,	2009.		The	
composite	includes	all	non-wrap	accounts,	excluding	
mutual	funds,	invested	in	the	firm’s	Emerging	Markets	
Equity	strategy.		The	strategy	seeks	to	generate	long-term	
capital	appreciation	by	investing	in	international	companies	
in	countries	that	are	in	the	process	of	rapid	growth	and	
industrialization.		A	list	of	composite	descriptions	is	available	
upon	request.
Minimum Account Size
Currently	there	is	no	minimum	asset	level	for	inclusion	in	the	
composite.		Prior	to	January	1,	2012,	the	minimum	asset	
level	for	inclusion	was	$100,000.		Prior	to	January	1,	2010,	
the	minimum	asset	level	for	inclusion	was	$50,000.
Benchmark
The	benchmark	for	the	Emerging	Markets	Equity	composite	
is	the	MSCI	Emerging	Markets	(Net)	Index,	which	measures	
the	equity	market	performance	of	21	emerging	market	
countries.	The	returns	of	the	benchmark	are	provided	to	
represent	the	investment	environment	that	existed	during	the	
time	period	shown	and	are	not	covered	by	the	report	of	the	
independent	verifiers.		For	comparison	purposes,	the	index	
includes	the	reinvestment	of	income	and	other	earnings	but	
does	not	include	any	trading	expenses,	management	fees	
or	other	costs.		The	volatility	of	the	composite	and	that	of	
the	benchmark	may	be	materially	different	due	to	varying	
degrees	of	diversification	and/or	other	factors.
A	large	percentage	of	the	equity	assets	in	the	composite	
is	invested	in	countries	or	regions	not	included	in	the	
benchmark.
Dispersion
Composite	dispersion	is	measured	by	the	standard	
deviation	across	returns	of	all	portfolios	represented	within	
the	composite	for	the	full	period.	Standard	deviation	is	
calculated	on	asset-weighted	portfolio	returns.		Composite	
dispersion	is	not	presented	for	quarterly	periods	or	for	years	
where	the	composite	consisted	of	five	or	fewer	accounts	
as	it	is	not	considered	statistically	meaningful.		Three-year	
annualized	ex-post	standard	deviation	is	not	presented	
because	the	composite	does	not	have	36	monthly	returns	
as	of	December	31,	2011.
Returns and Fees
Returns	reflect	the	deduction	of	all	trading	expenses	and	
the	reinvestment	of	dividends	and	other	earnings.		Gross	
returns	do	not	reflect	the	deduction	of	investment	advisory	
fees	or	any	other	expenses	that	may	be	incurred	in	the	
management	of	the	account.		Net	returns	are	net	of	model	
investment	advisory	fees	in	effect	for	the	respective	time	
period.		Actual	fees	may	vary	depending	on,	among	other	
things,	the	applicable	fee	schedule	and	portfolio	size.		
Further,	the	impact	of	management	fees	over	time	may	
be	different	from	the	actual	management	fees	used	in	the	
calculation	during	periods	of	significant	volatility.		WHV’s	
investment	advisory	fees	are	described	in	Form	ADV	Part	
II.		Valuations	and	returns	are	computed	and	stated	in	U.S.	
dollars.		Past	performance	is	not	a	guarantee	of	future	
results.
The Management Fee Schedule is as follows:
Incremental	Annual	Fee	Rate	as	a	Percentage	of	Market	
Value
First	$10	million	@	1.00%	|	Next	$15	million	@	.80%	|	Next	
$25	million	@	.75%	|	Next	$50	million	@	.60%	|	All	over	$100	
million	@	.50%
901 5th
Avenue, Suite 3130
Seattle, WA 98164-2008
Tel: (800) 258-1388
Fax:(206) 219-2479
301 Battery Street, Suite 400
San Francisco, CA 94111-3203
Tel: (800) 204-2650
Fax:(415) 288-6153
whv.com
International Small Cap Equity Composite
WHV Investment Management
Year Ended
Total Return (%)
Gross of Fees
Total Return (%)
Net of Fees
Benchmark
Returns
(%)
Composite
Dispersion (%)
Number of
Portfolios at End
of Period
Total Assets at
End of Period
($ millions)
Total Firm Assets
($ millions)
Y 12/31/12^ -1.83 -2.57 3.70 n/m 1 1.9 13,404
^ Returns are for the period from 4/1/2012 through 12/31/2012.
Compliance Statement
WHV	Investment	Management	(WHV)	claims	compliance	
with	the	Global	Investment	Performance	Standards	(GIPS®)	
and	has	prepared	and	presented	this	report	in	compliance	
with	the	GIPS	standards.	WHV	has	been	independently	
verified	for	the	periods	from	October	1,	1994	through	
December	31,	2011.			The	verification	reports	are	available	
upon	request.
Verification	assesses	whether	(1)	the	firm	has	complied	with	
all	the	composite	construction	requirements	of	the	GIPS	
standards	on	a	firm-wide	basis	and	(2)	the	firm’s	policies	
and	procedures	are	designed	to	calculate	and	present	
performance	in	compliance	with	the	GIPS	standards.	
Verification	does	not	ensure	the	accuracy	of	any	specific	
composite	presentation.	
Definition of the Firm
WHV	is	an	investment	adviser,	registered	under	the	
Investment	Advisers	Act	of	1940.	WHV	manages	a	variety	of	
equity	and	balanced	portfolios	working	from	offices	in	San	
Francisco	and	Seattle.			WHV	is	“the	firm”	for	purposes	of	
determining	the	Total	Firm	Assets	under	management	and	
firm-wide	compliance.	Registration	with	the	SEC	does	not	
imply	a	certain	level	of	skill	or	training.	
Policies
WHV’s	policies	for	valuing	portfolios,	calculating	
performance,	and	preparing	compliant	presentations	are	
available	upon	request.
Composite Description
The	composite	was	created	on	March	19,	2012.		The	
composite	includes	all	non-wrap	accounts	invested	in	the	
firm’s	International	Small	Cap	Equity	strategy,	a	portfolio	of	
primarily	small	cap	growth	stocks	domiciled	in	international	
developed	and	emerging	markets	countries.		The	portfolio	
invests	in	foreign	equity	securities,	U.S.	dollar	denominated	
equity	securities,	depository	receipts	such	as	Global	
Depository	Receipts	and	American	Depository	Receipts,	
and	Non-Voting	Depository	Receipts.		A	list	of	composite	
descriptions	is	available	upon	request.		
Benchmark
The	benchmark	for	the	International	Small	Cap	Equity	
composite	is	the	MSCI	ACWI	Ex-USA	Small	Cap	(Net)	
Index,	which	measures	the	performance	of	small	cap	
stocks	of	23	developed	countries	and	21	emerging	markets	
countries.	The	returns	of	the	benchmark	are	provided	to	
represent	the	investment	environment	that	existed	during	
the	time	period	shown.		For	comparison	purposes,	the	index	
includes	the	reinvestment	of	income	and	other	earnings	but	
does	not	include	any	trading	expenses,	management	fees	
or	other	costs.		The	volatility	of	the	composite	and	that	of	
the	benchmark	may	be	materially	different	due	to	varying	
degrees	of	diversification	and/or	other	factors.
Dispersion
Composite	dispersion	is	measured	by	the	standard	
deviation	across	returns	of	all	portfolios	represented	within	
the	composite	for	the	full	period.	Standard	deviation	is	
calculated	on	asset-weighted	portfolio	returns.		Composite	
dispersion	is	not	presented	for	quarterly	periods	or	for	years	
where	the	composite	consisted	of	five	or	fewer	accounts	
as	it	is	not	considered	statistically	meaningful.		Three-year	
annualized	ex-post	standard	deviation	is	not	presented	
because	the	composite	does	not	have	36	monthly	returns	
as	of	December	31,	2012.
Returns and Fees
Returns	reflect	the	deduction	of	all	trading	expenses	and	
the	reinvestment	of	dividends	and	other	earnings.		Gross	
returns	do	not	reflect	the	deduction	of	investment	advisory	
fees	or	any	other	expenses	that	may	be	incurred	in	the	
management	of	the	account.		Net	returns	are	net	of	model	
investment	advisory	fees	in	effect	for	the	respective	time	
period.		Actual	fees	may	vary	depending	on,	among	other	
things,	the	applicable	fee	schedule	and	portfolio	size.		
Further,	the	impact	of	management	fees	over	time	may	
be	different	from	the	actual	management	fees	used	in	the	
calculation	during	periods	of	significant	volatility.		WHV’s	
investment	advisory	fees	are	described	in	Form	ADV	Part	
II.		Valuations	and	returns	are	computed	and	stated	in	U.S.	
dollars.		Past	performance	is	not	a	guarantee	of	future	
results.		
The management fee schedule is as follows:
Incremental	Annual	Fee	Rate	as	a	Percentage	of	Market	
Value
First	$50	million	@	1.00%	|	Next	$50	million	@	.80%	|	Next	
$100	million	@	.70%	|	Fees	for	assets	over	$200	million	are	
negotiable.		
301 Battery Street, Suite 400
San Francisco, CA 94111-3203
Tel: (800) 204-2650
Fax:(415) 288-6153
whv.com
901 5th
Avenue, Suite 3130
Seattle, WA 98164-2008
Tel: (800) 258-1388
Fax:(206) 219-2479
Select World Equity Composite
WHV Investment Management
Definition of the Firm
WHV	is	an	investment	adviser,	registered	under	the	
Investment	Advisers	Act	of	1940.	WHV	manages	a	variety	of	
equity	and	balanced	portfolios	working	from	offices	in	San	
Francisco	and	Seattle.	WHV	is	“the	firm”	for	purposes	of	
determining	the	Total	Firm	Assets	under	management	and	
firm-wide	compliance.	Registration	with	the	SEC	does	not	
imply	a	certain	level	of	skill	or	training.	
Year Ended
Total Return
(%)
Gross of
Fees
Total Return
(%)
Net of Fees
Benchmark
Returns
(%)
Composite
Dispersion
(%)
Ex-Post Standard Deviation
(%)
Number of
Portfolios at
End of Period
Total Assets
at End of
Period
($ millions)
Total Firm
Assets
($ millions)Composite Benchmark
Y 12/31/12 16.46 15.32 16.13 0.72 20.02 16.94 9 19.2 13,404
Y 12/31/11 -4.70 -5.62 -1.20 1.26 21.81 20.16 11 18.4 13,250
Y 12/31/10 15.39 14.25 17.96 0.82 n/a n/a 13 24.3 15,213
Y 12/31/09 41.69 40.32 29.59 0.90 n/a n/a 11 20.8 12,646
Y 12/31/08 -38.98 -39.61 -37.13 0.87 n/a n/a 13 16.0 8,376
Y 12/31/07 15.79 14.65 5.88 n/m n/a n/a 4 5.6 14,400
Y 12/31/06^ 6.81 5.92 11.44 n/m n/a n/a 3 4.0 9,013
^	 Returns	are	for	the	period	from	3/1/2006	through	12/31/2006.
Compliance Statement
WHV	Investment	Management	(WHV)	claims	compliance	
with	the	Global	Investment	Performance	Standards	(GIPS®)	
and	has	prepared	and	presented	this	report	in	compliance	
with	the	GIPS	standards.	WHV	has	been	independently	
verified	for	the	periods	from	October	1,	1994	through	
December	31,	2011.		The	verification	reports	are	available	
upon	request.
Verification	assesses	whether	(1)	the	firm	has	complied	with	
all	the	composite	construction	requirements	of	the	GIPS	
standards	on	a	firm-wide	basis	and	(2)	the	firm’s	policies	
and	procedures	are	designed	to	calculate	and	present	
performance	in	compliance	with	the	GIPS	standards.	
Verification	does	not	ensure	the	accuracy	of	any	specific	
composite	presentation.
Polices
WHV’s	policies	for	valuing	portfolios,	calculating	
performance,	and	preparing	compliant	presentations	are	
available	upon	request.
Composite Description
The	composite	was	created	on	February	28,	2006.	The	
composite	includes	all	non-wrap	accounts	invested	in	the	
firm’s	Select	World	Equity	strategy,	formerly	called	All	Cap	
Plus	International	Equity	strategy.		The	strategy,	which	
encompasses	multiple	distinct	equity	strategies,	was	
redefined	effective	January	1,	2012	with	the	addition	of	
emerging	markets	to	large	cap	core,	mid	cap,	small	cap,	
and	international	strategies.		A	list	of	composite	descriptions	
is	available	upon	request.
Minimum Account Size
Currently,	there	is	no	minimum	asset	level	for	inclusion	in	the	
composite.		Prior	to	January	1,	2012,	the	minimum	asset	
level	for	inclusion	was	$100,000.		Prior	to	January	1,	2010,	
the	minimum	asset	level	for	inclusion	was	$50,000.
Benchmark
The	design	of	this	strategy	which	combines	several	distinct	
equity	strategies,	permits	changing	the	mix	from	time	
to	time.		Prior	to	January	2012,	the	strategy	combined	
55%	large	cap	core,	20%	mid	cap,	12.5%	small	cap,	
and	12.5%	international	equities	and	was	benchmarked	
against	corresponding	weightings	of	the	SP	500®
,	SP	
MidCap	400®
,	Russell	2000®
,	and	MSCI	EAFE	(Gross)	
indices.		Beginning	January	2012,	with	the	addition	of	
emerging	markets,	the	benchmark	for	the	strategy	was	
changed	to	the	MSCI	ACWI	(Net)	index	which	measures	
the	equity	market	performance	of	24	developed	and	21	
emerging	market	countries.	The	benchmark	is	weighted	
monthly.		The	returns	of	the	benchmark	are	provided	to	
represent	the	investment	environment	that	existed	during	
the	time	period	shown.		For	comparison	purposes,	the	index	
includes	the	reinvestment	of	income	and	other	earnings	but	
does	not	include	any	trading	expenses,	management	fees	
or	other	costs.		The	volatility	of	the	composite	and	that	of	
the	benchmark	may	be	materially	different	due	to	varying	
degrees	of	diversification	and/or	other	factors.
Dispersion
Composite	dispersion	is	measured	by	the	standard	
deviation	across	returns	of	all	portfolios	represented	within	
the	composite	for	the	full	period.	Standard	deviation	is	
calculated	on	asset-weighted	portfolio	returns.		Composite	
dispersion	is	not	presented	for	quarterly	periods	or	for	years	
where	the	composite	consisted	of	five	or	fewer	accounts	
as	it	is	not	considered	statistically	meaningful.		Ex-post	
standard	deviation	is	the	annualized	standard	deviation	
of	monthly	returns	for	the	trailing	36	months	of	both	the	
composite	and	benchmark.
Returns and Fees
Returns	reflect	the	deduction	of	all	trading	expenses	and	
the	reinvestment	of	dividends	and	other	earnings.		Gross	
returns	do	not	reflect	the	deduction	of	investment	advisory	
fees	or	any	other	expenses	that	may	be	incurred	in	the	
management	of	the	account.		Net	returns	are	net	of	model	
investment	advisory	fees	in	effect	for	the	respective	time	
period.		Actual	fees	may	vary	depending	on,	among	other	
things,	the	applicable	fee	schedule	and	portfolio	size.		
Further,	the	impact	of	management	fees	over	time	may	
be	different	from	the	actual	management	fees	used	in	the	
calculation	during	periods	of	significant	volatility.		WHV’s	
investment	advisory	fees	are	described	in	Form	ADV	Part	
II.		Valuations	and	returns	are	computed	and	stated	in	U.S.	
dollars.		Past	performance	is	not	a	guarantee	of	future	
results.
The Management Fee Schedule is as follows:
Incremental	Annual	Fee	Rate	as	a	Percentage	of	Market	
Value
First	$10	million	@	1.00%		|		Next	$15	million	@	0.80%		|		
Next	$25	million	@	0.75%		|		Next	$50	million	@	0.60%		|		All	
over	$100	million	@	0.50%
901 5th
Avenue, Suite 3130
Seattle, WA 98164-2008
Tel: (800) 258-1388
Fax:(206) 219-2479
301 Battery Street, Suite 400
San Francisco, CA 94111-3203
Tel: (800) 204-2650
Fax:(415) 288-6153
whv.com
Large Cap Core Equity Composite
WHV Investment Management
Definition of the Firm
WHV	is	an	investment	adviser,	registered	under	the	
Investment	Advisers	Act	of	1940.	WHV	manages	a	variety	of	
equity	and	balanced	portfolios	working	from	offices	in	San	
Francisco	and	Seattle.			WHV	is	“the	firm”	for	purposes	of	
determining	the	Total	Firm	Assets	under	management	and	
firm-wide	compliance.		Registration	with	the	SEC	does	not	
imply	a	certain	level	of	skill	or	training.
Year Ended
Total Return
(%)
Gross of
Fees
Total Return
(%)
Net of Fees
Benchmark
Returns
(%)
Composite
Dispersion
(%)
Ex-Post Standard Deviation
(%)
Number of
Portfolios at
End of Period
Total Assets
at End of
Period
($ millions)
Total Firm
Assets
($ millions)Composite Benchmark
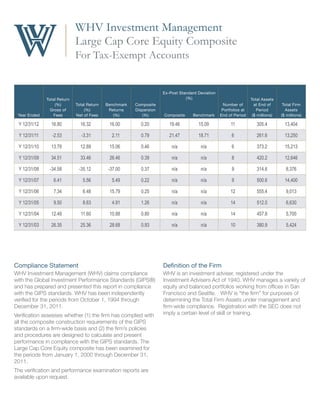
Y 12/31/12 16.80 16.32 16.00 0.20 19.46 15.09 11 305.4 13,404
Y 12/31/11 -2.53 -3.31 2.11 0.79 21.47 18.71 6 261.6 13,250
Y 12/31/10 13.79 12.89 15.06 0.46 n/a n/a 6 373.2 15,213
Y 12/31/09 34.51 33.46 26.46 0.39 n/a n/a 8 420.2 12,646
Y 12/31/08 -34.58 -35.12 -37.00 0.37 n/a n/a 9 314.6 8,376
Y 12/31/07 6.41 5.56 5.49 0.22 n/a n/a 9 500.6 14,400
Y 12/31/06 7.34 6.48 15.79 0.25 n/a n/a 12 555.4 9,013
Y 12/31/05 9.50 8.63 4.91 1.26 n/a n/a 14 512.0 6,630
Y 12/31/04 12.49 11.60 10.88 0.80 n/a n/a 14 457.8 5,700
Y 12/31/03 26.35 25.36 28.68 0.93 n/a n/a 10 380.9 5,424
For Tax-Exempt Accounts
Compliance Statement
WHV	Investment	Management	(WHV)	claims	compliance	
with	the	Global	Investment	Performance	Standards	(GIPS®)	
and	has	prepared	and	presented	this	report	in	compliance	
with	the	GIPS	standards.	WHV	has	been	independently	
verified	for	the	periods	from	October	1,	1994	through	
December	31,	2011.
Verification	assesses	whether	(1)	the	firm	has	complied	with	
all	the	composite	construction	requirements	of	the	GIPS	
standards	on	a	firm-wide	basis	and	(2)	the	firm’s	policies	
and	procedures	are	designed	to	calculate	and	present	
performance	in	compliance	with	the	GIPS	standards.	The	
Large	Cap	Core	Equity	composite	has	been	examined	for	
the	periods	from	January	1,	2000	through	December	31,	
2011.
The	verification	and	performance	examination	reports	are	
available	upon	request.
Polices
WHV’s	policies	for	valuing	portfolios,	calculating	
performance,	and	preparing	compliant	presentations	are	
available	upon	request.
Composite Description
The	composite	was	created	on	October	31,	2004.		The	
composite	includes	all	non-wrap,	tax-exempt	accounts	
invested	in	the	firm’s	Large	Cap	Core	Equity	strategy.		The	
Large	Cap	Core	Equity	strategy	is	a	high	quality,	focused	
portfolio	of	domestic,	large	cap,	GARP-oriented	(growth	at	
a	reasonable	price)	stocks	expected	to	generate	above-
benchmark	returns	over	a	market	cycle.		A	list	of	composite	
descriptions	is	available	upon	request.
Minimum Account Size
Currently,	there	is	no	minimum	asset	level	for	inclusion	in	the	
composite.		Prior	to	January	1,	2012,	the	minimum	asset	
level	for	inclusion	was	$2,000,000.
Benchmark
The	benchmark	for	the	Large	Cap	Core	Equity	composite	
is	SP	500®
	Index.		The	returns	of	the	benchmark	are	
provided	to	represent	the	investment	environment	that	
existed	during	the	time	period	shown	and	are	not	covered	
by	the	report	of	the	independent	verifiers.		For	comparison	
purposes,	the	index	includes	the	reinvestment	of	income	
and	other	earnings	but	does	not	include	any	trading	
expenses,	management	fees	or	other	costs.		The	volatility	of	
the	composite	and	that	of	the	benchmark	may	be	materially	
different	due	to	varying	degrees	of	diversification	and/or	
other	factors.
Dispersion
Composite	dispersion	is	measured	by	the	standard	
deviation	across	returns	of	all	portfolios	represented	within	
the	composite	for	the	full	period.	Standard	deviation	is	
calculated	on	asset-weighted	portfolio	returns.		Composite	
dispersion	is	not	presented	for	quarterly	periods	or	for	years	
where	the	composite	consists	of	five	or	fewer	accounts	as	it	
is	not	considered	statistically	meaningful.		Ex-post	standard	
deviation	is	the	annualized	standard	deviation	of	monthly	
returns	for	the	trailing	36	months	of	both	the	composite	and	
benchmark.
Returns and Fees
Returns	reflect	the	deduction	of	all	trading	expenses	and	
the	reinvestment	of	dividends	and	other	earnings.	Gross	
returns	do	not	reflect	the	deduction	of	investment	advisory	
fees	or	any	other	expenses	that	may	be	incurred	in	the	
management	of	the	account.	Net	returns	are	net	of	model	
investment	advisory	fees	in	effect	for	the	respective	time	
period.	Actual	fees	may	vary	depending	on,	among	other	
things,	the	applicable	fee	schedule	and	portfolio	size.	
Further,	the	impact	of	management	fees	over	time	may	
be	different	from	the	actual	management	fees	used	in	the	
calculation	during	periods	of	significant	volatility.	WHV’s	
investment	advisory	fees	are	described	in	Form	ADV	Part	
II.	Valuations	and	returns	are	computed	and	stated	in	U.S.	
dollars.	Past	performance	is	not	a	guarantee	of	future	
results.
The Management Fee Schedule is as follows:
Incremental	Annual	Fee	Rate	as	a	Percentage	of	Market	
Value
First	$2	million	@	.80%	|	Next	$8	million	@	0.60%	|	Next	$10	
million	@	0.50%	|	Next	$10	million	@	0.40%	|	All	over	$30	
million	@	0.30%
901 5th
Avenue, Suite 3130
Seattle, WA 98164-2008
Tel: (800) 258-1388
Fax: (206) 219-2479
301 Battery Street, Suite 400
San Francisco, CA 94111-3203
Tel: (800) 204-2650
Fax: (415) 288-6153
whv.com

More Related Content

What's hot

2 william blair global market outlook - december 2013
2 william blair global market outlook - december 20132 william blair global market outlook - december 2013
2 william blair global market outlook - december 2013
123jumpad
 
Investment Edge Quarter 1 2011
Investment Edge Quarter 1 2011Investment Edge Quarter 1 2011
Investment Edge Quarter 1 2011simonkbowen
 
MergeGlobal - 2009 Containerized demand in main markets presentation final
MergeGlobal - 2009 Containerized demand in main markets presentation finalMergeGlobal - 2009 Containerized demand in main markets presentation final
MergeGlobal - 2009 Containerized demand in main markets presentation final
3GIntermodal
 
Putnam Outlook Q3 2013
Putnam Outlook Q3 2013Putnam Outlook Q3 2013
Putnam Outlook Q3 2013
Putnam Investments
 
Emerging Markets - Gimme Shelter
Emerging Markets - Gimme ShelterEmerging Markets - Gimme Shelter
Emerging Markets - Gimme Shelter
RBS Economics
 
Putnam Perspectives: Fixed-Income Outlook Q3 2014
Putnam Perspectives: Fixed-Income Outlook Q3 2014Putnam Perspectives: Fixed-Income Outlook Q3 2014
Putnam Perspectives: Fixed-Income Outlook Q3 2014
Putnam Investments
 
Etude PwC sur le BFR (2013)
Etude PwC sur le BFR (2013)Etude PwC sur le BFR (2013)
Etude PwC sur le BFR (2013)
PwC France
 
Nomura Global Outlook 2011
Nomura Global Outlook 2011Nomura Global Outlook 2011
Nomura Global Outlook 2011ClearHat
 
Analysis of the Credit Suisse Asia Corporate Bond Fund
Analysis of the Credit Suisse Asia Corporate Bond FundAnalysis of the Credit Suisse Asia Corporate Bond Fund
Analysis of the Credit Suisse Asia Corporate Bond Fund
Muhammad Aqdas
 
PwC Global Economy Watch (février 2014)
PwC Global Economy Watch (février 2014)PwC Global Economy Watch (février 2014)
PwC Global Economy Watch (février 2014)
PwC France
 
Case for International
Case for InternationalCase for International
Case for InternationalJohn Heilner
 
RSM_The_Real_Economy_Global_ENG_UK.PDF
RSM_The_Real_Economy_Global_ENG_UK.PDFRSM_The_Real_Economy_Global_ENG_UK.PDF
RSM_The_Real_Economy_Global_ENG_UK.PDFDavid Carlisle
 
Credit Suisse Global Investment Returns Yearbook 2016
Credit Suisse Global Investment Returns Yearbook 2016 Credit Suisse Global Investment Returns Yearbook 2016
Credit Suisse Global Investment Returns Yearbook 2016
Credit Suisse
 
Emerging Consumer Survey 2016
Emerging Consumer Survey 2016Emerging Consumer Survey 2016
Emerging Consumer Survey 2016
Credit Suisse
 
Business 502 Term Project - Investment Brochure
Business 502 Term Project - Investment BrochureBusiness 502 Term Project - Investment Brochure
Business 502 Term Project - Investment BrochureKawin Koh
 
Ch09 (3) emerging markets
Ch09 (3) emerging marketsCh09 (3) emerging markets
Ch09 (3) emerging markets
Samira Khan
 
Int financial report by prof.h.b kolhoff. (1)
Int financial report by prof.h.b kolhoff. (1)Int financial report by prof.h.b kolhoff. (1)
Int financial report by prof.h.b kolhoff. (1)GOLDENFALCON6666
 
Emerging markets
Emerging marketsEmerging markets
Emerging markets
Nikhil Chhabra
 

What's hot (20)

2 william blair global market outlook - december 2013
2 william blair global market outlook - december 20132 william blair global market outlook - december 2013
2 william blair global market outlook - december 2013
 
Investment Edge Quarter 1 2011
Investment Edge Quarter 1 2011Investment Edge Quarter 1 2011
Investment Edge Quarter 1 2011
 
MergeGlobal - 2009 Containerized demand in main markets presentation final
MergeGlobal - 2009 Containerized demand in main markets presentation finalMergeGlobal - 2009 Containerized demand in main markets presentation final
MergeGlobal - 2009 Containerized demand in main markets presentation final
 
Putnam Outlook Q3 2013
Putnam Outlook Q3 2013Putnam Outlook Q3 2013
Putnam Outlook Q3 2013
 
Emerging Markets - Gimme Shelter
Emerging Markets - Gimme ShelterEmerging Markets - Gimme Shelter
Emerging Markets - Gimme Shelter
 
Putnam Perspectives: Fixed-Income Outlook Q3 2014
Putnam Perspectives: Fixed-Income Outlook Q3 2014Putnam Perspectives: Fixed-Income Outlook Q3 2014
Putnam Perspectives: Fixed-Income Outlook Q3 2014
 
Etude PwC sur le BFR (2013)
Etude PwC sur le BFR (2013)Etude PwC sur le BFR (2013)
Etude PwC sur le BFR (2013)
 
Nomura Global Outlook 2011
Nomura Global Outlook 2011Nomura Global Outlook 2011
Nomura Global Outlook 2011
 
Analysis of the Credit Suisse Asia Corporate Bond Fund
Analysis of the Credit Suisse Asia Corporate Bond FundAnalysis of the Credit Suisse Asia Corporate Bond Fund
Analysis of the Credit Suisse Asia Corporate Bond Fund
 
PwC Global Economy Watch (février 2014)
PwC Global Economy Watch (février 2014)PwC Global Economy Watch (février 2014)
PwC Global Economy Watch (février 2014)
 
Case for International
Case for InternationalCase for International
Case for International
 
RSM_The_Real_Economy_Global_ENG_UK.PDF
RSM_The_Real_Economy_Global_ENG_UK.PDFRSM_The_Real_Economy_Global_ENG_UK.PDF
RSM_The_Real_Economy_Global_ENG_UK.PDF
 
Emerging markets
Emerging marketsEmerging markets
Emerging markets
 
Credit Suisse Global Investment Returns Yearbook 2016
Credit Suisse Global Investment Returns Yearbook 2016 Credit Suisse Global Investment Returns Yearbook 2016
Credit Suisse Global Investment Returns Yearbook 2016
 
Emerging Consumer Survey 2016
Emerging Consumer Survey 2016Emerging Consumer Survey 2016
Emerging Consumer Survey 2016
 
67 i chronicle
67 i chronicle67 i chronicle
67 i chronicle
 
Business 502 Term Project - Investment Brochure
Business 502 Term Project - Investment BrochureBusiness 502 Term Project - Investment Brochure
Business 502 Term Project - Investment Brochure
 
Ch09 (3) emerging markets
Ch09 (3) emerging marketsCh09 (3) emerging markets
Ch09 (3) emerging markets
 
Int financial report by prof.h.b kolhoff. (1)
Int financial report by prof.h.b kolhoff. (1)Int financial report by prof.h.b kolhoff. (1)
Int financial report by prof.h.b kolhoff. (1)
 
Emerging markets
Emerging marketsEmerging markets
Emerging markets
 

Similar to WHView1Q13

Global Investment Returns Yearbook 2014
Global Investment Returns Yearbook 2014Global Investment Returns Yearbook 2014
Global Investment Returns Yearbook 2014
Credit Suisse
 
Vietnam's Recent Economic Development 2013
Vietnam's Recent Economic Development  2013Vietnam's Recent Economic Development  2013
Vietnam's Recent Economic Development 2013
Quynh LE
 
BCG Report - Riding a Wave of Growth
BCG Report - Riding a Wave of GrowthBCG Report - Riding a Wave of Growth
BCG Report - Riding a Wave of Growth
Ildar Khabibullin
 
201407 Riding a Wave of Growth -´Global Wealth 2014
201407 Riding a Wave of Growth -´Global Wealth 2014201407 Riding a Wave of Growth -´Global Wealth 2014
201407 Riding a Wave of Growth -´Global Wealth 2014Francisco Calzado
 
Pursuing a Better Investment Experience with Capital Associates
Pursuing a Better Investment Experience with Capital AssociatesPursuing a Better Investment Experience with Capital Associates
Pursuing a Better Investment Experience with Capital Associates
RobUgiansky
 
Avant Garde Wealth Mgmt - Quarterly letter - 1409
Avant Garde Wealth Mgmt - Quarterly letter - 1409Avant Garde Wealth Mgmt - Quarterly letter - 1409
Avant Garde Wealth Mgmt - Quarterly letter - 1409Gaurav Jalan
 
PwC Global Economy Watch (nov. 2013)
PwC Global Economy Watch (nov. 2013)PwC Global Economy Watch (nov. 2013)
PwC Global Economy Watch (nov. 2013)
PwC France
 
Official EIBTM 2013 Trends Watch Report by Rob Davidson
Official EIBTM 2013 Trends Watch Report by Rob DavidsonOfficial EIBTM 2013 Trends Watch Report by Rob Davidson
Official EIBTM 2013 Trends Watch Report by Rob Davidson
Rob Davidson
 
2013.10.10 accuvest bpv-q4
2013.10.10 accuvest bpv-q42013.10.10 accuvest bpv-q4
2013.10.10 accuvest bpv-q4advisorshares
 
Blackrock 2015 outlook rpt
Blackrock 2015 outlook rptBlackrock 2015 outlook rpt
Blackrock 2015 outlook rptLance Conn
 
Credit suisse research - global-investment-returns-yearbook-2014
Credit suisse research -  global-investment-returns-yearbook-2014Credit suisse research -  global-investment-returns-yearbook-2014
Credit suisse research - global-investment-returns-yearbook-2014
Sergiy Kurbatov
 
Dealing With Divergences - Blackrock 2015 Outlook
Dealing With Divergences - Blackrock 2015 OutlookDealing With Divergences - Blackrock 2015 Outlook
Dealing With Divergences - Blackrock 2015 Outlook
João Pinto
 
EIBTM trend & research 2014
EIBTM trend & research 2014EIBTM trend & research 2014
EIBTM trend & research 2014
Lausanne Montreux Congress
 
Investment Insights June 2017
Investment Insights June 2017Investment Insights June 2017
Investment Insights June 2017
Cornerstone Wealth Management MWP
 
Investment Principles
Investment PrinciplesInvestment Principles
Investment Principles
Paul Ohanian, CFP®
 
Brave New World
Brave New WorldBrave New World
Brave New World
Tarek Fadlallah
 
Templeton Global Bond Update1009
Templeton Global Bond Update1009Templeton Global Bond Update1009
Templeton Global Bond Update1009mwkarstrom
 

Similar to WHView1Q13 (20)

Global Investment Returns Yearbook 2014
Global Investment Returns Yearbook 2014Global Investment Returns Yearbook 2014
Global Investment Returns Yearbook 2014
 
Vietnam's Recent Economic Development 2013
Vietnam's Recent Economic Development  2013Vietnam's Recent Economic Development  2013
Vietnam's Recent Economic Development 2013
 
otm-pham0914
otm-pham0914otm-pham0914
otm-pham0914
 
BCG Report - Riding a Wave of Growth
BCG Report - Riding a Wave of GrowthBCG Report - Riding a Wave of Growth
BCG Report - Riding a Wave of Growth
 
201407 Riding a Wave of Growth -´Global Wealth 2014
201407 Riding a Wave of Growth -´Global Wealth 2014201407 Riding a Wave of Growth -´Global Wealth 2014
201407 Riding a Wave of Growth -´Global Wealth 2014
 
Pursuing a Better Investment Experience with Capital Associates
Pursuing a Better Investment Experience with Capital AssociatesPursuing a Better Investment Experience with Capital Associates
Pursuing a Better Investment Experience with Capital Associates
 
Avant Garde Wealth Mgmt - Quarterly letter - 1409
Avant Garde Wealth Mgmt - Quarterly letter - 1409Avant Garde Wealth Mgmt - Quarterly letter - 1409
Avant Garde Wealth Mgmt - Quarterly letter - 1409
 
PwC Global Economy Watch (nov. 2013)
PwC Global Economy Watch (nov. 2013)PwC Global Economy Watch (nov. 2013)
PwC Global Economy Watch (nov. 2013)
 
Global economy-watch-november-2013[1]
Global economy-watch-november-2013[1]Global economy-watch-november-2013[1]
Global economy-watch-november-2013[1]
 
Official EIBTM 2013 Trends Watch Report by Rob Davidson
Official EIBTM 2013 Trends Watch Report by Rob DavidsonOfficial EIBTM 2013 Trends Watch Report by Rob Davidson
Official EIBTM 2013 Trends Watch Report by Rob Davidson
 
2013.10.10 accuvest bpv-q4
2013.10.10 accuvest bpv-q42013.10.10 accuvest bpv-q4
2013.10.10 accuvest bpv-q4
 
Blackrock 2015 outlook rpt
Blackrock 2015 outlook rptBlackrock 2015 outlook rpt
Blackrock 2015 outlook rpt
 
Credit suisse research - global-investment-returns-yearbook-2014
Credit suisse research -  global-investment-returns-yearbook-2014Credit suisse research -  global-investment-returns-yearbook-2014
Credit suisse research - global-investment-returns-yearbook-2014
 
trends & growth of fdi in india
trends & growth of fdi in indiatrends & growth of fdi in india
trends & growth of fdi in india
 
Dealing With Divergences - Blackrock 2015 Outlook
Dealing With Divergences - Blackrock 2015 OutlookDealing With Divergences - Blackrock 2015 Outlook
Dealing With Divergences - Blackrock 2015 Outlook
 
EIBTM trend & research 2014
EIBTM trend & research 2014EIBTM trend & research 2014
EIBTM trend & research 2014
 
Investment Insights June 2017
Investment Insights June 2017Investment Insights June 2017
Investment Insights June 2017
 
Investment Principles
Investment PrinciplesInvestment Principles
Investment Principles
 
Brave New World
Brave New WorldBrave New World
Brave New World
 
Templeton Global Bond Update1009
Templeton Global Bond Update1009Templeton Global Bond Update1009
Templeton Global Bond Update1009
 

WHView1Q13

  • 1. WHV in Brief • Assets under management as of March 31, 2013: $14.3 billion • Total staff as of March 31, 2013: 71 employees, 22 investment professionals Market Highlights: • Developed international equities, as measured by the EAFE index, posted another strong quarter, although the strong U.S. dollar muted those returns for U.S. based investors. In local currency terms, the EAFE returned 9.7% but the strengthening dollar reduced that to 5.1%, significantly lagging the S&P 500’s 10.6% return. • U.S. equities, particularly the smaller market cap segments, outperformed foreign equity markets, and several indices reached new all time highs. • The strong equity market rally thus far has signaled a return to equities by investors who were encouraged by hopes of a European recovery and the aversion of the fiscal cliff in the U.S. at the end of 2012. However, a strong degree of risk aversion remains, as evidenced by the leadership of the more defensive and yield oriented health care and consumer staples sectors, which posted strong returns of 11.2% and 11.5%, respectively. • Despite many concerns about austerity’s impact on what is still a fragile economic recovery, there are several macroeconomic developments that bode well for the intermediate- and perhaps long-term. These include continuing improvement in the housing market, the improved balance sheets and debt service ratios of households and the U.S. energy revolution, to name a few. Strategy Highlight: The center and pace of global economic activity has been shifting over the past several decades from the United States, Europe and Japan to the Emerging Markets with an emphasis on the Asia Pacific region. The velocity of this transition has accelerated noticeably since the late 1980’s. Just 20 years ago, emerging markets accounted for roughly 30% of global GDP on a purchasing power parity basis; in 2012, they accounted for 49%, or almost half of global GDP. The International Monetary Fund forecasts that this portion of global GDP generated by the developing world will continue to grow in the near future. Exhibit 1: GDP based on PPP, (Percent of World GDP) Advanced Econ. EM & Developed Econ. 0 10 20 30 40 50 60 70 80 1980 1982 1984 1986 1988 1990 1992 1994 1996 1998 2000 2002 2004 2006 2008 2010 2012 2014 2016 2018 First Quarter 2013 Update Volume 32 | Issue 1 Source: IMF Estimates
  • 2. While GDP estimates for many developed economies have been decelerating, and 2012 growth rates for many emerging market countries were disappointing, GDP growth for the emerging markets as a whole is expected to continue to outpace growth in the developed countries. Exhibit 2: Emerging Markets GDP Growth Continues to Outpace Developed Markets Adv. Econ. EM Dev. Econ. World -6 -4 -2 0 2 4 6 8 10 1980 1982 1984 1986 1988 1990 1992 1994 1996 1998 2000 2002 2004 2006 2008 2010 2012 2014 2016 2018 Source: IMF Estimates However, in spite of these optimistic prospects, the recent returns of emerging market equities have not been reflective of this continuing trend. WHV believes an unsustainable imbalance exists which has created a compelling investment opportunity: emerging markets account for only 14% of the world’s market capitalization of publicly traded companies. As urbanization and industrialization take hold in the developing world, the share of global market cap for emerging market companies is expected to grow as well. This will create more opportunities for investment in their capital markets. Companies within these countries are also becoming increasingly competitive with their developed market counterparts. For example, industrial production has grown faster in the emerging economies than in the developed economies for the past decade.1 As noted in the International Monetary Fund’s April 2013 Economic Outlook, “Emerging market risks have declined, growth has stabilized and external funding conditions for emerging market economies are very favorable.” The more favorable demographic trends within the emerging markets are yet another compelling reason to invest in these countries with their expanding populations and consumer consumption. With increased urbanization, millions of people around the developing world are moving to cities at an unprecedented speed and scale in search of higher paying jobs. The world’s middle class consumption is becoming increasingly driven by these emerging economies. WHV believes in investing in companies that are positioned to benefit from this growing consumer trend in the emerging economies. Exhibit 3: Spending by the Global Middle Class Sub-Saharan Africa 1% Middle East North Africa 5% North America 26% Europe 38% Central South America 7% Asia Pacific 23% 2009 Sub-Saharan Africa 1% Middle East North Africa 4%North America 10% Europe 20% Central South America 6% Asia Pacific 59% 2030E Source: OECD Factbook 2011-2012 Lastly, emerging market equity valuations are indicative of an attractive investment opportunity on both an absolute and relative basis. Exhibit 3 shows that price-to-book and price-to-earnings valuations in emerging market economies are currently cheaper relative to their historical averages. While the U.S. equity markets have had a strong run during the first quarter of 2013, investors seem to be increasingly focused on the relative attractiveness of the U.S. economy and
  • 3. capital markets compared to the other developed international markets. WHV believes that this is a short-term “sweet spot” of earnings re-acceleration and cheaper valuations in the U.S. Over the longer term, emerging markets will still continue to grow at significantly faster rates than the U.S. and other developed economies. Exhibit 5: Relative Indices Valuations As of 3/31/2012 MSCI Emerging Markets Index MSCI EAFE Index SP 500 Index P/E Forward 12 Mo. 10.5x 12.6x 13.7x P/B 1.4x 1.5x 2.3x Dividend Yield 2.8% 3.2% 2.1% 3 Year EPS Growth 14.1% 22.5% 16.9% Source: FactSet Exhibit 4: Global Equity Valuations –2.5 –2.0 –1.5 –1.0 –0.5 0.0 0.5 1.0 1.5 2.0 Cheaper Richer Maximum Minimum 2006 2007 2008 2009 2010 2011 2012 (In z-scores) 10th–90th Percentile Advanced Economies Emerging Market Economies Sources: IMF Financial Stability Report (Bloomberg L.P.; IBES; and IMF staff estimates.) Note: Based on GDP-weighted average of z-scores of price-to-book (P/B) and forward price-to-earnings (P/E) ratios. The z-scores represent the deviation from the period average expressed in the number of standard deviations. Values above zero denote richer valuations relative to historical averages, while those below zero denote cheaper valuations. P/B and P/E ratios are monthly series beginning in 1996 and 1987, respectively, or earliest available. Advanced economies include 22 countries, and emerging market economies include 17 countries. WHV believes institutional investors can take advantage of this investment opportunity by having exposure to a well diversified emerging markets equity strategy in their portfolio. A strategy that allows for diverse exposure across different countries, sectors and market-capitalizations is a sensible way to implement broad exposure to the emerging markets asset class. WHV does not guarantee the future performance of any client’s account or any specific level of performance, the success of any investment decision or strategy that we may use, or the success of our overall management of any account. Certain statements contained in this commentary are forward-looking, including those that discuss strategies, goals, outlook or other non-historical matters; or project revenues, income, returns or other financial measures. These forward-looking statements are made only as of the date on which they are made, and WHV undertakes no obligation to update or revise any forward-looking statements. 1 FactSet Economic Data
  • 4. 901 5th Avenue, Suite 3130 Seattle, WA 98164-2008 Tel: (800) 258-1388 Fax: (206) 219-2479 301 Battery Street, Suite 400 San Francisco, CA 94111-3203 Tel: (800) 204-2650 Fax: (415) 288-6153 whv.com WHV Performance Highlights1 Annualized 1Q13 1 Yr. 3 Yrs. 5 Yrs. 10 Yrs. International Equity Gross of Fees 4.01% 8.65% 5.39% 0.34% 15.81% Net of Fees 3.80% 7.78% 4.43% -0.62% 14.69% MSCI EAFE 5.13% 11.25% 5.00% -0.89% 9.69% Global Equity Gross of Fees 4.36% 9.27% 5.26% 0.88% n/a Net of Fees 4.17% 8.43% 4.31% -0.07% n/a MSCI World 7.73% 11.85% 8.46% 2.23% n/a Small Cap Equity Gross of Fees 11.76% 11.32% 11.50% 6.92% 13.85% Net of Fees 11.59% 10.63% 10.57% 5.95% 12.78% Russell 2000 12.39% 16.30% 13.45% 8.24% 11.52% Micro Cap Equity Gross of Fees 9.04% -2.46% 10.58% n/a n/a Net of Fees 8.78% -3.44% 9.48% n/a n/a Dow Jones Micro 15.03% 7.40% 12.92% n/a n/a Emerging Markets Gross of Fees -1.39% -1.28% 3.82% n/a n/a Net of Fees -1.64% -2.26% 2.79% n/a n/a MSCI Emerging -1.62% 1.96% 3.27% n/a n/a Select World Equity Gross of Fees 8.43% 9.33% 9.43% 5.42% n/a Net of Fees 8.17% 8.25% 8.35% 4.38% n/a MSCI All Country World ex 6.50% 10.55% 10.79% 5.30% n/a International Small Cap Gross of Fees 11.44% 9.40% n/a n/a n/a Net of Fees 11.17% 8.32% n/a n/a n/a MSCI All Country World ex 6.54% 10.48% n/a n/a n/a Large Cap Core Gross of Fees 8.26% 8.93% 10.51% 6.16% 8.60% Net of Fees 8.15% 8.49% 9.81% 5.42% 7.79% SP 500 10.61% 13.96% 12.67% 5.81% 8.53% 1 This information is supplemental to the GIPS-compliant presentations, which are attached.
  • 5. International Equity Composite Definition of the Firm WHV is an investment adviser, registered under the Investment Advisers Act of 1940. WHV manages a variety of equity and balanced portfolios working from offices in San Francisco and Seattle. WHV is “the firm” for purposes of determining the Total Firm Assets under management and firm-wide compliance. Registration with the SEC does not imply a certain level of skill or training. Year Ended Total Return (%) Gross of Fees Total Return (%) Net of Fees Benchmark Returns (%) Composite Dispersion (%) Ex-Post Standard Deviation (%) Number of Portfolios at End of Period Total Assets at End of Period ($ millions) Non-Fee- Paying Portfolios (% of Composite Assets) Total Firm Assets ($ millions)Composite Benchmark Y 12/31/12 15.24 14.32 17.32 1.34 22.54 19.37 413 4,091.4 0.01 13,404 Y 12/31/11 -14.82 -15.68 -12.14 1.63 25.98 22.43 446 4,006.5 n/a 13,250 Y 12/31/10 18.62 17.46 7.75 1.82 n/a n/a 404 4,335.0 n/a 15,213 Y 12/31/09 62.10 60.55 31.78 5.19 n/a n/a 415 3,371.7 n/a 12,646 Y 12/31/08 -49.17 -49.71 -43.38 2.43 n/a n/a 456 2,252.5 n/a 8,376 Y 12/31/07 44.35 42.95 11.17 3.82 n/a n/a 414 4,040.1 n/a 14,400 Y 12/31/06 23.73 22.51 26.34 4.41 n/a n/a 310 2,000.4 n/a 9,013 Y 12/31/05 40.92 39.56 13.54 4.77 n/a n/a 148 830.5 n/a 6,630 Y 12/31/04 30.20 28.93 20.25 3.19 n/a n/a 54 292.9 n/a 5,700 Y 12/31/03 29.26 28.00 38.59 6.59 n/a n/a 40 177.6 n/a 5,424 WHV Investment Management Compliance Statement WHV Investment Management (WHV) claims compliance with the Global Investment Performance Standards (GIPS®) and has prepared and presented this report in compliance with the GIPS standards. WHV has been independently verified for the periods from October 1, 1994 through December 31, 2011. Verification assesses whether (1) the firm has complied with all the composite construction requirements of the GIPS standards on a firm-wide basis and (2) the firm’s policies and procedures are designed to calculate and present performance in compliance with the GIPS standards. The International Equity composite has been examined for the periods from January 1, 1995 through December 31, 2011. The verification and performance examination reports are available upon request.
  • 6. Polices WHV’s policies for valuing portfolios, calculating performance, and preparing compliant presentations are available upon request. Composite Description The composite was created on October 31, 2004. The composite includes all non-wrap accounts, excluding mutual funds, invested in the firm’s International Equity strategy, a portfolio of international equity growth stocks that is expected to generate long-term capital appreciation. A list of composite descriptions is available upon request. Since August 2008, WHV has used the services of its affiliated sub-advisor Hirayama Investments, LLC in the management of this strategy. Minimum Account Size Currently there is no minimum asset level for inclusion in the composite. Prior to January 1, 2012, the minimum asset level for inclusion was $100,000. Prior to January 1, 2010, the minimum asset level for inclusion was $50,000. Benchmark The benchmark for the International Equity composite is the MSCI-EAFE (Net) Index, which measures the equity performance of developed markets in Europe, Australia and the Far East. Previously, the benchmark presented was the MSCI-EAFE (Gross) Index. In June 2011, the benchmark was changed for all periods since the composite’s inception to better reflect how composite returns are calculated. The returns of the benchmark are provided to represent the investment environment that existed during the time period shown and are not covered by the report of the independent verifiers. For comparison purposes, the index includes the reinvestment of income and other earnings but does not include any trading expenses, management fees or other costs. The volatility of the composite and that of the benchmark may be materially different due to varying degrees of diversification and/or other factors. A large percentage of the equity assets in the composite is invested in countries or regions not included in the benchmark. Dispersion Composite dispersion is measured by the standard deviation across returns of portfolios represented within the composite for the full period. Standard deviation is calculated on asset-weighted portfolio returns. Composite dispersion is not presented for quarterly periods or for years where the composite consisted of five or fewer accounts as it is not considered statistically meaningful. Ex-post standard deviation is the annualized standard deviation of monthly returns for the trailing 36 months of both the composite and benchmark. Returns and Fees Returns reflect the deduction of all trading expenses and the reinvestment of dividends and other earnings. Gross returns do not reflect the deduction of investment advisory fees or any other expenses that may be incurred in the management of the account. Net returns are net of model investment advisory fees in effect for the respective time period. Actual fees may vary depending on, among other things, the applicable fee schedule and portfolio size. Further, the impact of management fees over time may be different from the actual management fees used in the calculation during periods of significant volatility. WHV’s investment advisory fees are described in Form ADV Part II. Valuations and returns are computed and stated in U.S. dollars. Past performance is not a guarantee of future results. The Management Fee Schedule is as follows: Incremental Annual Fee Rate as a Percentage of Market Value First $10 million @ 1.00% | Next $15 million @ 0.80% | Next $25 million @ 0.75% | Next $50 million @ 0.60% | All over $100 million @ 0.50% 901 5th Avenue, Suite 3130 Seattle, WA 98164-2008 Tel: (800) 258-1388 Fax: (206) 219-2479 301 Battery Street, Suite 400 San Francisco, CA 94111-3203 Tel: (800) 204-2650 Fax: (415) 288-6153 whv.com
  • 7. Global Equity Composite WHV Investment Management Definition of the Firm WHV is an investment adviser, registered under the Investment Advisers Act of 1940. WHV manages a variety of equity and balanced portfolios working from offices in San Francisco and Seattle. WHV is “the firm” for purposes of determining the Total Firm Assets under management and firm-wide compliance. Registration with the SEC does not imply a certain level of skill or training. Year Ended Total Return (%) Gross of Fees Total Return (%) Net of Fees Benchmark Returns (%) Composite Dispersion (%) Ex-Post Standard Deviation (%) Number of Portfolios at End of Period Total Assets at End of Period ($ millions) Total Firm Assets ($ millions)Composite Benchmark Y 12/31/12 14.92 14.03 15.83 1.21 22.68 16.74 80 578.6 13,404 Y 12/31/11 -15.22 -16.08 -5.54 1.45 25.93 20.15 102 553.2 13,250 Y 12/31/10 17.96 16.80 11.76 2.12 n/a n/a 91 372.9 15,213 Y 12/31/09 62.92 61.36 29.99 5.69 n/a n/a 80 296.2 12,646 Y 12/31/08 -48.26 -48.80 -40.71 2.17 n/a n/a 67 124.1 8,376 Y 12/31/07 44.94 43.54 9.04 n/m n/a n/a 23 128.7 14,400 Y 12/31/06 23.28 22.07 20.07 n/m n/a n/a 3 40.2 9,013 Y 12/31/05^ 9.63 9.45 5.62 n/m n/a n/a 1 27.9 6,630 ^ Returns are for the period from 11/01/2005 through 12/31/2005 Compliance Statement WHV Investment Management (WHV) claims compliance with the Global Investment Performance Standards (GIPS®) and has prepared and presented this report in compliance with the GIPS standards. WHV has been independently verified for the periods from October 1, 1994 through December 31, 2011. Verification assesses whether (1) the firm has complied with all the composite construction requirements of the GIPS standards on a firm-wide basis and (2) the firm’s policies and procedures are designed to calculate and present performance in compliance with the GIPS standards. The Global Equity composite has been examined for the periods from November 1, 2005 through December 31, 2011. The verification and performance examination reports are available upon request.
  • 8. Polices WHV’s policies for valuing portfolios, calculating performance, and preparing compliant presentations are available upon request. Composite Description The composite was created on October 31, 2005. The composite includes all non-wrap accounts invested in the firm’s Global Equity strategy, a portfolio of international and U.S. companies that are industry leaders in the global marketplace. The strategy seeks to identify stocks of companies that are poised for long-term growth and have the potential to sustain a high growth rate in regions and countries around the world. A list of composite descriptions is available upon request. Since August 2008, WHV has used the services of its affiliated sub-advisor Hirayama Investments, LLC in the management of this strategy. Minimum Account Size Currently there is no minimum asset level for inclusion in the composite. Prior to January 1, 2012, the minimum asset level for inclusion was $100,000. Prior to January 1, 2010, the minimum asset level for inclusion was $50,000. Benchmark The benchmark for the Global Equity composite is the MSCI World (Net) Index which measures the equity market performance of 24 developed countries. Previously, the benchmark presented was the MSCI World (Gross) Index. In June 2011, the benchmark was changed for all periods since the composite’s inception to better reflect how composite returns are calculated. The returns of the benchmark are provided to represent the investment environment that existed during the time period shown and are not covered by the report of the independent verifiers. For comparison purposes, the index includes the reinvestment of income and other earnings but does not include any trading expenses, management fees or other costs. The volatility of the composite and that of the benchmark may be materially different due to varying degrees of diversification and/or other factors. A large percentage of the equity assets in the composite is invested in countries or regions not included in the benchmark. Dispersion Composite dispersion is measured by the standard deviation across returns of all portfolios represented within the composite for the full period. Standard deviation is calculated on asset-weighted portfolio returns. Composite dispersion is not presented for quarterly periods or for years where the composite consists of five or fewer accounts as it is not considered statistically meaningful. Ex-post standard deviation is the annualized standard deviation of monthly returns for the trailing 36 months of both the composite and benchmark. Returns and Fees Returns reflect the deduction of all trading expenses and the reinvestment of dividends and other earnings. Gross returns do not reflect the deduction of investment advisory fees or any other expenses that may be incurred in the management of the account. Net returns are net of model investment advisory fees in effect for the respective time period. Actual fees may vary depending on, among other things, the applicable fee schedule and portfolio size. Further, the impact of management fees over time may be different from the actual management fees used in the calculation during periods of significant volatility. WHV’s investment advisory fees are described in Form ADV Part II. Valuations and returns are computed and stated in U.S. dollars. Past performance is not a guarantee of future results. The Management Fee Schedule is as follows: Incremental Annual Fee Rate as a Percentage of Market Value First $10 million @ 1.00% | Next $15 million @ .80% | Next $25 million @ .75% | Next $50 million @ .60% | All over $100 million @ .50% 901 5th Avenue, Suite 3130 Seattle, WA 98164-2008 Tel: (800) 258-1388 Fax:(206) 219-2479 301 Battery Street, Suite 400 San Francisco, CA 94111-3203 Tel: (800) 204-2650 Fax:(415) 288-6153 whv.com
  • 9. Small Cap Equity Composite WHV Investment Management Definition of the Firm WHV is an investment adviser, registered under the Investment Advisers Act of 1940. WHV manages a variety of equity and balanced portfolios working from offices in San Francisco and Seattle. WHV is “the firm” for purposes of determining the Total Firm Assets under management and firm-wide compliance. Registration with the SEC does not imply a certain level of skill or training. Year Ended Total Return (%) Gross of Fees Total Return (%) Net of Fees Benchmark Returns (%) Composite Dispersion (%) Ex-Post Standard Deviation (%) Number of Portfolios at End of Period Total Assets at End of Period ($ millions) Total Firm Assets ($ millions)Composite Benchmark Y 12/31/12 13.33 12.63 16.35 1.10 22.16 20.20 31 1,295.2 13,404 Y 12/31/11 -7.06 -7.99 -4.18 0.69 28.24 24.99 33 1,174.0 13,250 Y 12/31/10 26.40 25.16 26.85 0.93 n/a n/a 35 1,165.5 15,213 Y 12/31/09 53.82 52.34 27.17 1.36 n/a n/a 43 1,057.8 12,646 Y 12/31/08 -43.46 -44.06 -33.79 0.65 n/a n/a 47 713.9 8,376 Y 12/31/07 12.82 11.71 -1.57 1.78 n/a n/a 47 1,374.7 14,400 Y 12/31/06 16.88 15.73 18.37 0.75 n/a n/a 51 1,283.0 9,013 Y 12/31/05 16.48 15.33 4.55 4.13 n/a n/a 51 1,027.0 6,630 Y 12/31/04 20.36 19.18 18.33 2.56 n/a n/a 43 727.9 5,700 Y 12/31/03 47.78 46.36 47.25 2.51 n/a n/a 37 598.2 5,424 Compliance Statement WHV Investment Management (WHV) claims compliance with the Global Investment Performance Standards (GIPS®) and has prepared and presented this report in compliance with the GIPS standards. WHV has been independently verified for the periods from October 1, 1994 through December 31, 2011. Verification assesses whether (1) the firm has complied with all the composite construction requirements of the GIPS standards on a firm-wide basis and (2) the firm’s policies and procedures are designed to calculate and present performance in compliance with the GIPS standards. The Small Cap Equity composite has been examined for the periods from January 1, 2000 through December 31, 2011. The verification and performance examination reports are available upon request.
  • 10. Polices WHV’s policies for valuing portfolios, calculating performance, and preparing compliant presentations are available upon request. Composite Description The composite was created on October 31, 2004. The composite includes all non-wrap accounts invested in the firm’s Small Cap Equity strategy. The Small Cap Equity strategy is a diversified portfolio of companies having, at the time of purchase, a minimum market cap of the lower bound and a maximum cap of the upper bound of the market cap range of the Russell 2000® Index, as of that index’s most recent reconstitution. Securities eligible for purchase shall be marketable with quotations available on recognized exchanges. The investment style can be defined as GARP- oriented (growth at a reasonable rate). A list of composite descriptions is available upon request. Minimum Account Size Currently, there is no minimum asset level for inclusion in the composite. Prior to January 1, 2012, the minimum asset level for inclusion was $100,000. Prior to January 1, 2010, the minimum asset level for inclusion was $50,000. Benchmark The benchmark for the Small Cap Equity strategy is the Russell 2000® Index, which measures the performance of the small cap segment of the U.S. equity universe. The returns of the benchmark are provided to represent the investment environment that existed during the time period shown and are not covered by the report of the independent verifiers. For comparison purposes, the index includes the reinvestment of income and other earnings but does not include any trading expenses, management fees or other costs. The volatility of the composite and that of the benchmark may be materially different due to varying degrees of diversification and/or other factors. Dispersion Composite dispersion is measured by the standard deviation across returns of portfolios represented within the composite for the full period. Standard deviation is calculated on asset-weighted portfolio returns. Composite dispersion is not presented for quarterly periods or for years where the composite consisted of five or fewer accounts as it is not considered statistically meaningful. Ex-post standard deviation is the annualized standard deviation of monthly returns for the trailing 36 months of both the composite and benchmark. Returns and Fees Returns reflect the deduction of all trading expenses and the reinvestment of dividends and other earnings. Gross returns do not reflect the deduction of investment advisory fees or any other expenses that may be incurred in the management of the account. Net returns are net of model investment advisory fees in effect for the respective time period. Actual fees may vary depending on, among other things, the applicable fee schedule and portfolio size. Further, the impact of management fees over time may be different from the actual management fees used in the calculation during periods of significant volatility. WHV’s investment advisory fees are described in Form ADV Part II. Valuations and returns are computed and stated in U.S. dollars. Past performance is not a guarantee of future results. The Management Fee Schedule is as follows: Incremental Annual Fee Rate as a Percentage of Market Value First $10 million @ 1.00% | Next $15 million @ .80% | Next $25 million @ .75% | Next $50 million @ .60% | All over $100 million @ .50% 901 5th Avenue, Suite 3130 Seattle, WA 98164-2008 Tel: (800) 258-1388 Fax:(206) 219-2479 301 Battery Street, Suite 400 San Francisco, CA 94111-3203 Tel: (800) 204-2650 Fax:(415) 288-6153 whv.com
  • 11. Micro Cap Equity Composite WHV Investment Management Definition of the Firm WHV is an investment adviser, registered under the Investment Advisers Act of 1940. WHV manages a variety of equity and balanced portfolios working from offices in San Francisco and Seattle. WHV is “the firm” for purposes of determining the Total Firm Assets under management and firm-wide compliance. Registration with the SEC does not imply a certain level of skill or training. Year Ended Total Return (%) Gross of Fees Total Return (%) Net of Fees Benchmark Returns (%) Composite Dispersion (%) Ex-Post Standard Deviation (%) Number of Portfolios at End of Period Total Assets at End of Period ($ millions) Non-Fee- Paying Portfolios (% of Composite Assets) Total Firm Assets ($ millions)Composite Benchmark Y 12/31/12 12.90 11.79 21.11 n/m 26.06 20.23 5 6.6 79 13,404 Y 12/31/11 -11.29 -12.18 -11.33 n/m 34.60 25.51 5 6.4 n/a 13,250 Y 12/31/10 40.88 39.51 30.08 n/m n/a n/a 3 6.0 n/a 15,213 Y 12/31/09 141.62 139.37 46.62 n/m n/a n/a 3 6.0 n/a 12,646 Y 12/31/08^ 4.56 4.48 1.92 n/m n/a n/a 2 2.1 n/a 8,376 ^ Returns are for the period from 12/01/2008 through 12/31/2008. Compliance Statement WHV Investment Management (WHV) claims compliance with the Global Investment Performance Standards (GIPS®) and has prepared and presented this report in compliance with the GIPS standards. WHV has been independently verified for the periods from October 1, 1994 through December 31, 2011. Verification assesses whether (1) the firm has complied with all the composite construction requirements of the GIPS standards on a firm-wide basis and (2) the firm’s policies and procedures are designed to calculate and present performance in compliance with the GIPS standards. The Micro Cap Equity composite has been examined for the periods from December 1, 2008 through December 31, 2011. The verification and performance examination reports are available upon request.
  • 12. Polices WHV’s policies for valuing portfolios, calculating performance, and preparing compliant presentations are available upon request. Composite Description The composite was created on November 30, 2008. The composite includes all non-wrap accounts invested in the firm’s Micro Cap Equity strategy, a portfolio of equity securities with market capitalization between $10 million and $500 million upon purchase that seeks to generate long-term capital appreciation. A list of composite descriptions is available upon request. Minimum Account Size Currently, there is no minimum asset level for inclusion in the composite. Prior to January 1, 2012, the minimum asset level for inclusion was $100,000. Prior to January 1, 2010, the minimum asset level for was $50,000. Benchmark The benchmark for the Micro Cap Equity composite is the Dow Jones U.S. Micro-Cap Total Stock Market Index� which is comprised of stocks with market capitalization rankings ranked below 2,501 and below within the Dow Jones U.S. Total Stock Market Index�. The returns of the benchmark are provided to represent the investment environment that existed during the time period shown and are not covered by the report of the independent verifiers. For comparison purposes, the index includes the reinvestment of income and other earnings but does not include any trading expenses, management fees or other costs. The volatility of the composite and that of the benchmark may be materially different due to varying degrees of diversification and/or other factors. Dispersion Composite dispersion is measured by the standard deviation across returns of portfolios represented within the composite for the full period. Standard deviation is calculated on asset-weighted portfolio returns. Composite dispersion is not presented for quarterly periods or for years where the composite consisted of five or fewer accounts as it is not considered statistically meaningful. Ex-post standard deviation is the annualized standard deviation of monthly returns for the trailing 36 months of both the composite and benchmark. Returns and Fees Returns reflect the deduction of all trading expenses and the reinvestment of dividends and other earnings. Gross returns do not reflect the deduction of investment advisory fees or any other expenses that may be incurred in the management of the account. Net returns are net of model investment advisory fees in effect for the respective time period. Actual fees may vary depending on, among other things, the applicable fee schedule and portfolio size. Further, the impact of management fees over time may be different from the actual management fees used in the calculation during periods of significant volatility. WHV’s investment advisory fees are described in Form ADV Part II. Valuations and returns are computed and stated in U.S. dollars. Past performance is not a guarantee of future results. The Management Fee Schedule is as follows: 1.00% Annual Fee Rate as a Percentage of Market Value + Performance Fee 901 5th Avenue, Suite 3130 Seattle, WA 98164-2008 Tel: (800) 258-1388 Fax: (206) 219-2479 301 Battery Street, Suite 400 San Francisco, CA 94111-3203 Tel: (800) 204-2650 Fax: (415) 288-6153 whv.com
  • 13. Emerging Markets Equity Composite WHV Investment Management Definition of the Firm WHV is an investment adviser, registered under the Investment Advisers Act of 1940. WHV manages a variety of equity and balanced portfolios working from offices in San Francisco and Seattle. WHV is “the firm” for purposes of determining the Total Firm Assets under management and firm-wide compliance. Registration with the SEC does not imply a certain level of skill or training. Year Ended Total Return (%) Gross of Fees Total Return (%) Net of Fees Benchmark Returns (%) Composite Dispersion (%) Ex-Post Standard Deviation (%) Number of Portfolios at End of Period Total Assets at End of Period ($ millions) Total Firm Assets ($ millions)Composite Benchmark Y 12/31/12 17.27 16.12 18.22 n/m 23.91 21.50 2 10.5 13,404 Y 12/31/11 -18.76 -19.59 -18.42 n/m n/a n/a 2 9.0 13,250 Y 12/31/10 19.74 18.56 18.88 n/m n/a n/a 2 11.2 15,213 Y 12/31/09^ 29.90 29.27 31.24 n/m n/a n/a 1 2.5 12,646 ^ Returns are for the period from 7/1/2009 through 12/31/2009. Compliance Statement WHV Investment Management (WHV) claims compliance with the Global Investment Performance Standards (GIPS®) and has prepared and presented this report in compliance with the GIPS standards. WHV has been independently verified for the periods from October 1, 1994 through December 31, 2011. Verification assesses whether (1) the firm has complied with all the composite construction requirements of the GIPS standards on a firm-wide basis and (2) the firm’s policies and procedures are designed to calculate and present performance in compliance with the GIPS standards. The Emerging Markets Equity composite has been examined for the periods from July 1, 2009 through December 31, 2011. The verification and performance examination reports are available upon request.
  • 14. Polices WHV’s policies for valuing portfolios, calculating performance, and preparing compliant presentations are available upon request. Composite Description The composite was created on June 1, 2009. The composite includes all non-wrap accounts, excluding mutual funds, invested in the firm’s Emerging Markets Equity strategy. The strategy seeks to generate long-term capital appreciation by investing in international companies in countries that are in the process of rapid growth and industrialization. A list of composite descriptions is available upon request. Minimum Account Size Currently there is no minimum asset level for inclusion in the composite. Prior to January 1, 2012, the minimum asset level for inclusion was $100,000. Prior to January 1, 2010, the minimum asset level for inclusion was $50,000. Benchmark The benchmark for the Emerging Markets Equity composite is the MSCI Emerging Markets (Net) Index, which measures the equity market performance of 21 emerging market countries. The returns of the benchmark are provided to represent the investment environment that existed during the time period shown and are not covered by the report of the independent verifiers. For comparison purposes, the index includes the reinvestment of income and other earnings but does not include any trading expenses, management fees or other costs. The volatility of the composite and that of the benchmark may be materially different due to varying degrees of diversification and/or other factors. A large percentage of the equity assets in the composite is invested in countries or regions not included in the benchmark. Dispersion Composite dispersion is measured by the standard deviation across returns of all portfolios represented within the composite for the full period. Standard deviation is calculated on asset-weighted portfolio returns. Composite dispersion is not presented for quarterly periods or for years where the composite consisted of five or fewer accounts as it is not considered statistically meaningful. Three-year annualized ex-post standard deviation is not presented because the composite does not have 36 monthly returns as of December 31, 2011. Returns and Fees Returns reflect the deduction of all trading expenses and the reinvestment of dividends and other earnings. Gross returns do not reflect the deduction of investment advisory fees or any other expenses that may be incurred in the management of the account. Net returns are net of model investment advisory fees in effect for the respective time period. Actual fees may vary depending on, among other things, the applicable fee schedule and portfolio size. Further, the impact of management fees over time may be different from the actual management fees used in the calculation during periods of significant volatility. WHV’s investment advisory fees are described in Form ADV Part II. Valuations and returns are computed and stated in U.S. dollars. Past performance is not a guarantee of future results. The Management Fee Schedule is as follows: Incremental Annual Fee Rate as a Percentage of Market Value First $10 million @ 1.00% | Next $15 million @ .80% | Next $25 million @ .75% | Next $50 million @ .60% | All over $100 million @ .50% 901 5th Avenue, Suite 3130 Seattle, WA 98164-2008 Tel: (800) 258-1388 Fax:(206) 219-2479 301 Battery Street, Suite 400 San Francisco, CA 94111-3203 Tel: (800) 204-2650 Fax:(415) 288-6153 whv.com
  • 15. International Small Cap Equity Composite WHV Investment Management Year Ended Total Return (%) Gross of Fees Total Return (%) Net of Fees Benchmark Returns (%) Composite Dispersion (%) Number of Portfolios at End of Period Total Assets at End of Period ($ millions) Total Firm Assets ($ millions) Y 12/31/12^ -1.83 -2.57 3.70 n/m 1 1.9 13,404 ^ Returns are for the period from 4/1/2012 through 12/31/2012. Compliance Statement WHV Investment Management (WHV) claims compliance with the Global Investment Performance Standards (GIPS®) and has prepared and presented this report in compliance with the GIPS standards. WHV has been independently verified for the periods from October 1, 1994 through December 31, 2011. The verification reports are available upon request. Verification assesses whether (1) the firm has complied with all the composite construction requirements of the GIPS standards on a firm-wide basis and (2) the firm’s policies and procedures are designed to calculate and present performance in compliance with the GIPS standards. Verification does not ensure the accuracy of any specific composite presentation. Definition of the Firm WHV is an investment adviser, registered under the Investment Advisers Act of 1940. WHV manages a variety of equity and balanced portfolios working from offices in San Francisco and Seattle. WHV is “the firm” for purposes of determining the Total Firm Assets under management and firm-wide compliance. Registration with the SEC does not imply a certain level of skill or training. Policies WHV’s policies for valuing portfolios, calculating performance, and preparing compliant presentations are available upon request.
  • 16. Composite Description The composite was created on March 19, 2012. The composite includes all non-wrap accounts invested in the firm’s International Small Cap Equity strategy, a portfolio of primarily small cap growth stocks domiciled in international developed and emerging markets countries. The portfolio invests in foreign equity securities, U.S. dollar denominated equity securities, depository receipts such as Global Depository Receipts and American Depository Receipts, and Non-Voting Depository Receipts. A list of composite descriptions is available upon request. Benchmark The benchmark for the International Small Cap Equity composite is the MSCI ACWI Ex-USA Small Cap (Net) Index, which measures the performance of small cap stocks of 23 developed countries and 21 emerging markets countries. The returns of the benchmark are provided to represent the investment environment that existed during the time period shown. For comparison purposes, the index includes the reinvestment of income and other earnings but does not include any trading expenses, management fees or other costs. The volatility of the composite and that of the benchmark may be materially different due to varying degrees of diversification and/or other factors. Dispersion Composite dispersion is measured by the standard deviation across returns of all portfolios represented within the composite for the full period. Standard deviation is calculated on asset-weighted portfolio returns. Composite dispersion is not presented for quarterly periods or for years where the composite consisted of five or fewer accounts as it is not considered statistically meaningful. Three-year annualized ex-post standard deviation is not presented because the composite does not have 36 monthly returns as of December 31, 2012. Returns and Fees Returns reflect the deduction of all trading expenses and the reinvestment of dividends and other earnings. Gross returns do not reflect the deduction of investment advisory fees or any other expenses that may be incurred in the management of the account. Net returns are net of model investment advisory fees in effect for the respective time period. Actual fees may vary depending on, among other things, the applicable fee schedule and portfolio size. Further, the impact of management fees over time may be different from the actual management fees used in the calculation during periods of significant volatility. WHV’s investment advisory fees are described in Form ADV Part II. Valuations and returns are computed and stated in U.S. dollars. Past performance is not a guarantee of future results. The management fee schedule is as follows: Incremental Annual Fee Rate as a Percentage of Market Value First $50 million @ 1.00% | Next $50 million @ .80% | Next $100 million @ .70% | Fees for assets over $200 million are negotiable. 301 Battery Street, Suite 400 San Francisco, CA 94111-3203 Tel: (800) 204-2650 Fax:(415) 288-6153 whv.com 901 5th Avenue, Suite 3130 Seattle, WA 98164-2008 Tel: (800) 258-1388 Fax:(206) 219-2479
  • 17. Select World Equity Composite WHV Investment Management Definition of the Firm WHV is an investment adviser, registered under the Investment Advisers Act of 1940. WHV manages a variety of equity and balanced portfolios working from offices in San Francisco and Seattle. WHV is “the firm” for purposes of determining the Total Firm Assets under management and firm-wide compliance. Registration with the SEC does not imply a certain level of skill or training. Year Ended Total Return (%) Gross of Fees Total Return (%) Net of Fees Benchmark Returns (%) Composite Dispersion (%) Ex-Post Standard Deviation (%) Number of Portfolios at End of Period Total Assets at End of Period ($ millions) Total Firm Assets ($ millions)Composite Benchmark Y 12/31/12 16.46 15.32 16.13 0.72 20.02 16.94 9 19.2 13,404 Y 12/31/11 -4.70 -5.62 -1.20 1.26 21.81 20.16 11 18.4 13,250 Y 12/31/10 15.39 14.25 17.96 0.82 n/a n/a 13 24.3 15,213 Y 12/31/09 41.69 40.32 29.59 0.90 n/a n/a 11 20.8 12,646 Y 12/31/08 -38.98 -39.61 -37.13 0.87 n/a n/a 13 16.0 8,376 Y 12/31/07 15.79 14.65 5.88 n/m n/a n/a 4 5.6 14,400 Y 12/31/06^ 6.81 5.92 11.44 n/m n/a n/a 3 4.0 9,013 ^ Returns are for the period from 3/1/2006 through 12/31/2006. Compliance Statement WHV Investment Management (WHV) claims compliance with the Global Investment Performance Standards (GIPS®) and has prepared and presented this report in compliance with the GIPS standards. WHV has been independently verified for the periods from October 1, 1994 through December 31, 2011. The verification reports are available upon request. Verification assesses whether (1) the firm has complied with all the composite construction requirements of the GIPS standards on a firm-wide basis and (2) the firm’s policies and procedures are designed to calculate and present performance in compliance with the GIPS standards. Verification does not ensure the accuracy of any specific composite presentation.
  • 18. Polices WHV’s policies for valuing portfolios, calculating performance, and preparing compliant presentations are available upon request. Composite Description The composite was created on February 28, 2006. The composite includes all non-wrap accounts invested in the firm’s Select World Equity strategy, formerly called All Cap Plus International Equity strategy. The strategy, which encompasses multiple distinct equity strategies, was redefined effective January 1, 2012 with the addition of emerging markets to large cap core, mid cap, small cap, and international strategies. A list of composite descriptions is available upon request. Minimum Account Size Currently, there is no minimum asset level for inclusion in the composite. Prior to January 1, 2012, the minimum asset level for inclusion was $100,000. Prior to January 1, 2010, the minimum asset level for inclusion was $50,000. Benchmark The design of this strategy which combines several distinct equity strategies, permits changing the mix from time to time. Prior to January 2012, the strategy combined 55% large cap core, 20% mid cap, 12.5% small cap, and 12.5% international equities and was benchmarked against corresponding weightings of the SP 500® , SP MidCap 400® , Russell 2000® , and MSCI EAFE (Gross) indices. Beginning January 2012, with the addition of emerging markets, the benchmark for the strategy was changed to the MSCI ACWI (Net) index which measures the equity market performance of 24 developed and 21 emerging market countries. The benchmark is weighted monthly. The returns of the benchmark are provided to represent the investment environment that existed during the time period shown. For comparison purposes, the index includes the reinvestment of income and other earnings but does not include any trading expenses, management fees or other costs. The volatility of the composite and that of the benchmark may be materially different due to varying degrees of diversification and/or other factors. Dispersion Composite dispersion is measured by the standard deviation across returns of all portfolios represented within the composite for the full period. Standard deviation is calculated on asset-weighted portfolio returns. Composite dispersion is not presented for quarterly periods or for years where the composite consisted of five or fewer accounts as it is not considered statistically meaningful. Ex-post standard deviation is the annualized standard deviation of monthly returns for the trailing 36 months of both the composite and benchmark. Returns and Fees Returns reflect the deduction of all trading expenses and the reinvestment of dividends and other earnings. Gross returns do not reflect the deduction of investment advisory fees or any other expenses that may be incurred in the management of the account. Net returns are net of model investment advisory fees in effect for the respective time period. Actual fees may vary depending on, among other things, the applicable fee schedule and portfolio size. Further, the impact of management fees over time may be different from the actual management fees used in the calculation during periods of significant volatility. WHV’s investment advisory fees are described in Form ADV Part II. Valuations and returns are computed and stated in U.S. dollars. Past performance is not a guarantee of future results. The Management Fee Schedule is as follows: Incremental Annual Fee Rate as a Percentage of Market Value First $10 million @ 1.00% | Next $15 million @ 0.80% | Next $25 million @ 0.75% | Next $50 million @ 0.60% | All over $100 million @ 0.50% 901 5th Avenue, Suite 3130 Seattle, WA 98164-2008 Tel: (800) 258-1388 Fax:(206) 219-2479 301 Battery Street, Suite 400 San Francisco, CA 94111-3203 Tel: (800) 204-2650 Fax:(415) 288-6153 whv.com
  • 19. Large Cap Core Equity Composite WHV Investment Management Definition of the Firm WHV is an investment adviser, registered under the Investment Advisers Act of 1940. WHV manages a variety of equity and balanced portfolios working from offices in San Francisco and Seattle. WHV is “the firm” for purposes of determining the Total Firm Assets under management and firm-wide compliance. Registration with the SEC does not imply a certain level of skill or training. Year Ended Total Return (%) Gross of Fees Total Return (%) Net of Fees Benchmark Returns (%) Composite Dispersion (%) Ex-Post Standard Deviation (%) Number of Portfolios at End of Period Total Assets at End of Period ($ millions) Total Firm Assets ($ millions)Composite Benchmark Y 12/31/12 16.80 16.32 16.00 0.20 19.46 15.09 11 305.4 13,404 Y 12/31/11 -2.53 -3.31 2.11 0.79 21.47 18.71 6 261.6 13,250 Y 12/31/10 13.79 12.89 15.06 0.46 n/a n/a 6 373.2 15,213 Y 12/31/09 34.51 33.46 26.46 0.39 n/a n/a 8 420.2 12,646 Y 12/31/08 -34.58 -35.12 -37.00 0.37 n/a n/a 9 314.6 8,376 Y 12/31/07 6.41 5.56 5.49 0.22 n/a n/a 9 500.6 14,400 Y 12/31/06 7.34 6.48 15.79 0.25 n/a n/a 12 555.4 9,013 Y 12/31/05 9.50 8.63 4.91 1.26 n/a n/a 14 512.0 6,630 Y 12/31/04 12.49 11.60 10.88 0.80 n/a n/a 14 457.8 5,700 Y 12/31/03 26.35 25.36 28.68 0.93 n/a n/a 10 380.9 5,424 For Tax-Exempt Accounts Compliance Statement WHV Investment Management (WHV) claims compliance with the Global Investment Performance Standards (GIPS®) and has prepared and presented this report in compliance with the GIPS standards. WHV has been independently verified for the periods from October 1, 1994 through December 31, 2011. Verification assesses whether (1) the firm has complied with all the composite construction requirements of the GIPS standards on a firm-wide basis and (2) the firm’s policies and procedures are designed to calculate and present performance in compliance with the GIPS standards. The Large Cap Core Equity composite has been examined for the periods from January 1, 2000 through December 31, 2011. The verification and performance examination reports are available upon request.
  • 20. Polices WHV’s policies for valuing portfolios, calculating performance, and preparing compliant presentations are available upon request. Composite Description The composite was created on October 31, 2004. The composite includes all non-wrap, tax-exempt accounts invested in the firm’s Large Cap Core Equity strategy. The Large Cap Core Equity strategy is a high quality, focused portfolio of domestic, large cap, GARP-oriented (growth at a reasonable price) stocks expected to generate above- benchmark returns over a market cycle. A list of composite descriptions is available upon request. Minimum Account Size Currently, there is no minimum asset level for inclusion in the composite. Prior to January 1, 2012, the minimum asset level for inclusion was $2,000,000. Benchmark The benchmark for the Large Cap Core Equity composite is SP 500® Index. The returns of the benchmark are provided to represent the investment environment that existed during the time period shown and are not covered by the report of the independent verifiers. For comparison purposes, the index includes the reinvestment of income and other earnings but does not include any trading expenses, management fees or other costs. The volatility of the composite and that of the benchmark may be materially different due to varying degrees of diversification and/or other factors. Dispersion Composite dispersion is measured by the standard deviation across returns of all portfolios represented within the composite for the full period. Standard deviation is calculated on asset-weighted portfolio returns. Composite dispersion is not presented for quarterly periods or for years where the composite consists of five or fewer accounts as it is not considered statistically meaningful. Ex-post standard deviation is the annualized standard deviation of monthly returns for the trailing 36 months of both the composite and benchmark. Returns and Fees Returns reflect the deduction of all trading expenses and the reinvestment of dividends and other earnings. Gross returns do not reflect the deduction of investment advisory fees or any other expenses that may be incurred in the management of the account. Net returns are net of model investment advisory fees in effect for the respective time period. Actual fees may vary depending on, among other things, the applicable fee schedule and portfolio size. Further, the impact of management fees over time may be different from the actual management fees used in the calculation during periods of significant volatility. WHV’s investment advisory fees are described in Form ADV Part II. Valuations and returns are computed and stated in U.S. dollars. Past performance is not a guarantee of future results. The Management Fee Schedule is as follows: Incremental Annual Fee Rate as a Percentage of Market Value First $2 million @ .80% | Next $8 million @ 0.60% | Next $10 million @ 0.50% | Next $10 million @ 0.40% | All over $30 million @ 0.30% 901 5th Avenue, Suite 3130 Seattle, WA 98164-2008 Tel: (800) 258-1388 Fax: (206) 219-2479 301 Battery Street, Suite 400 San Francisco, CA 94111-3203 Tel: (800) 204-2650 Fax: (415) 288-6153 whv.com