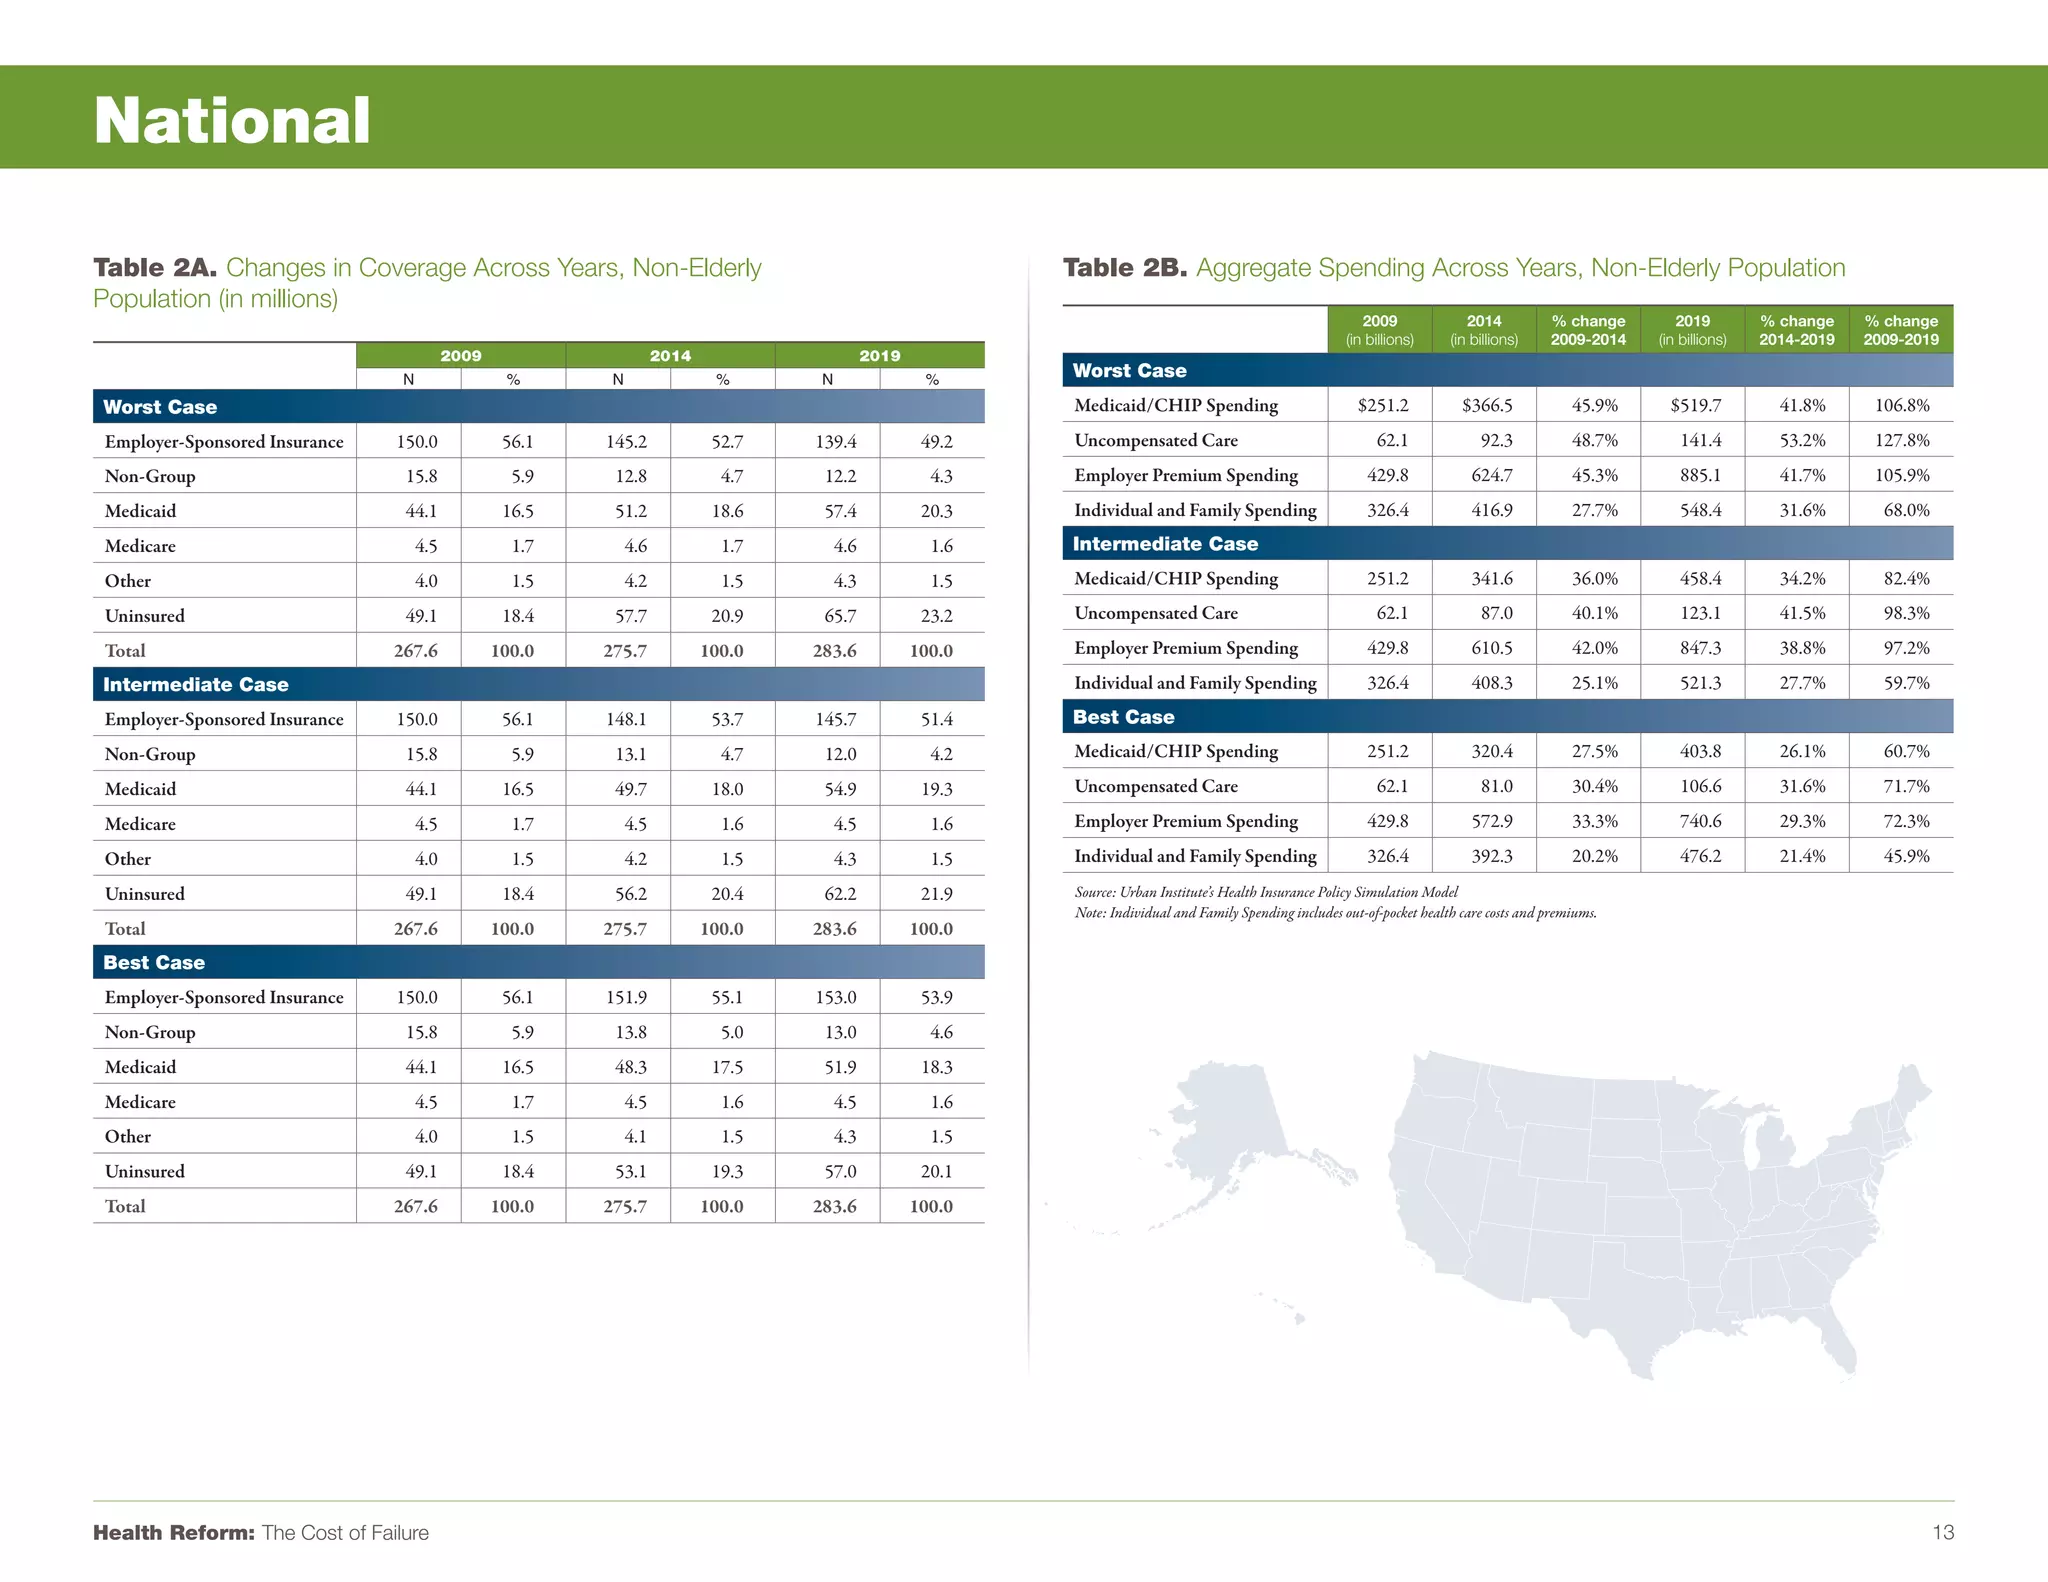
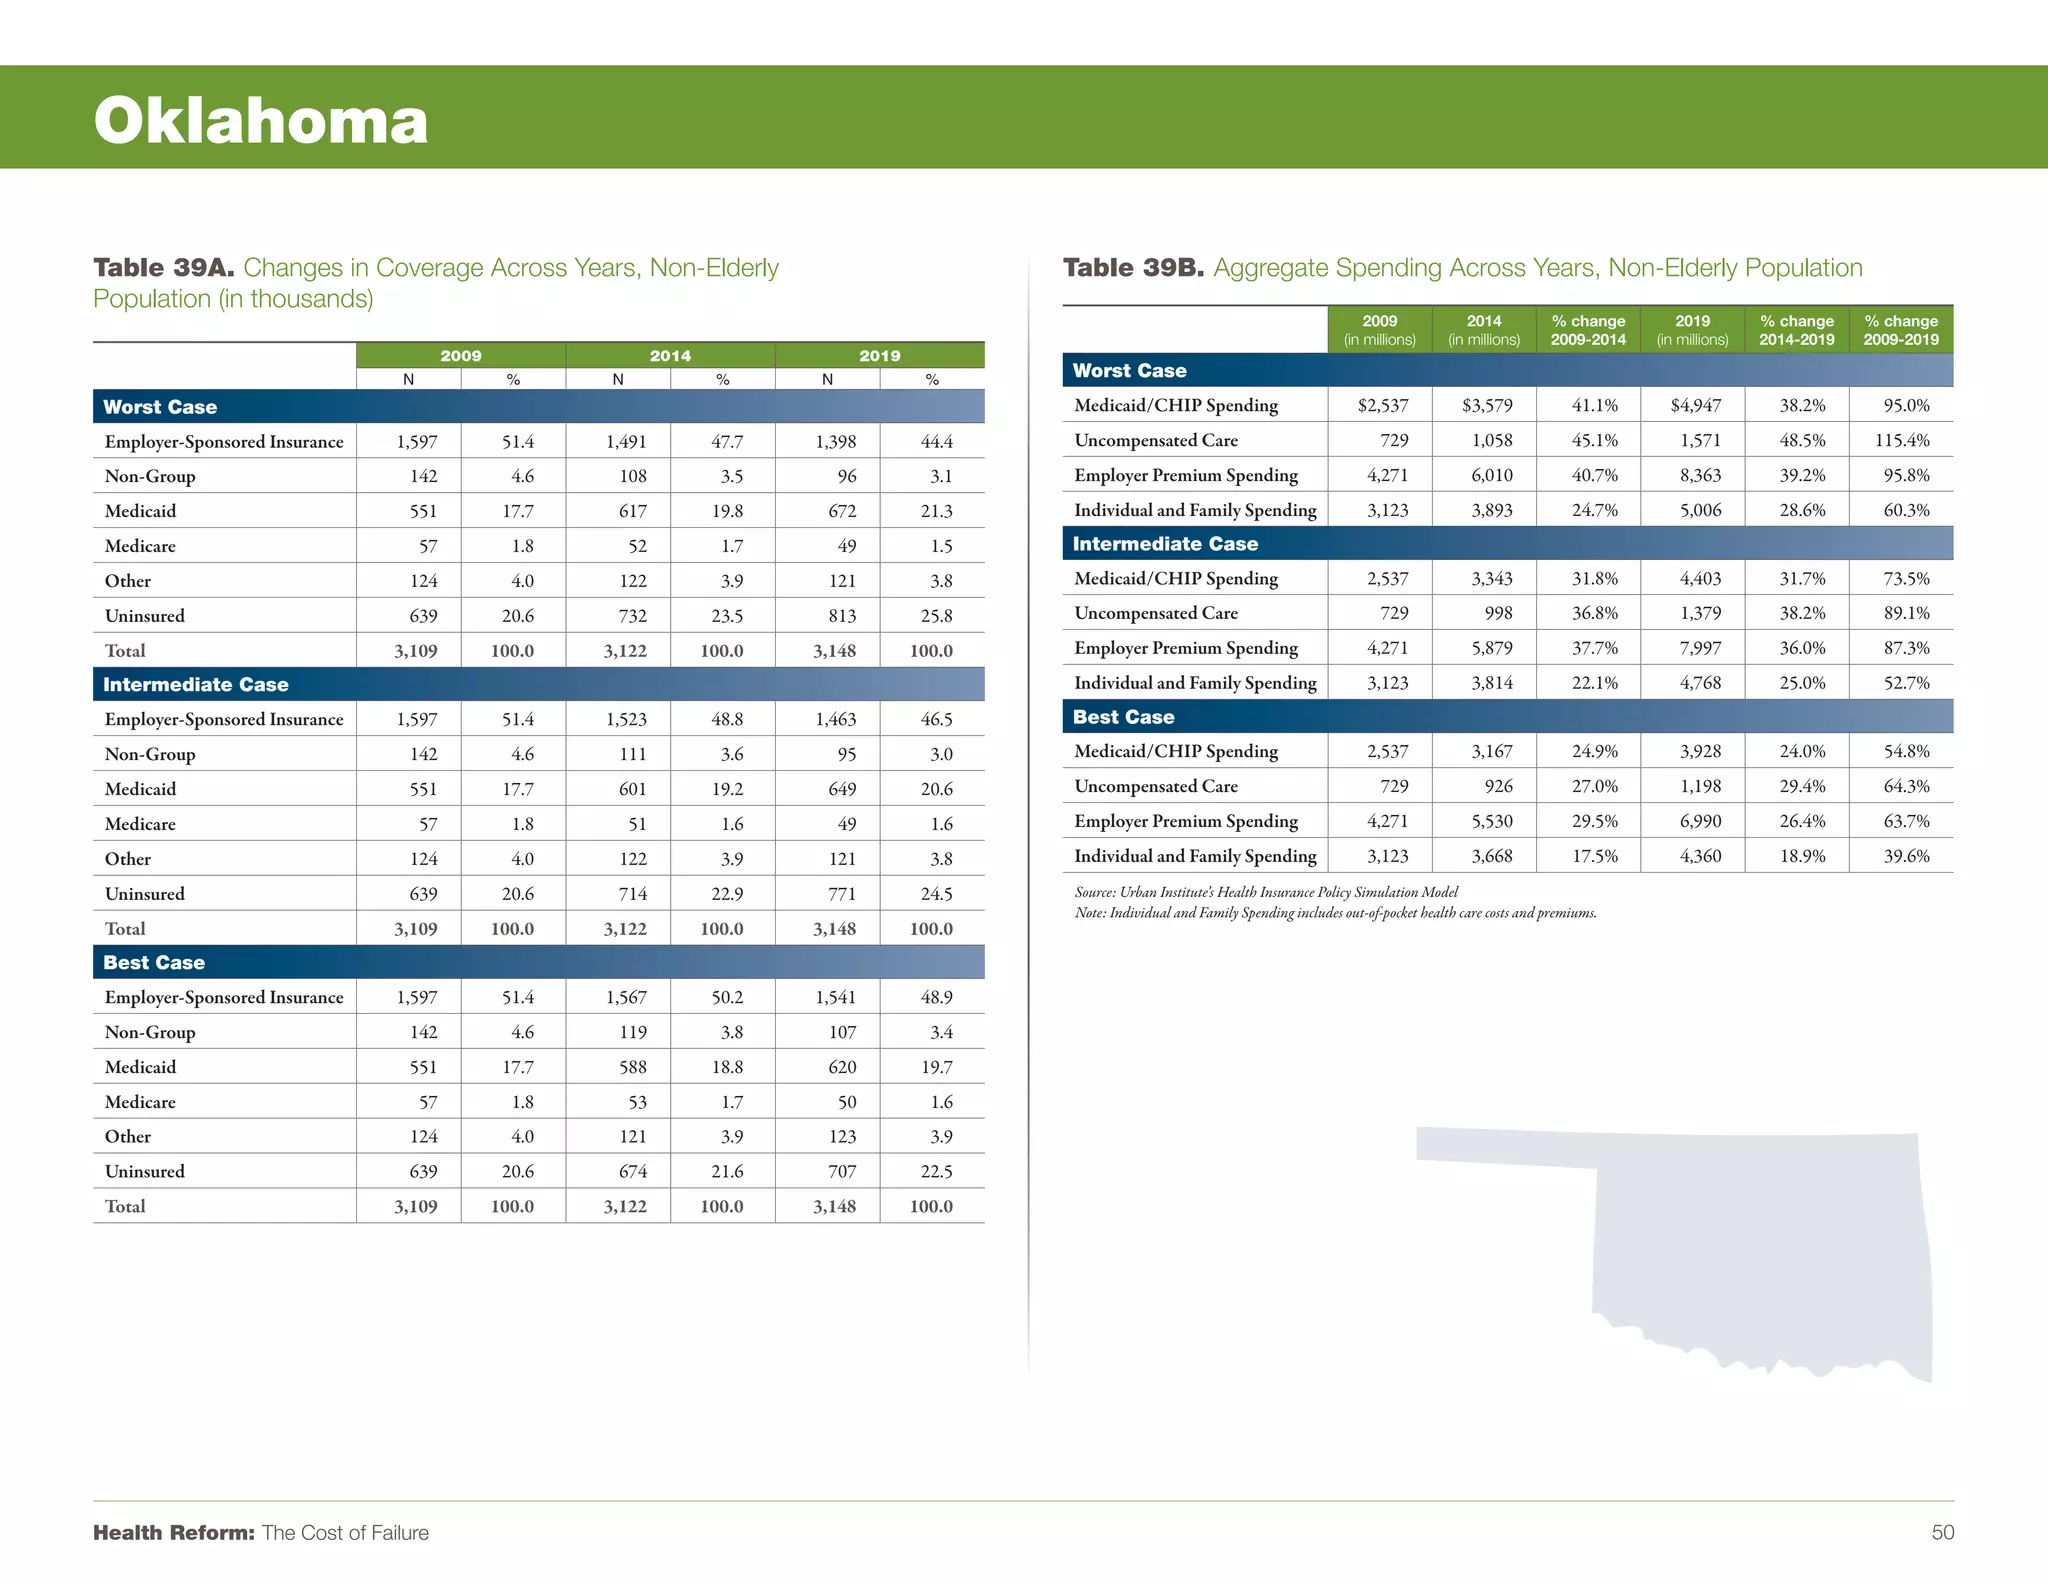
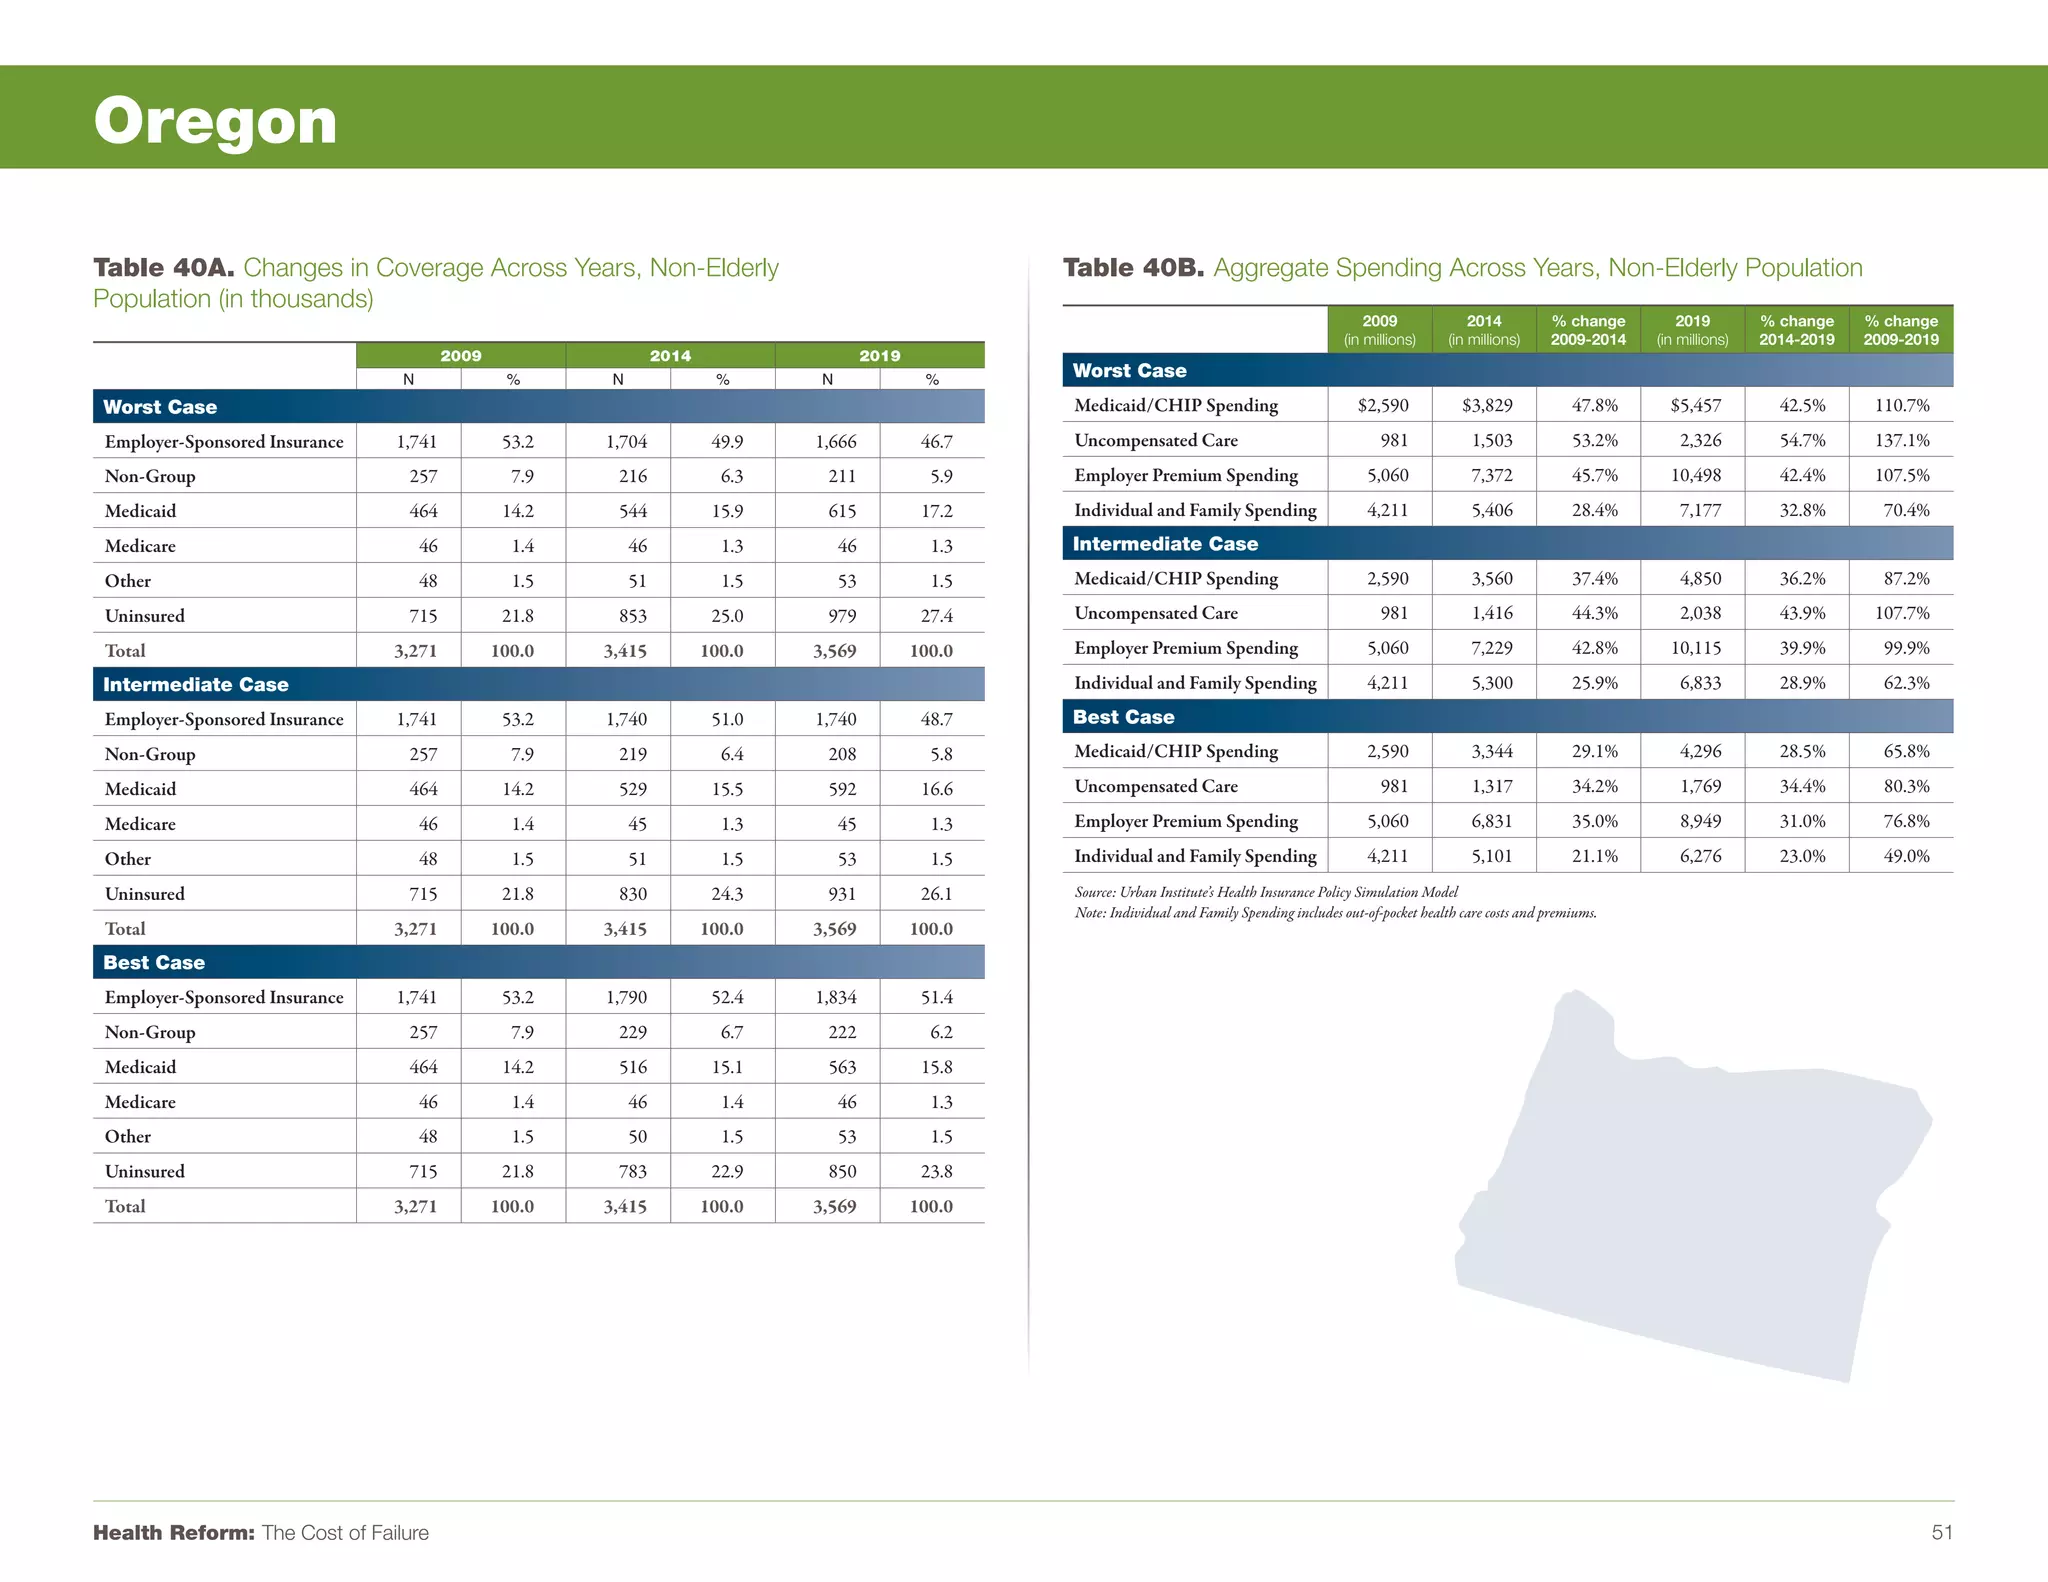
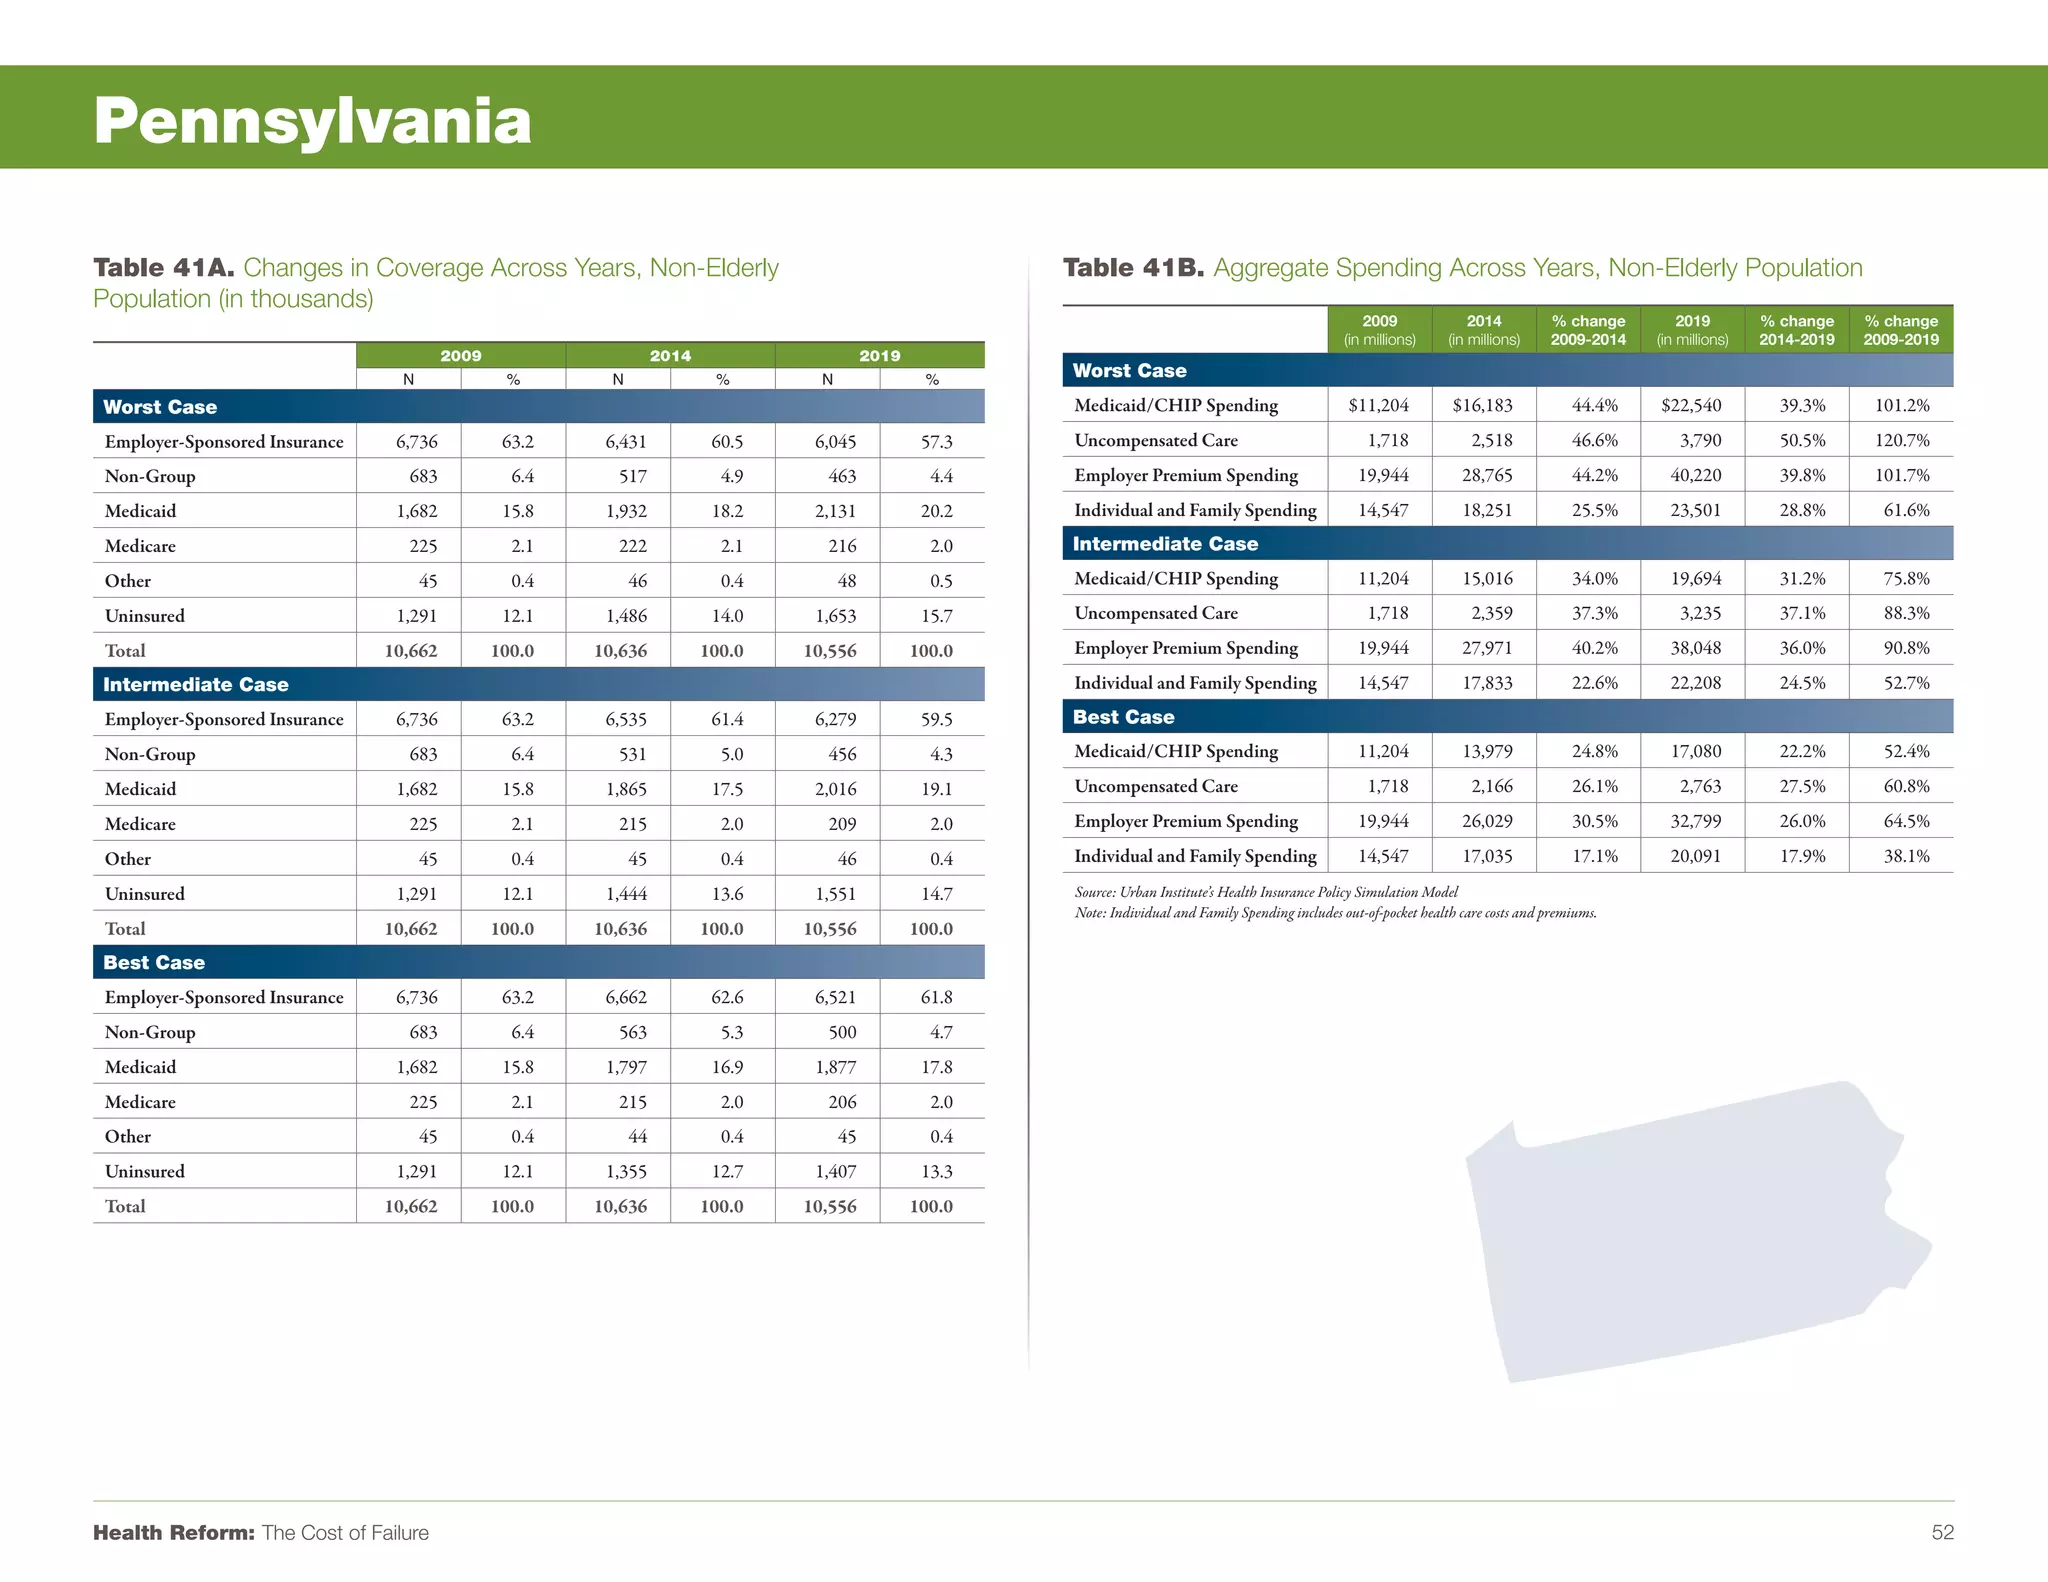
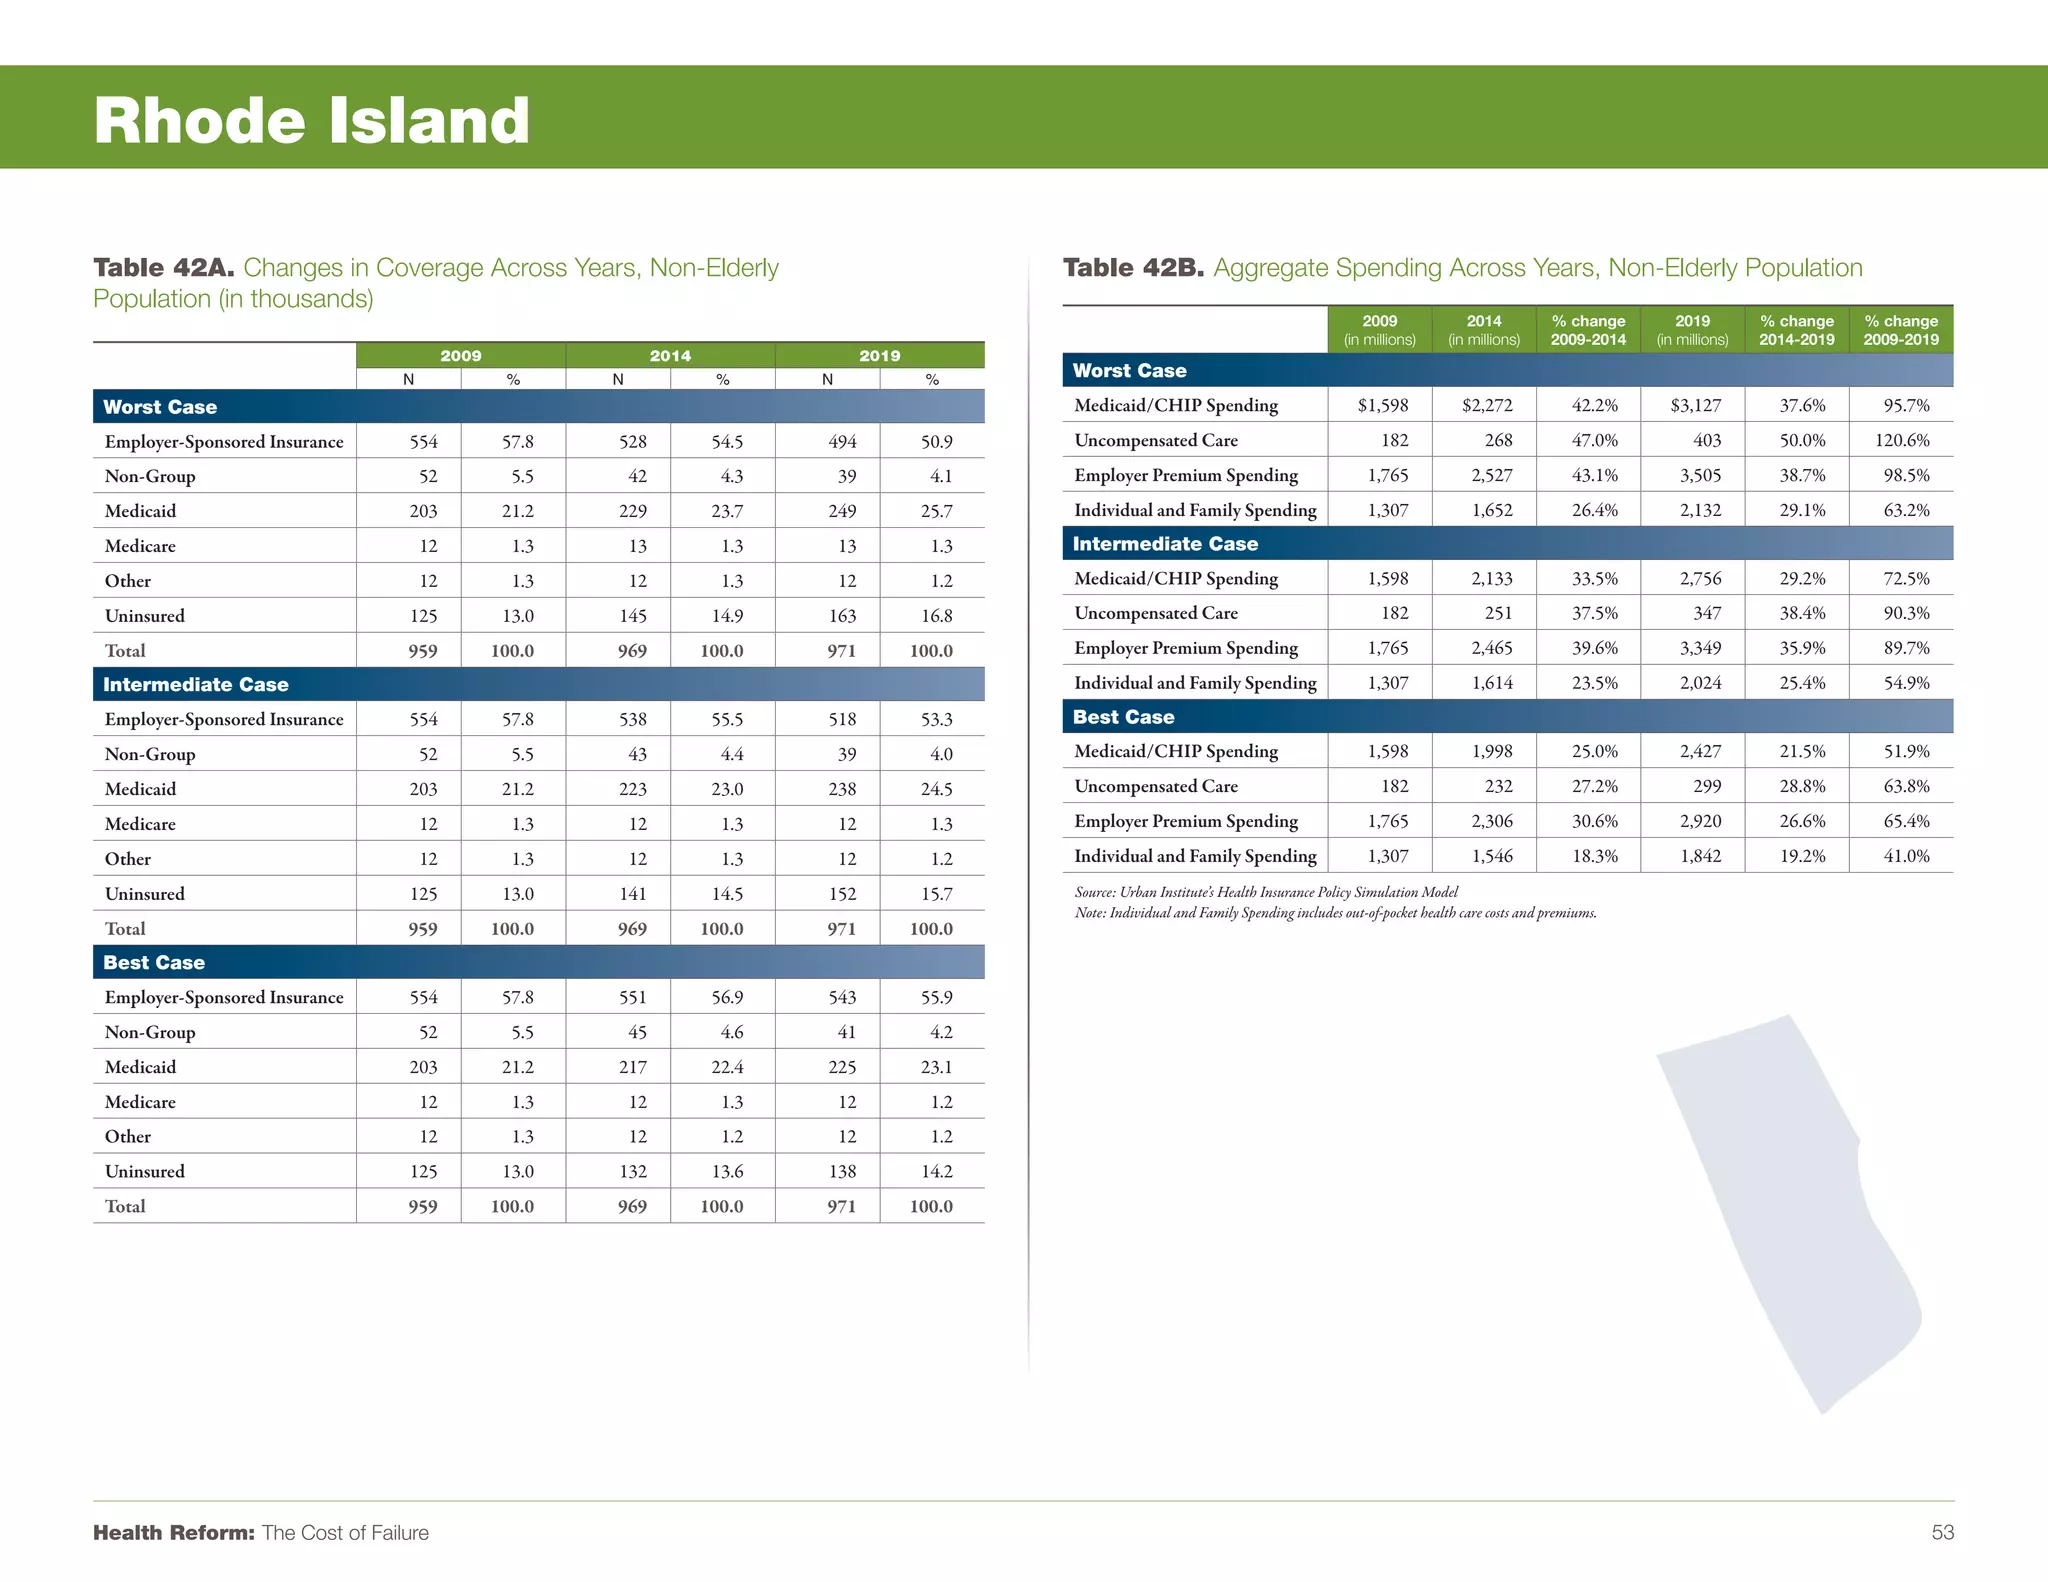
Under the worst-case scenario described in the document:
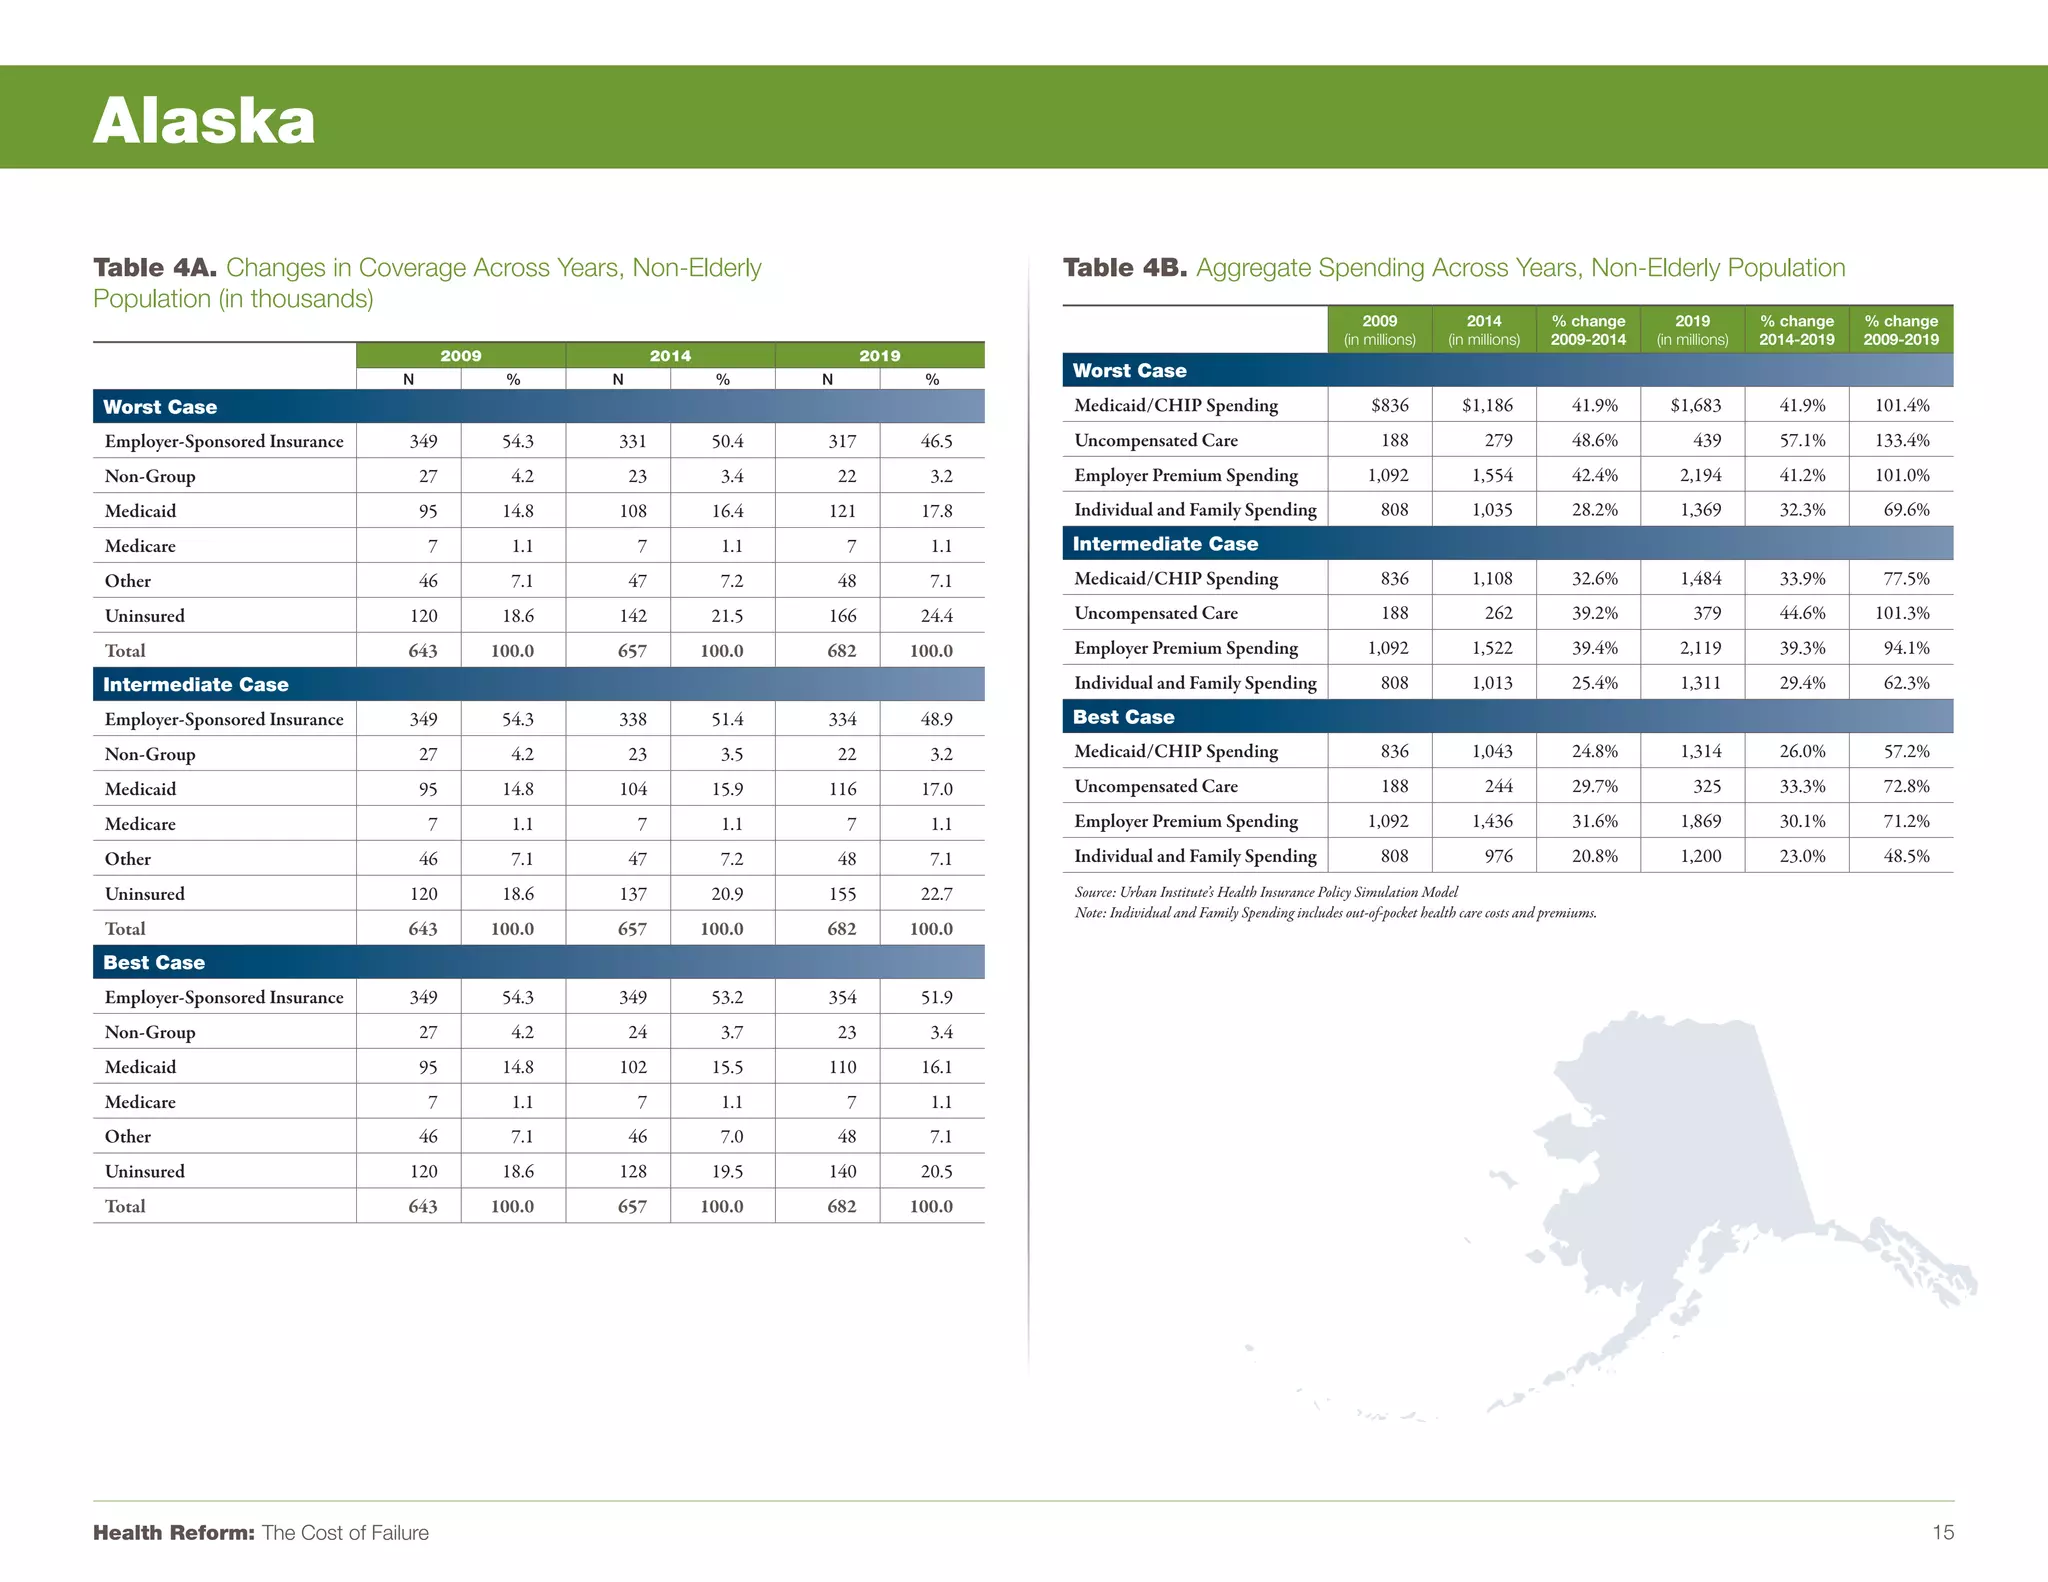
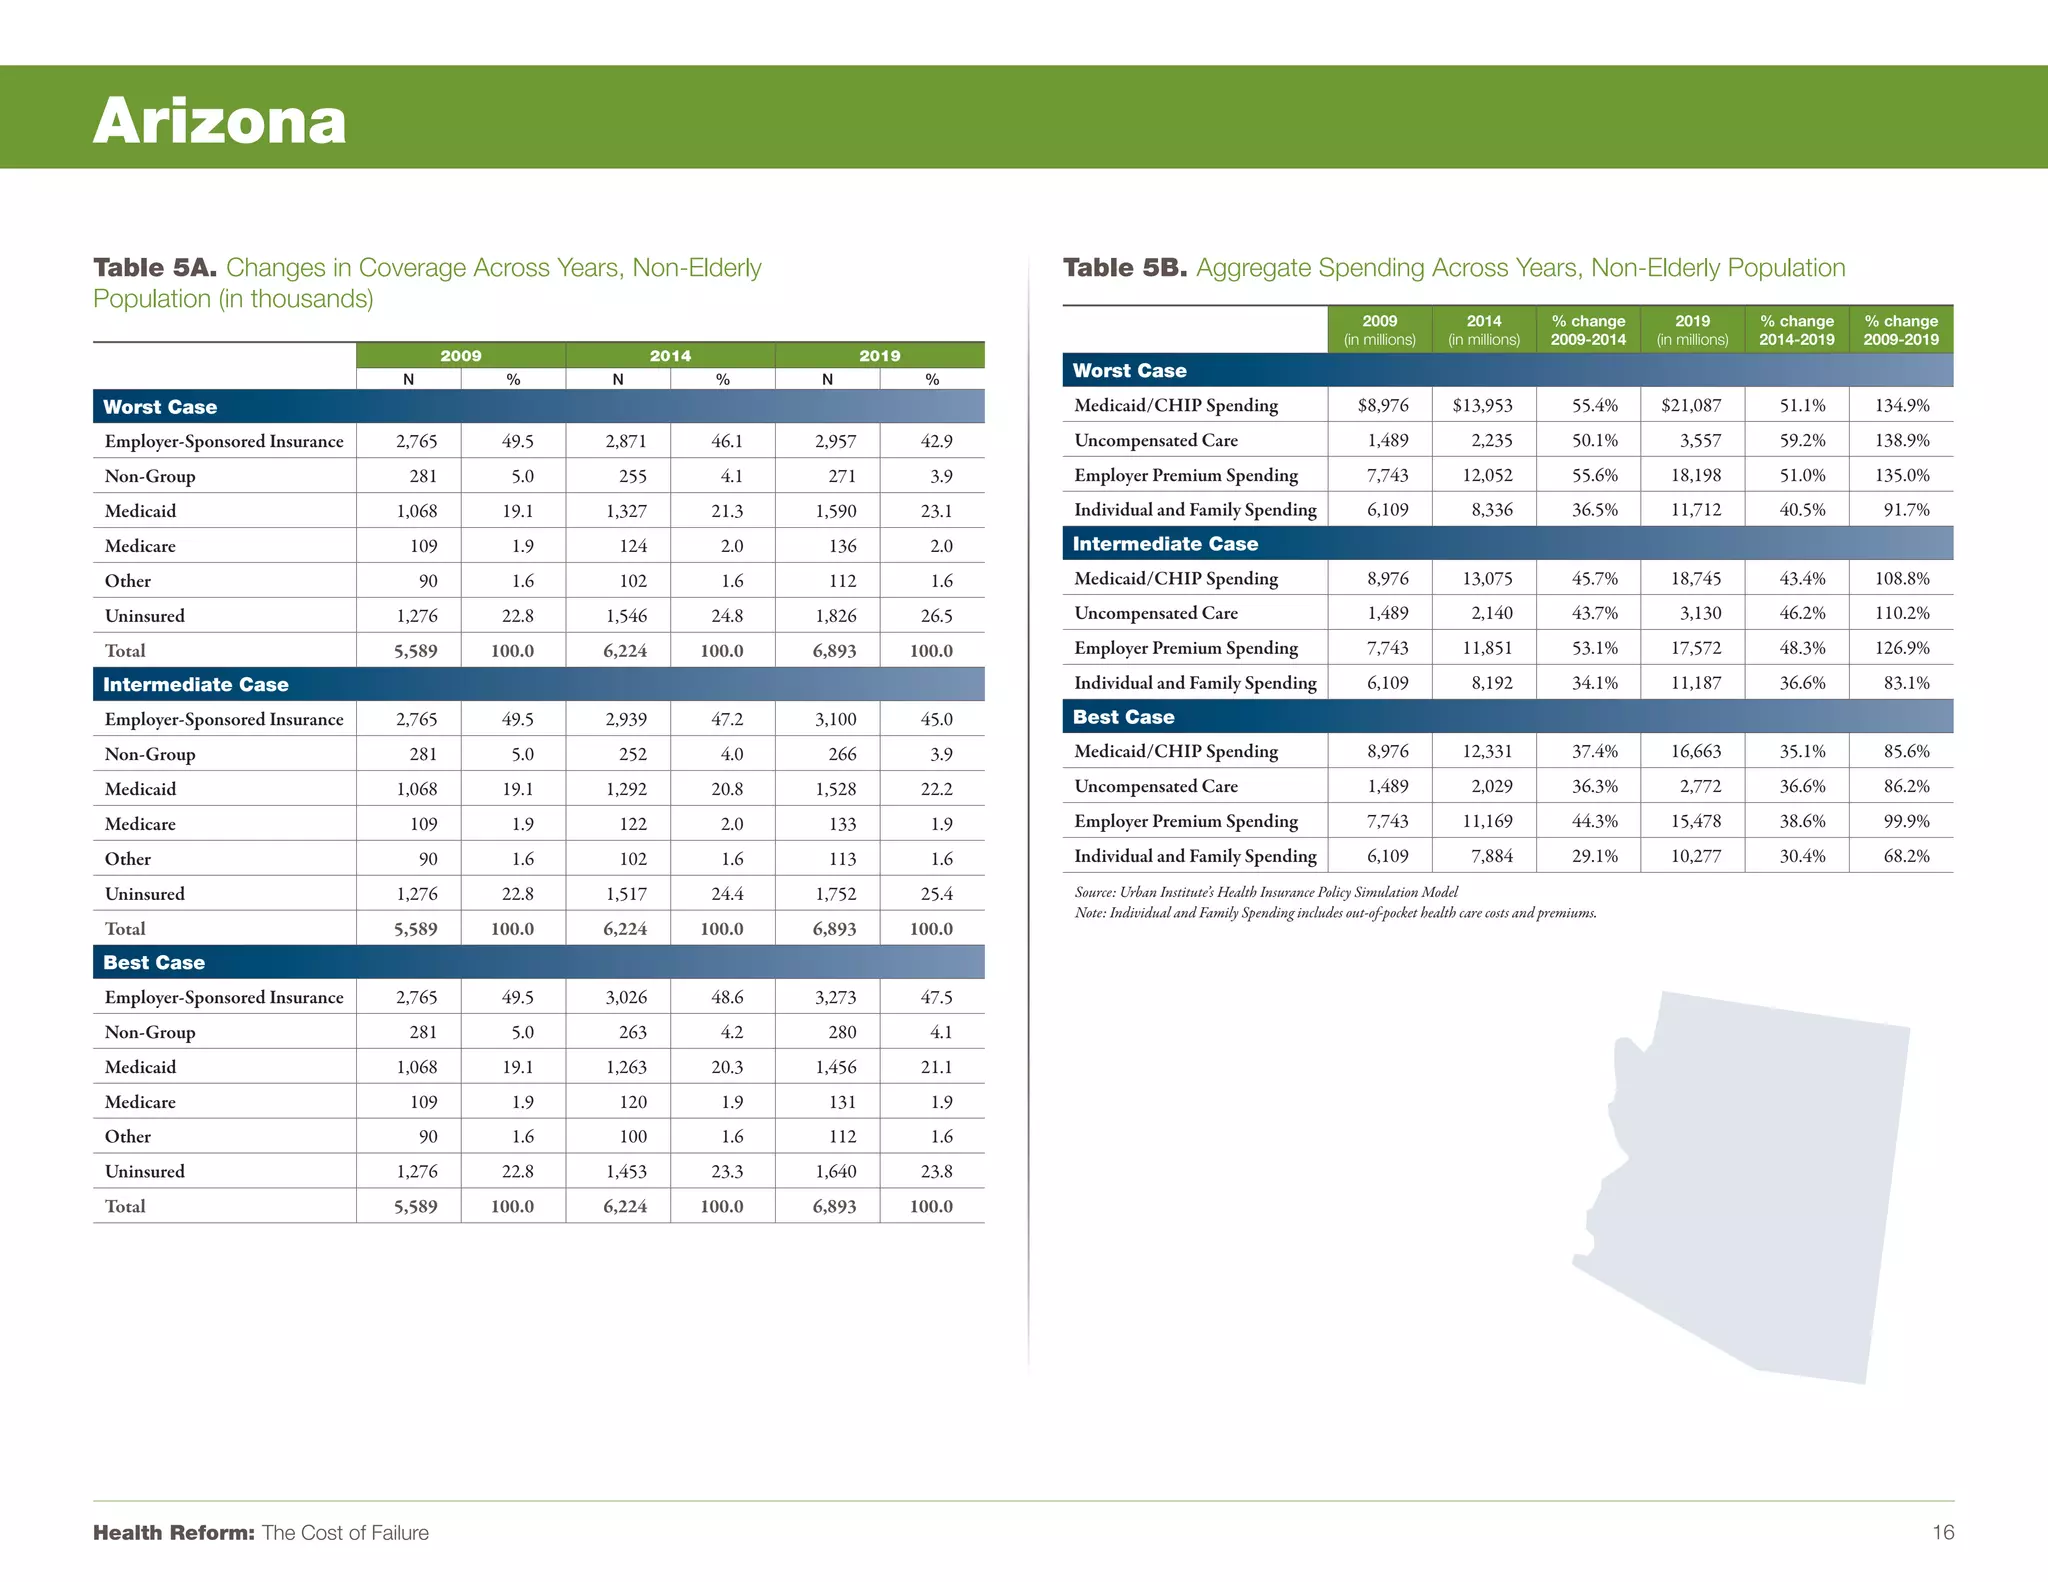
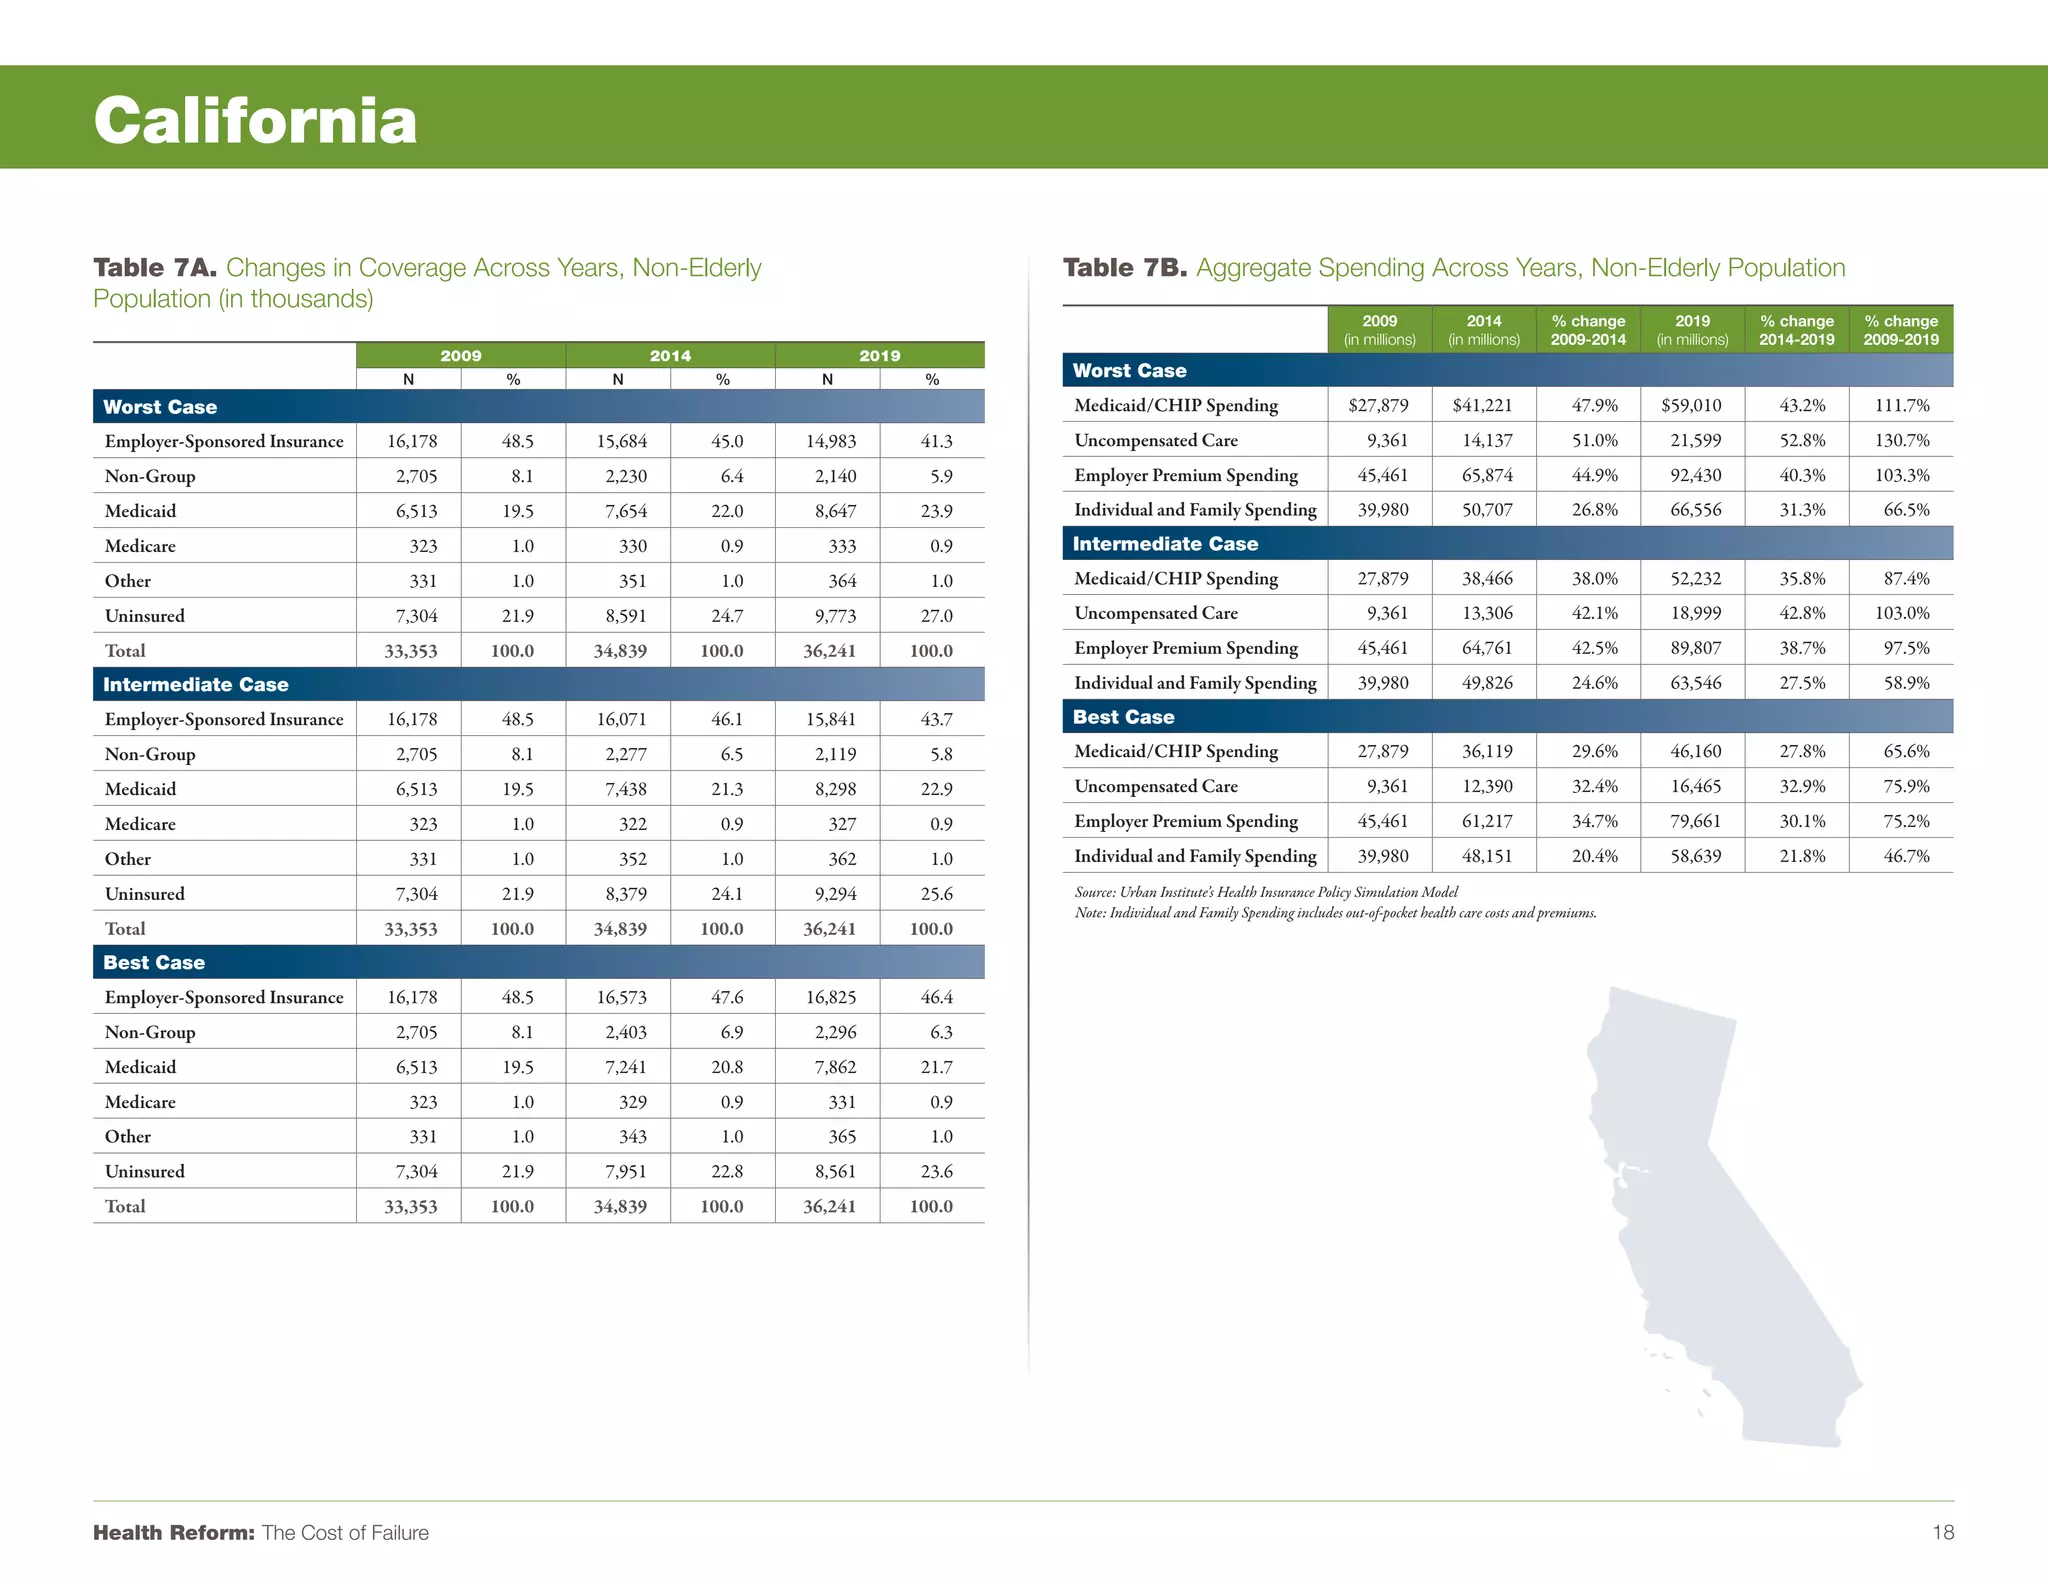
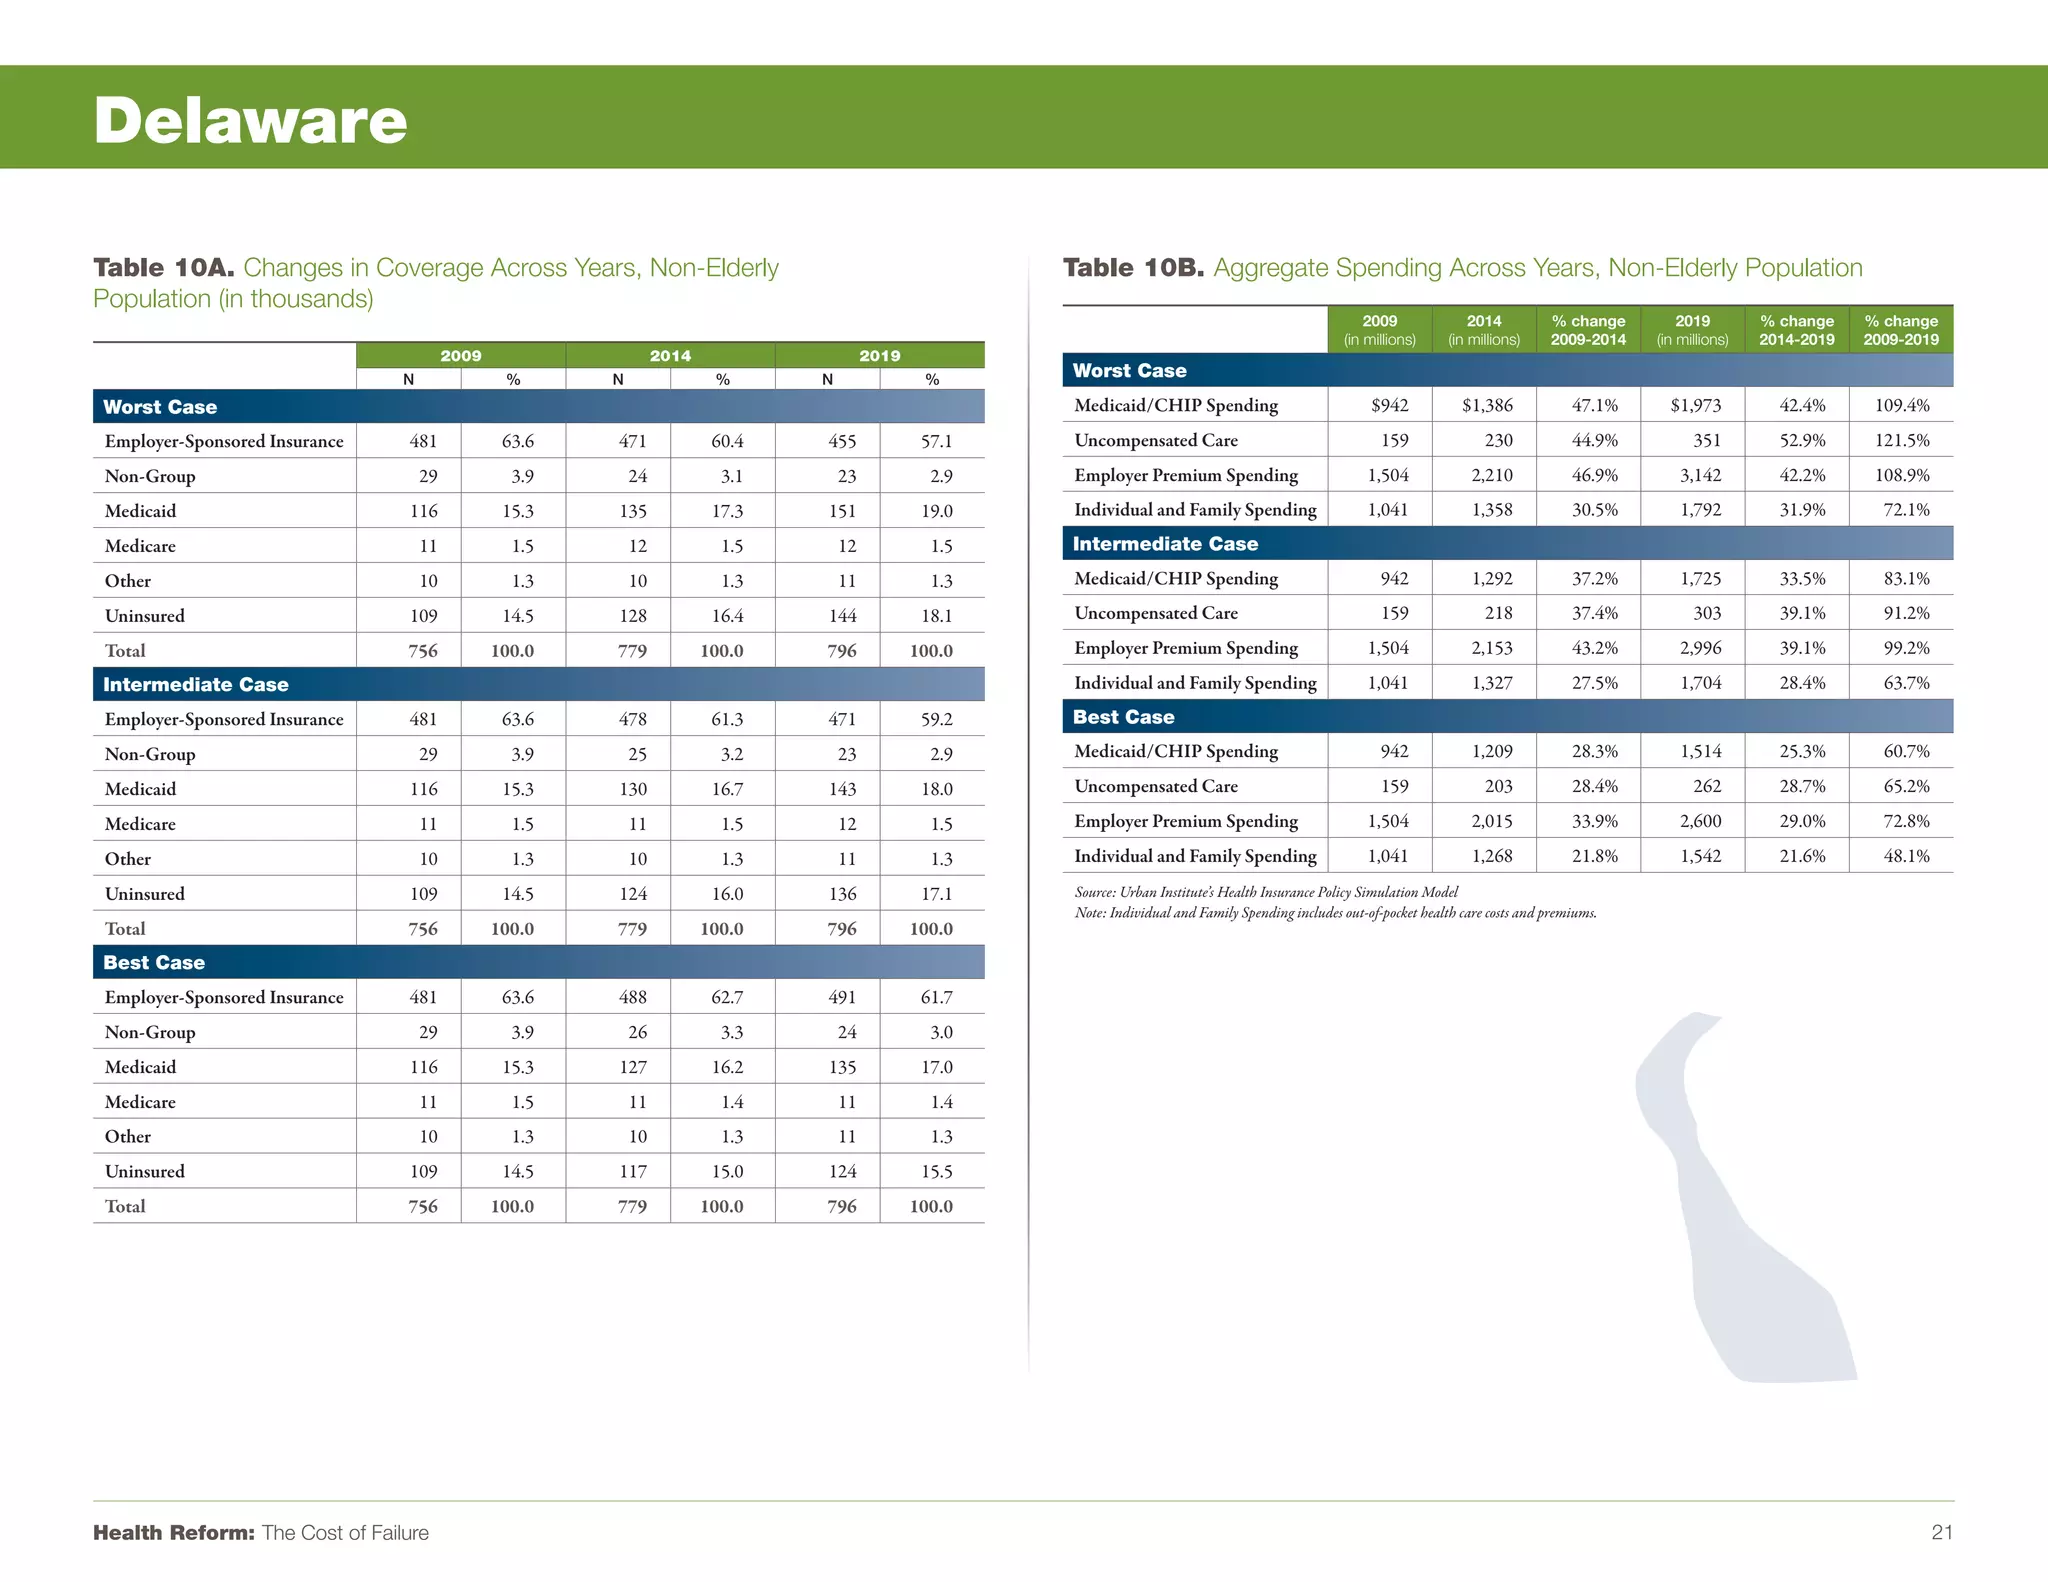
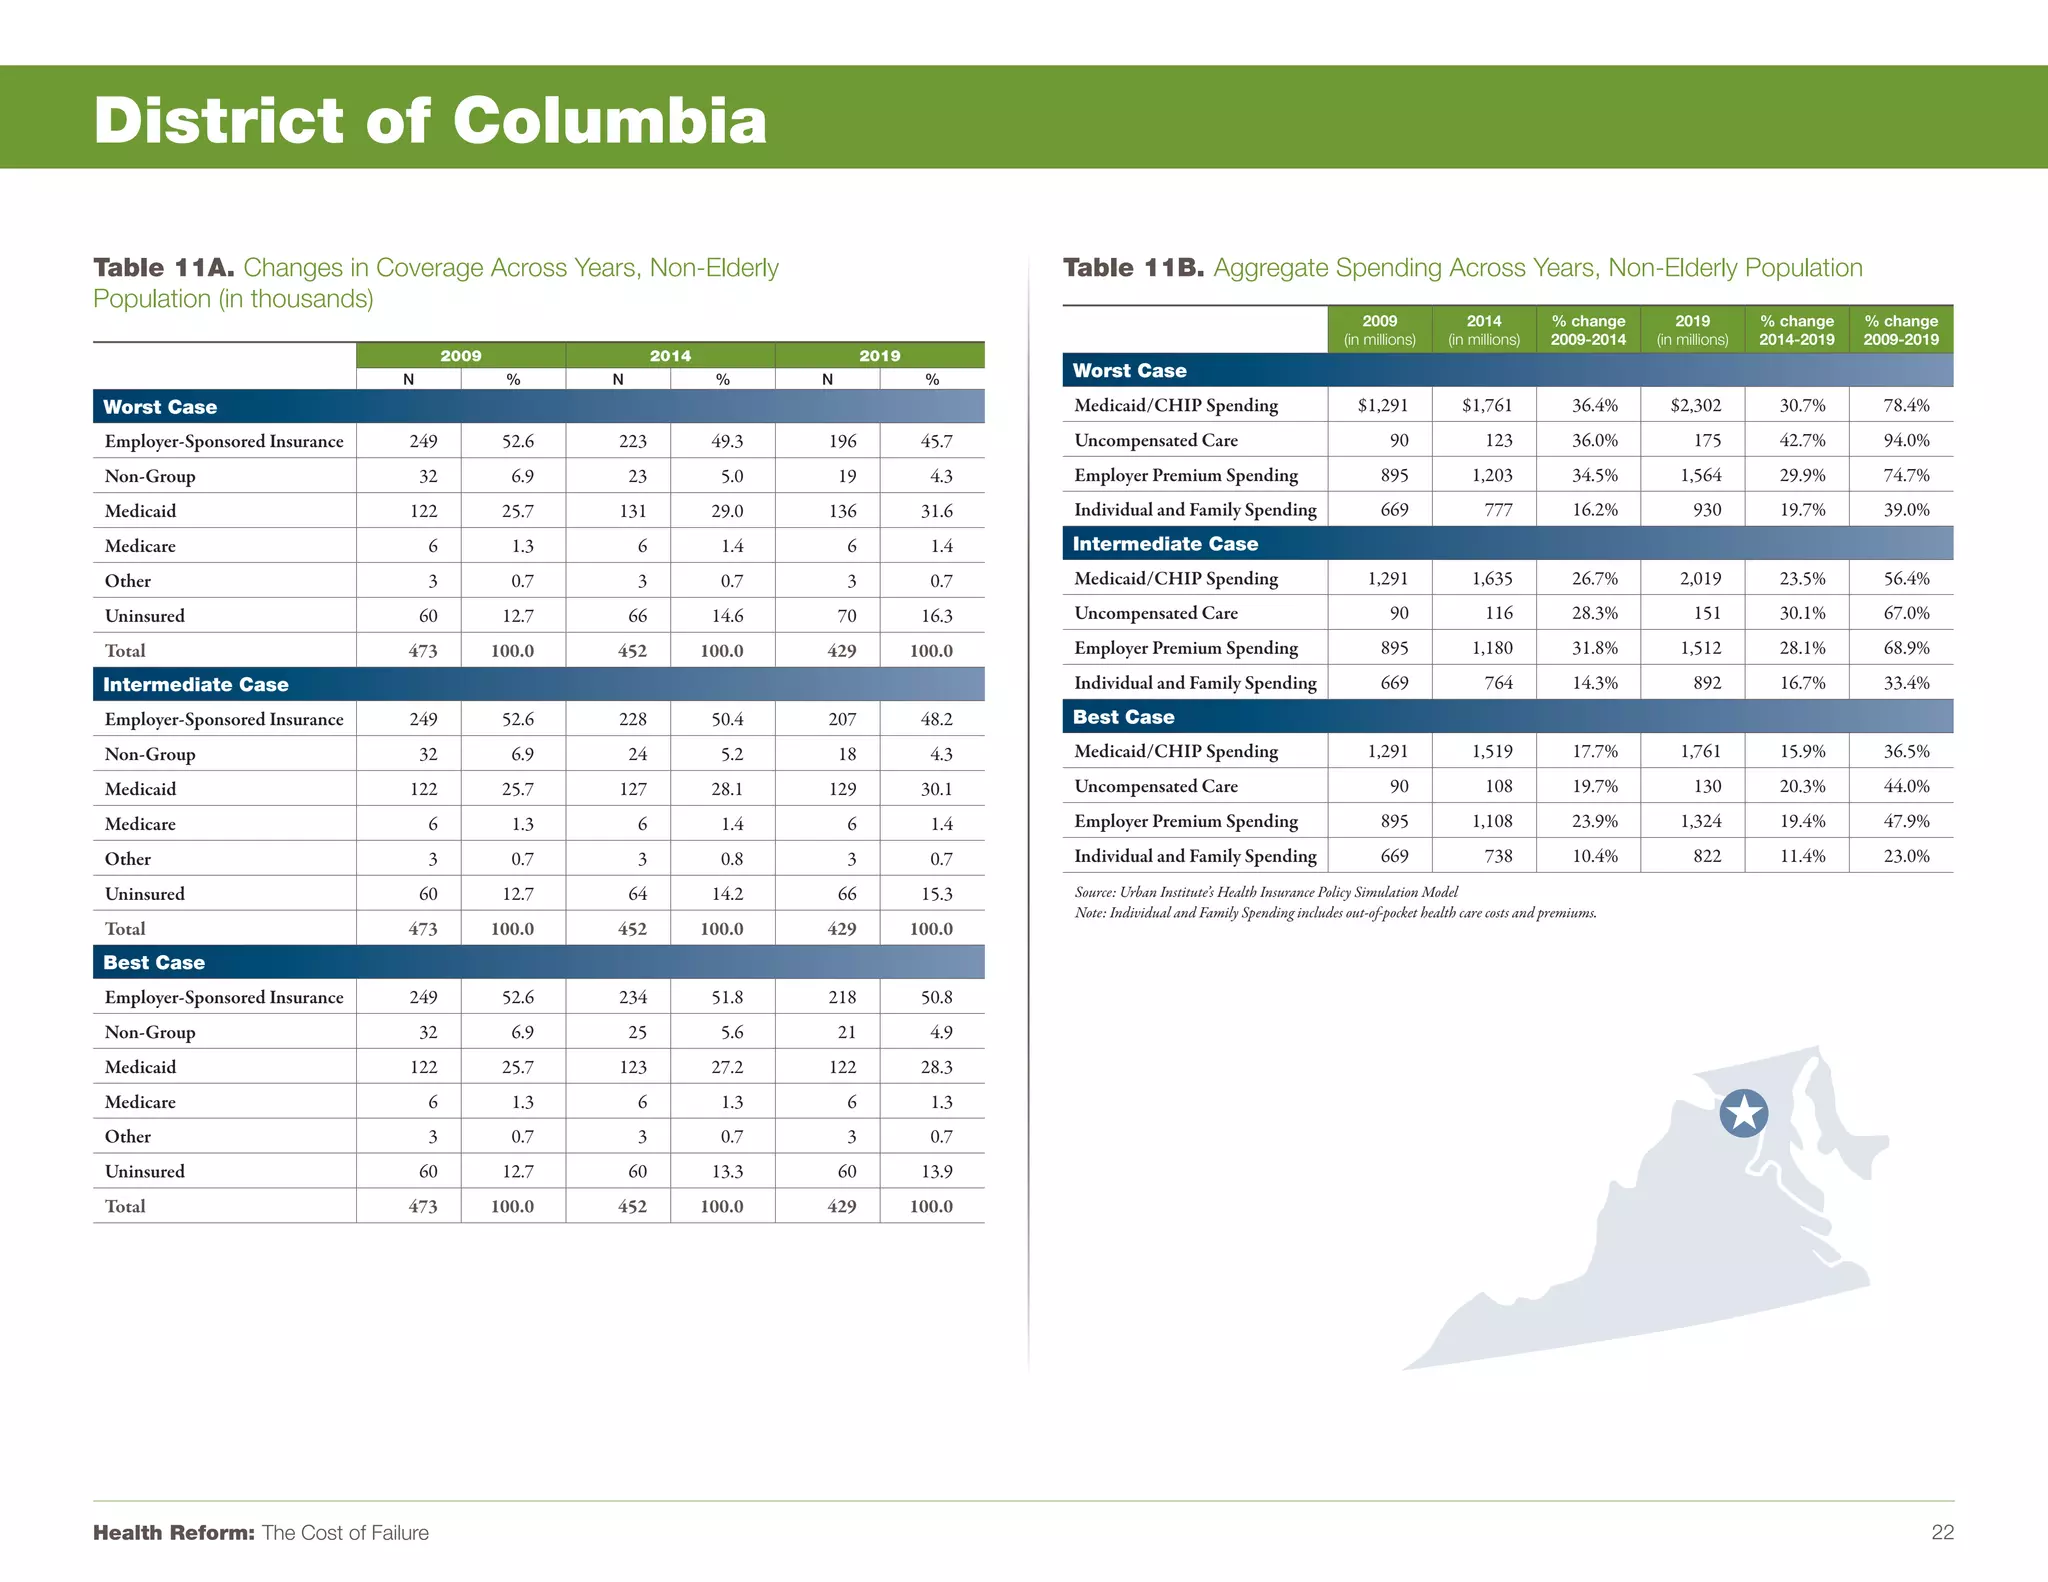
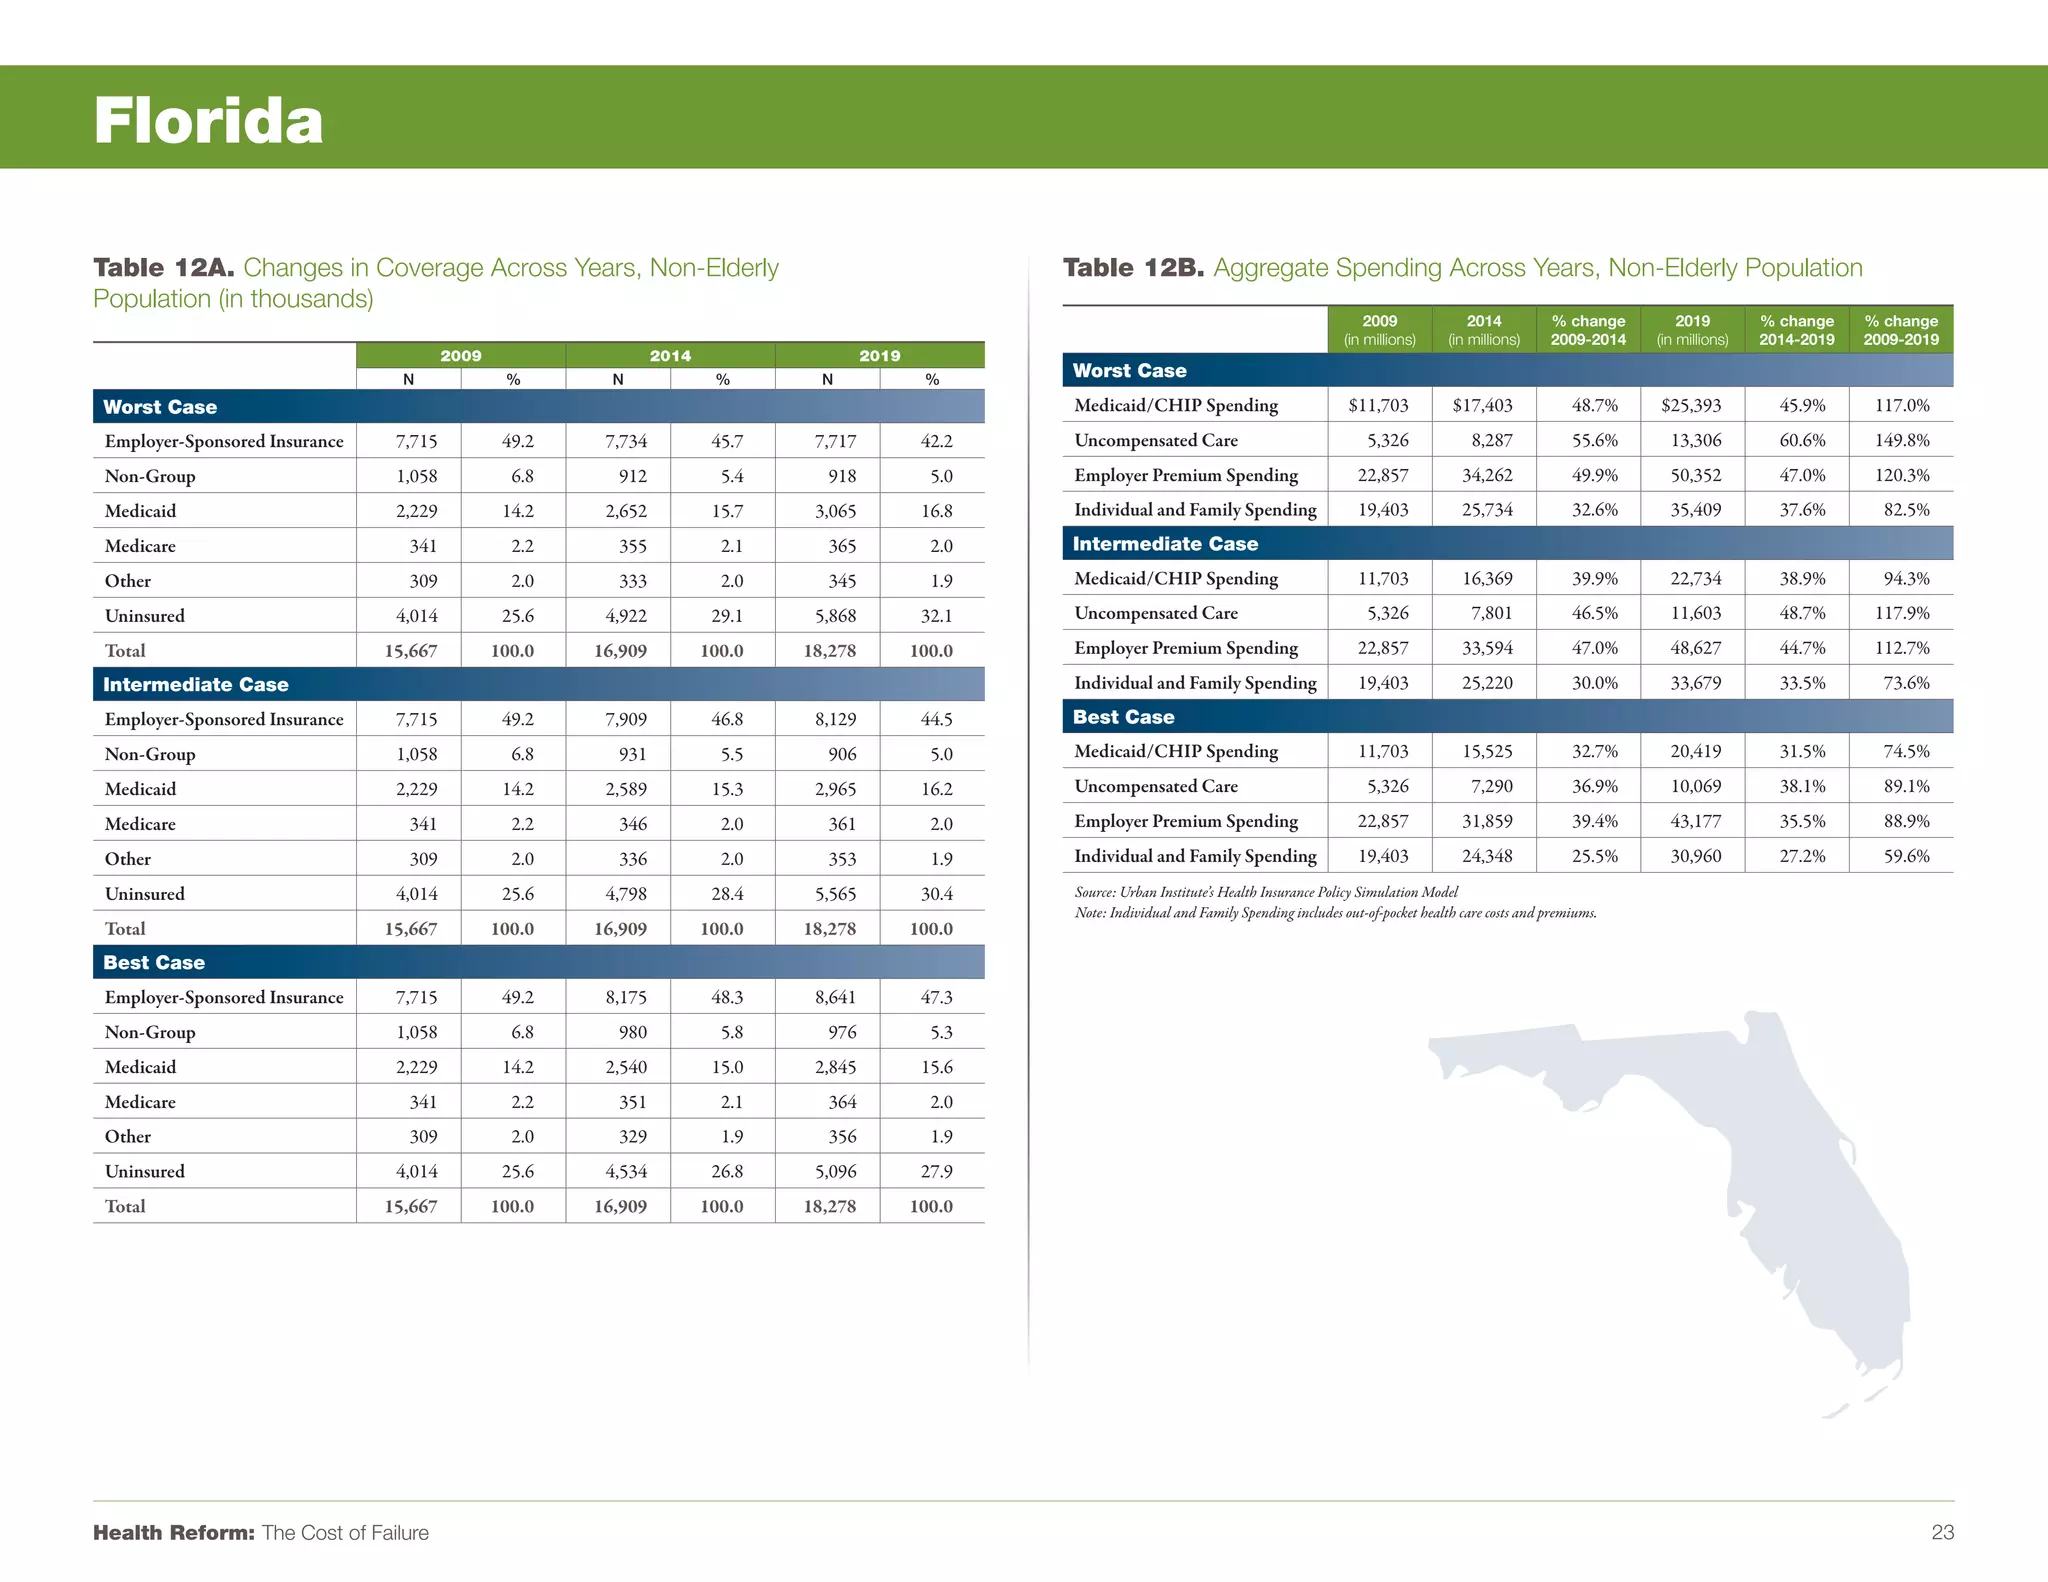
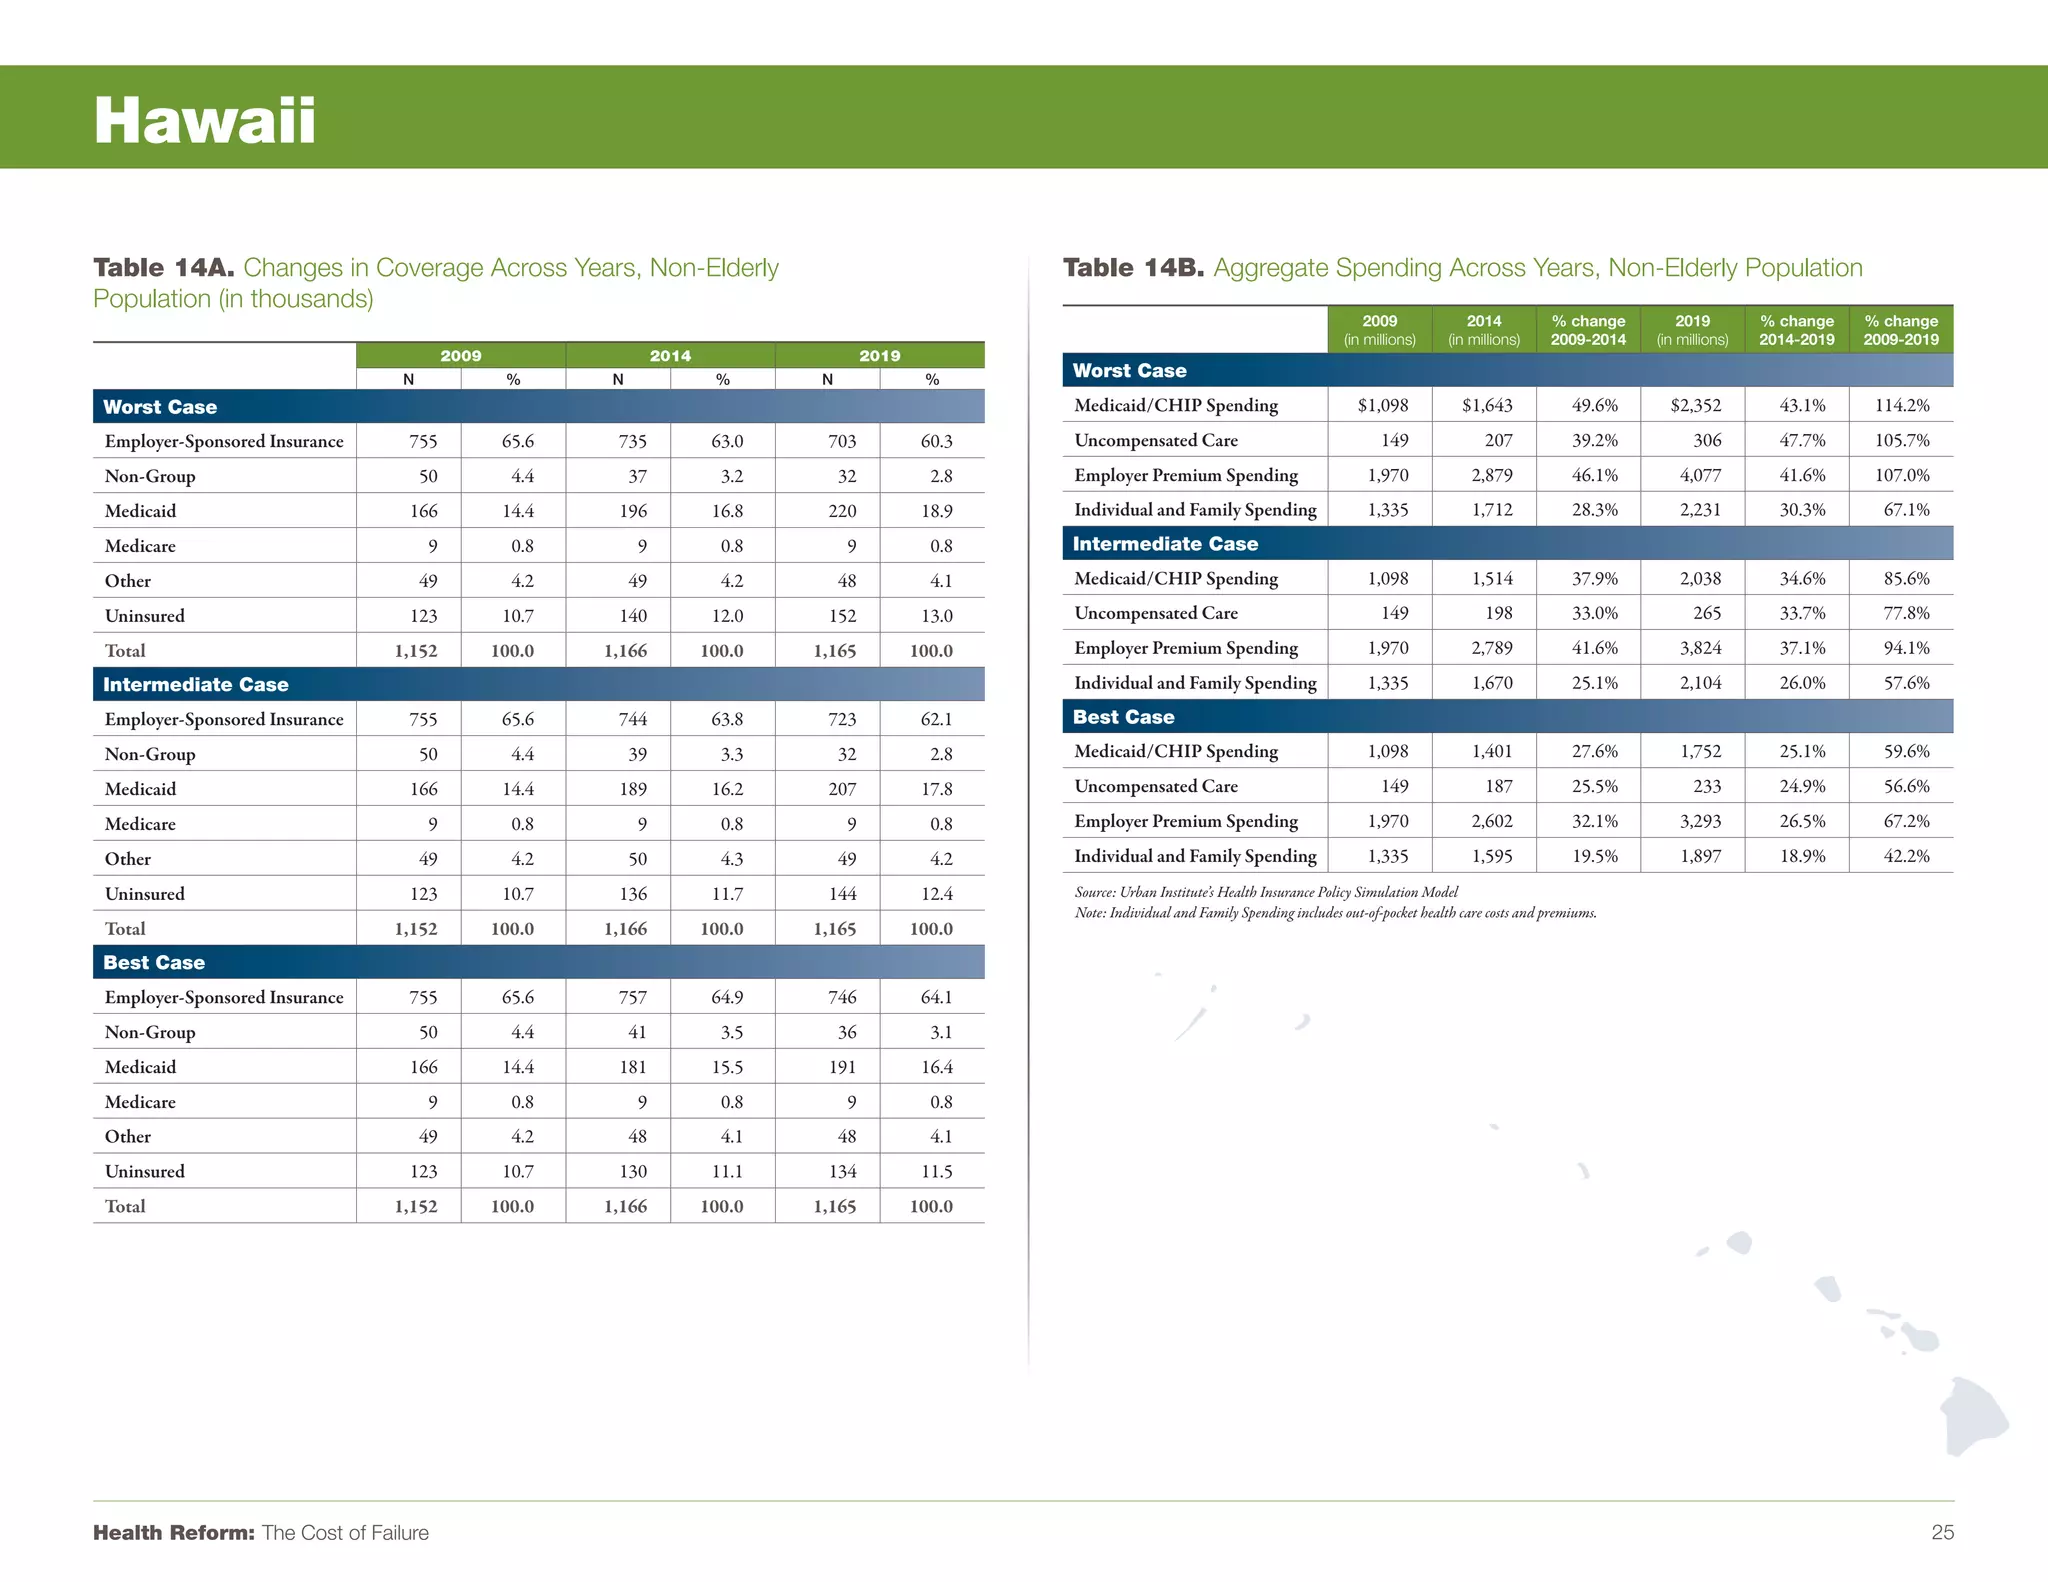
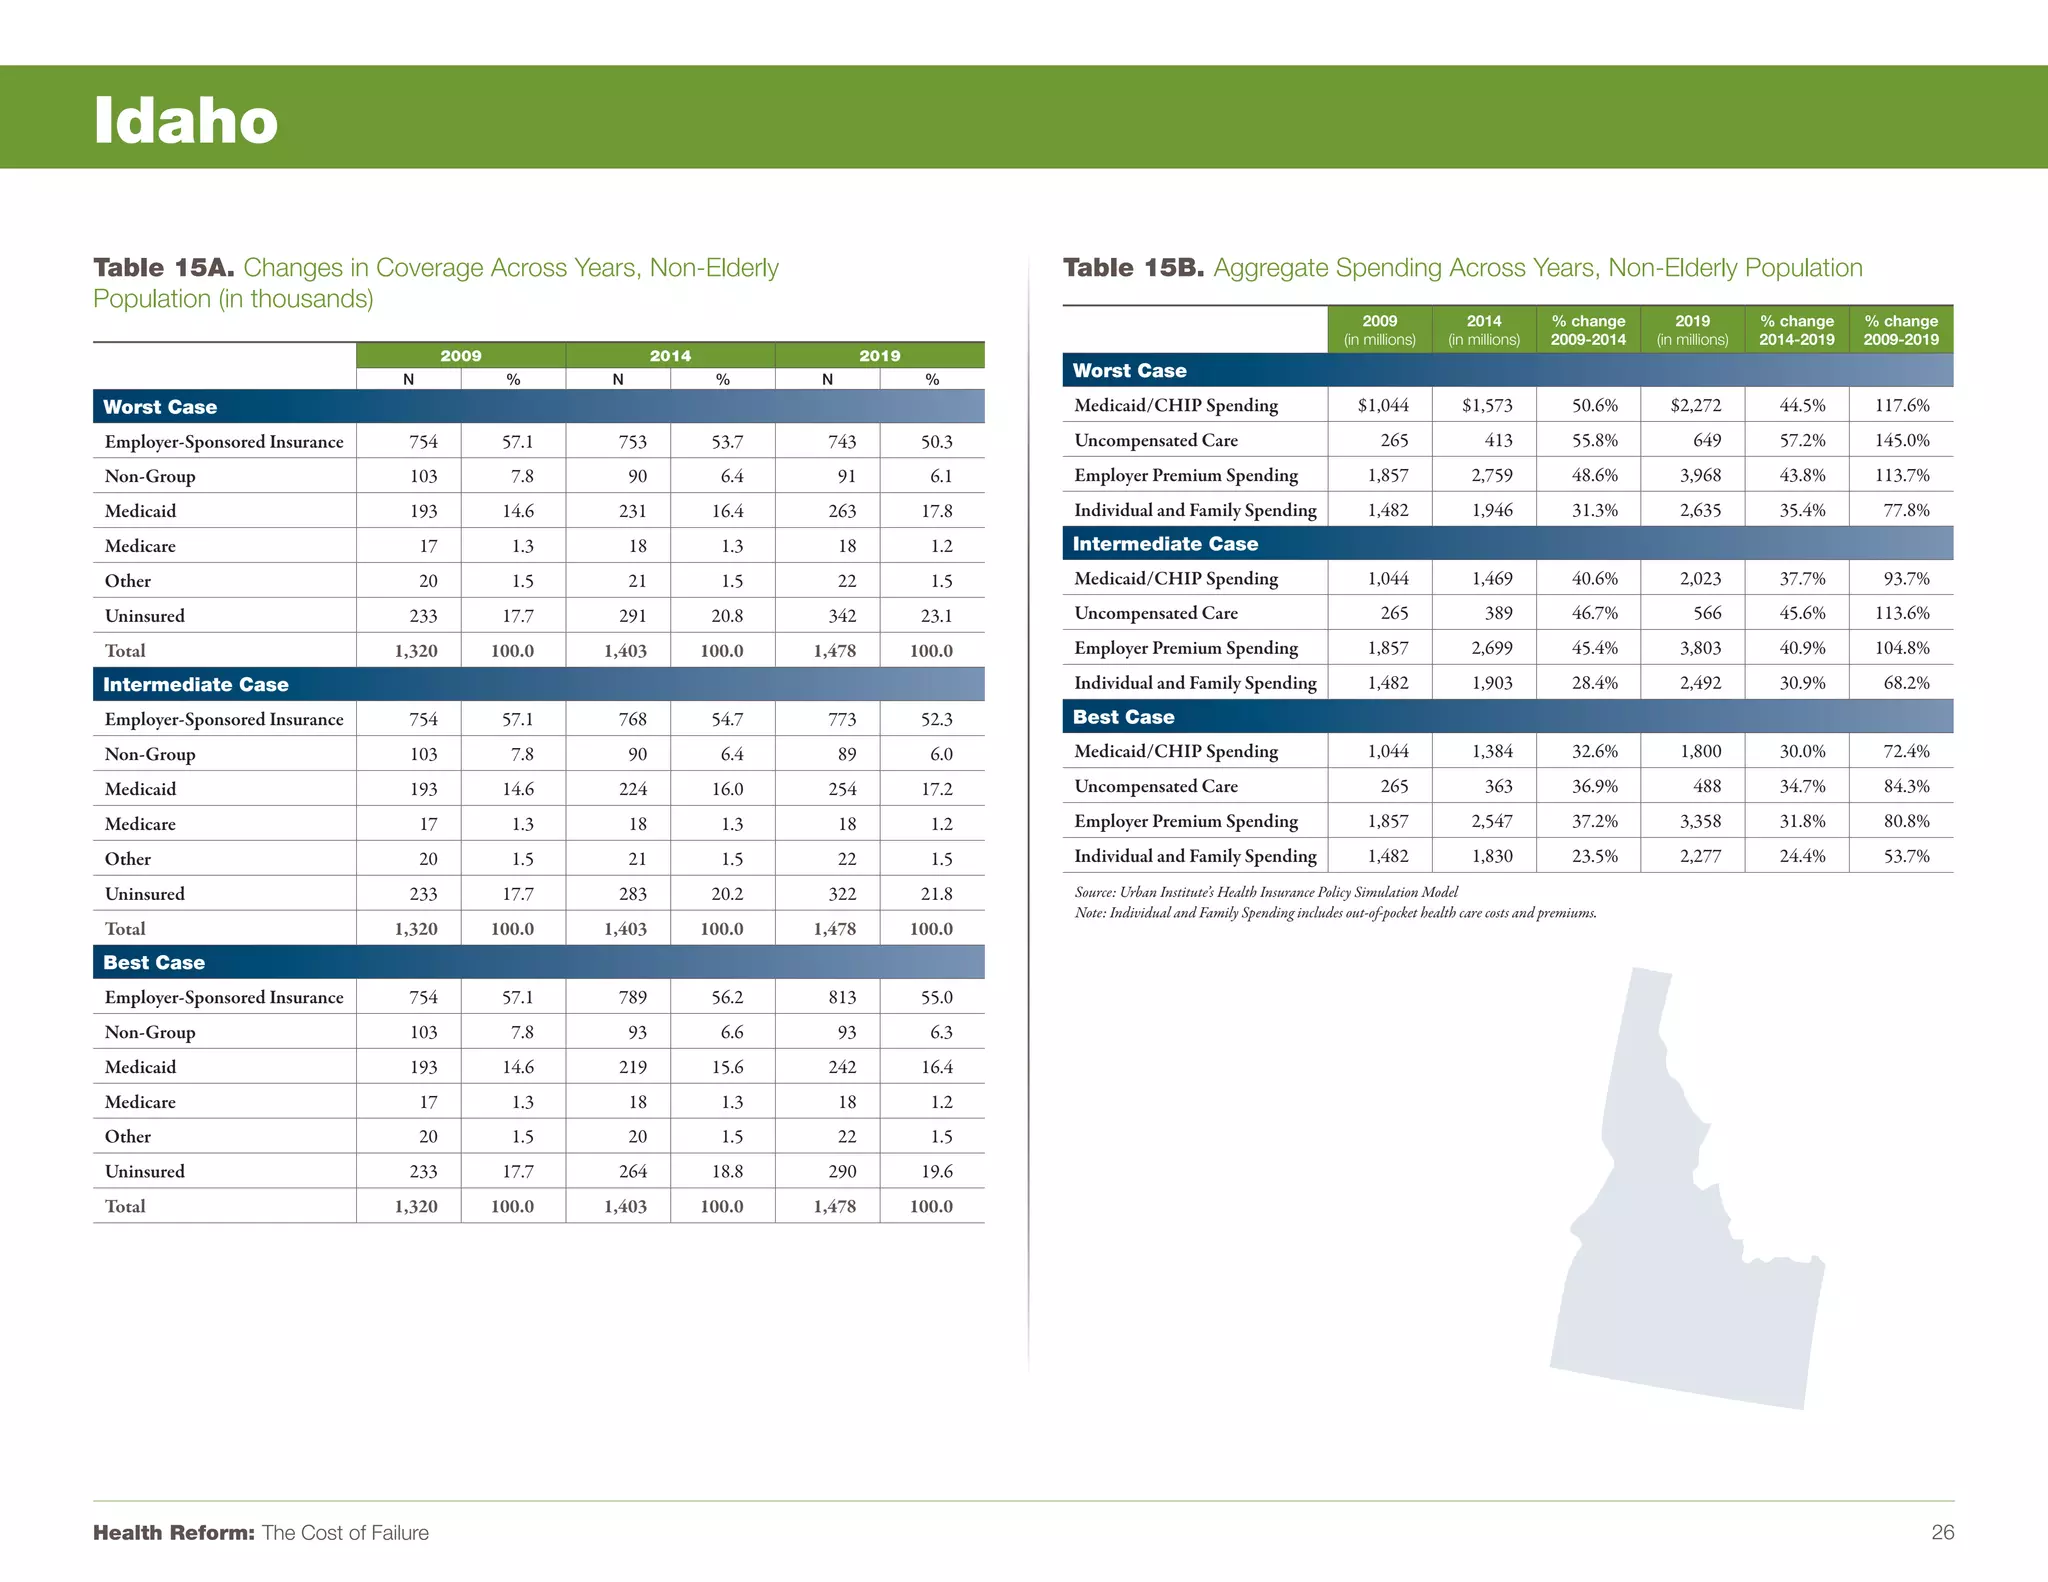
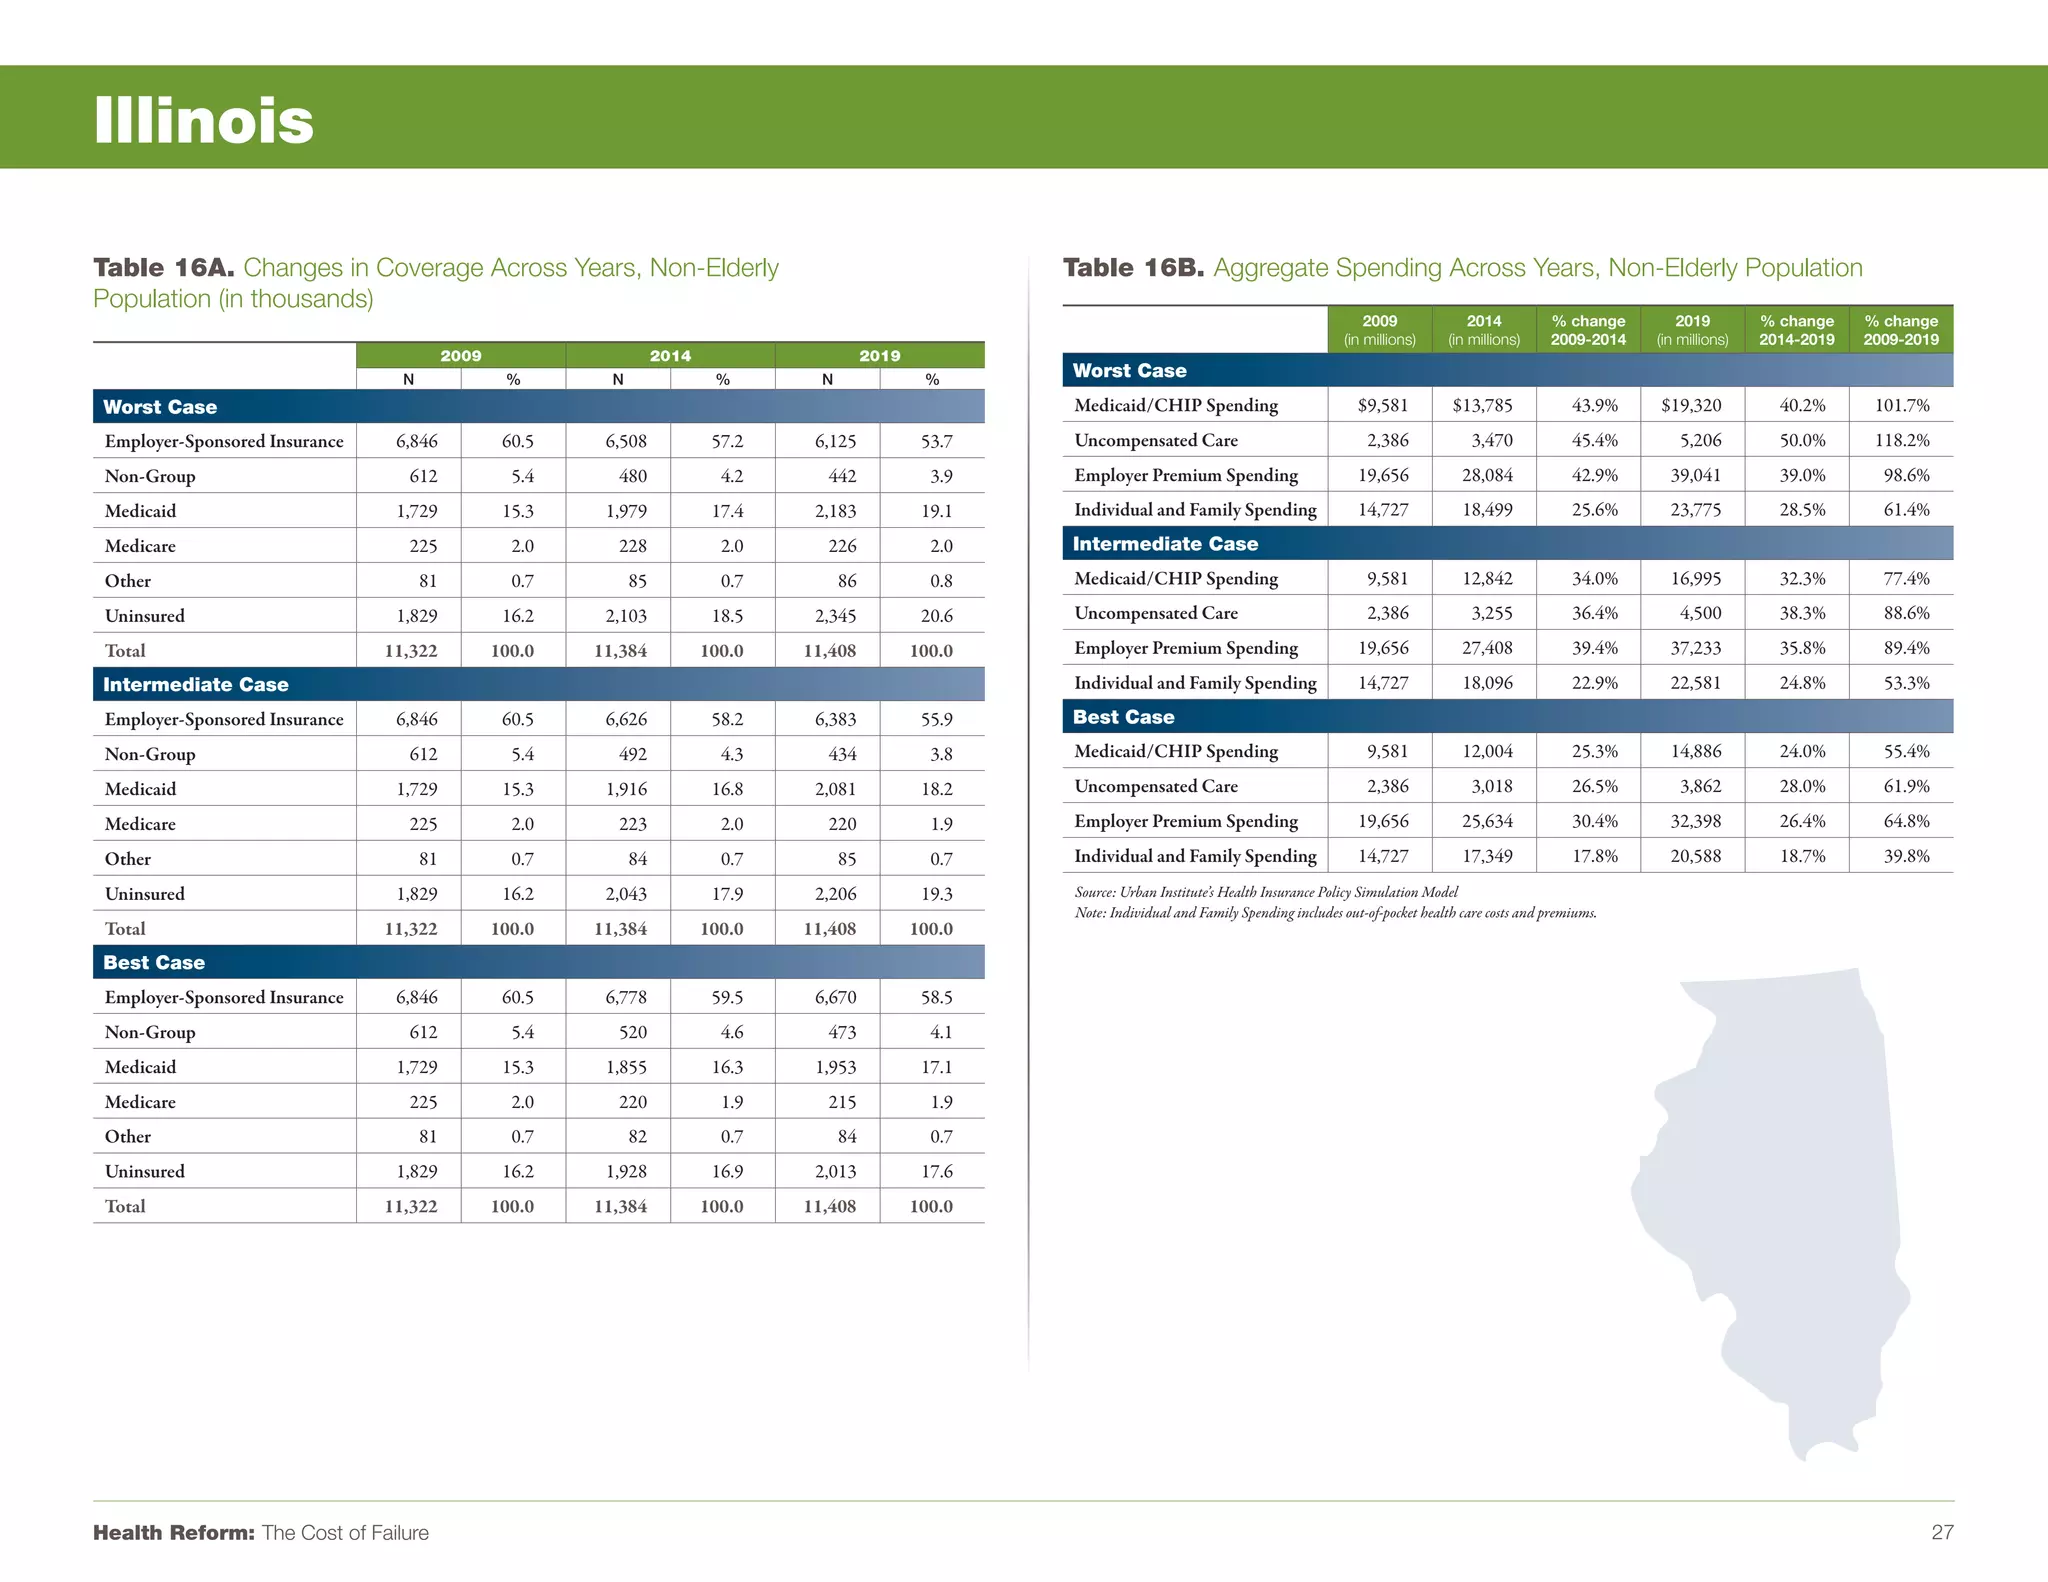
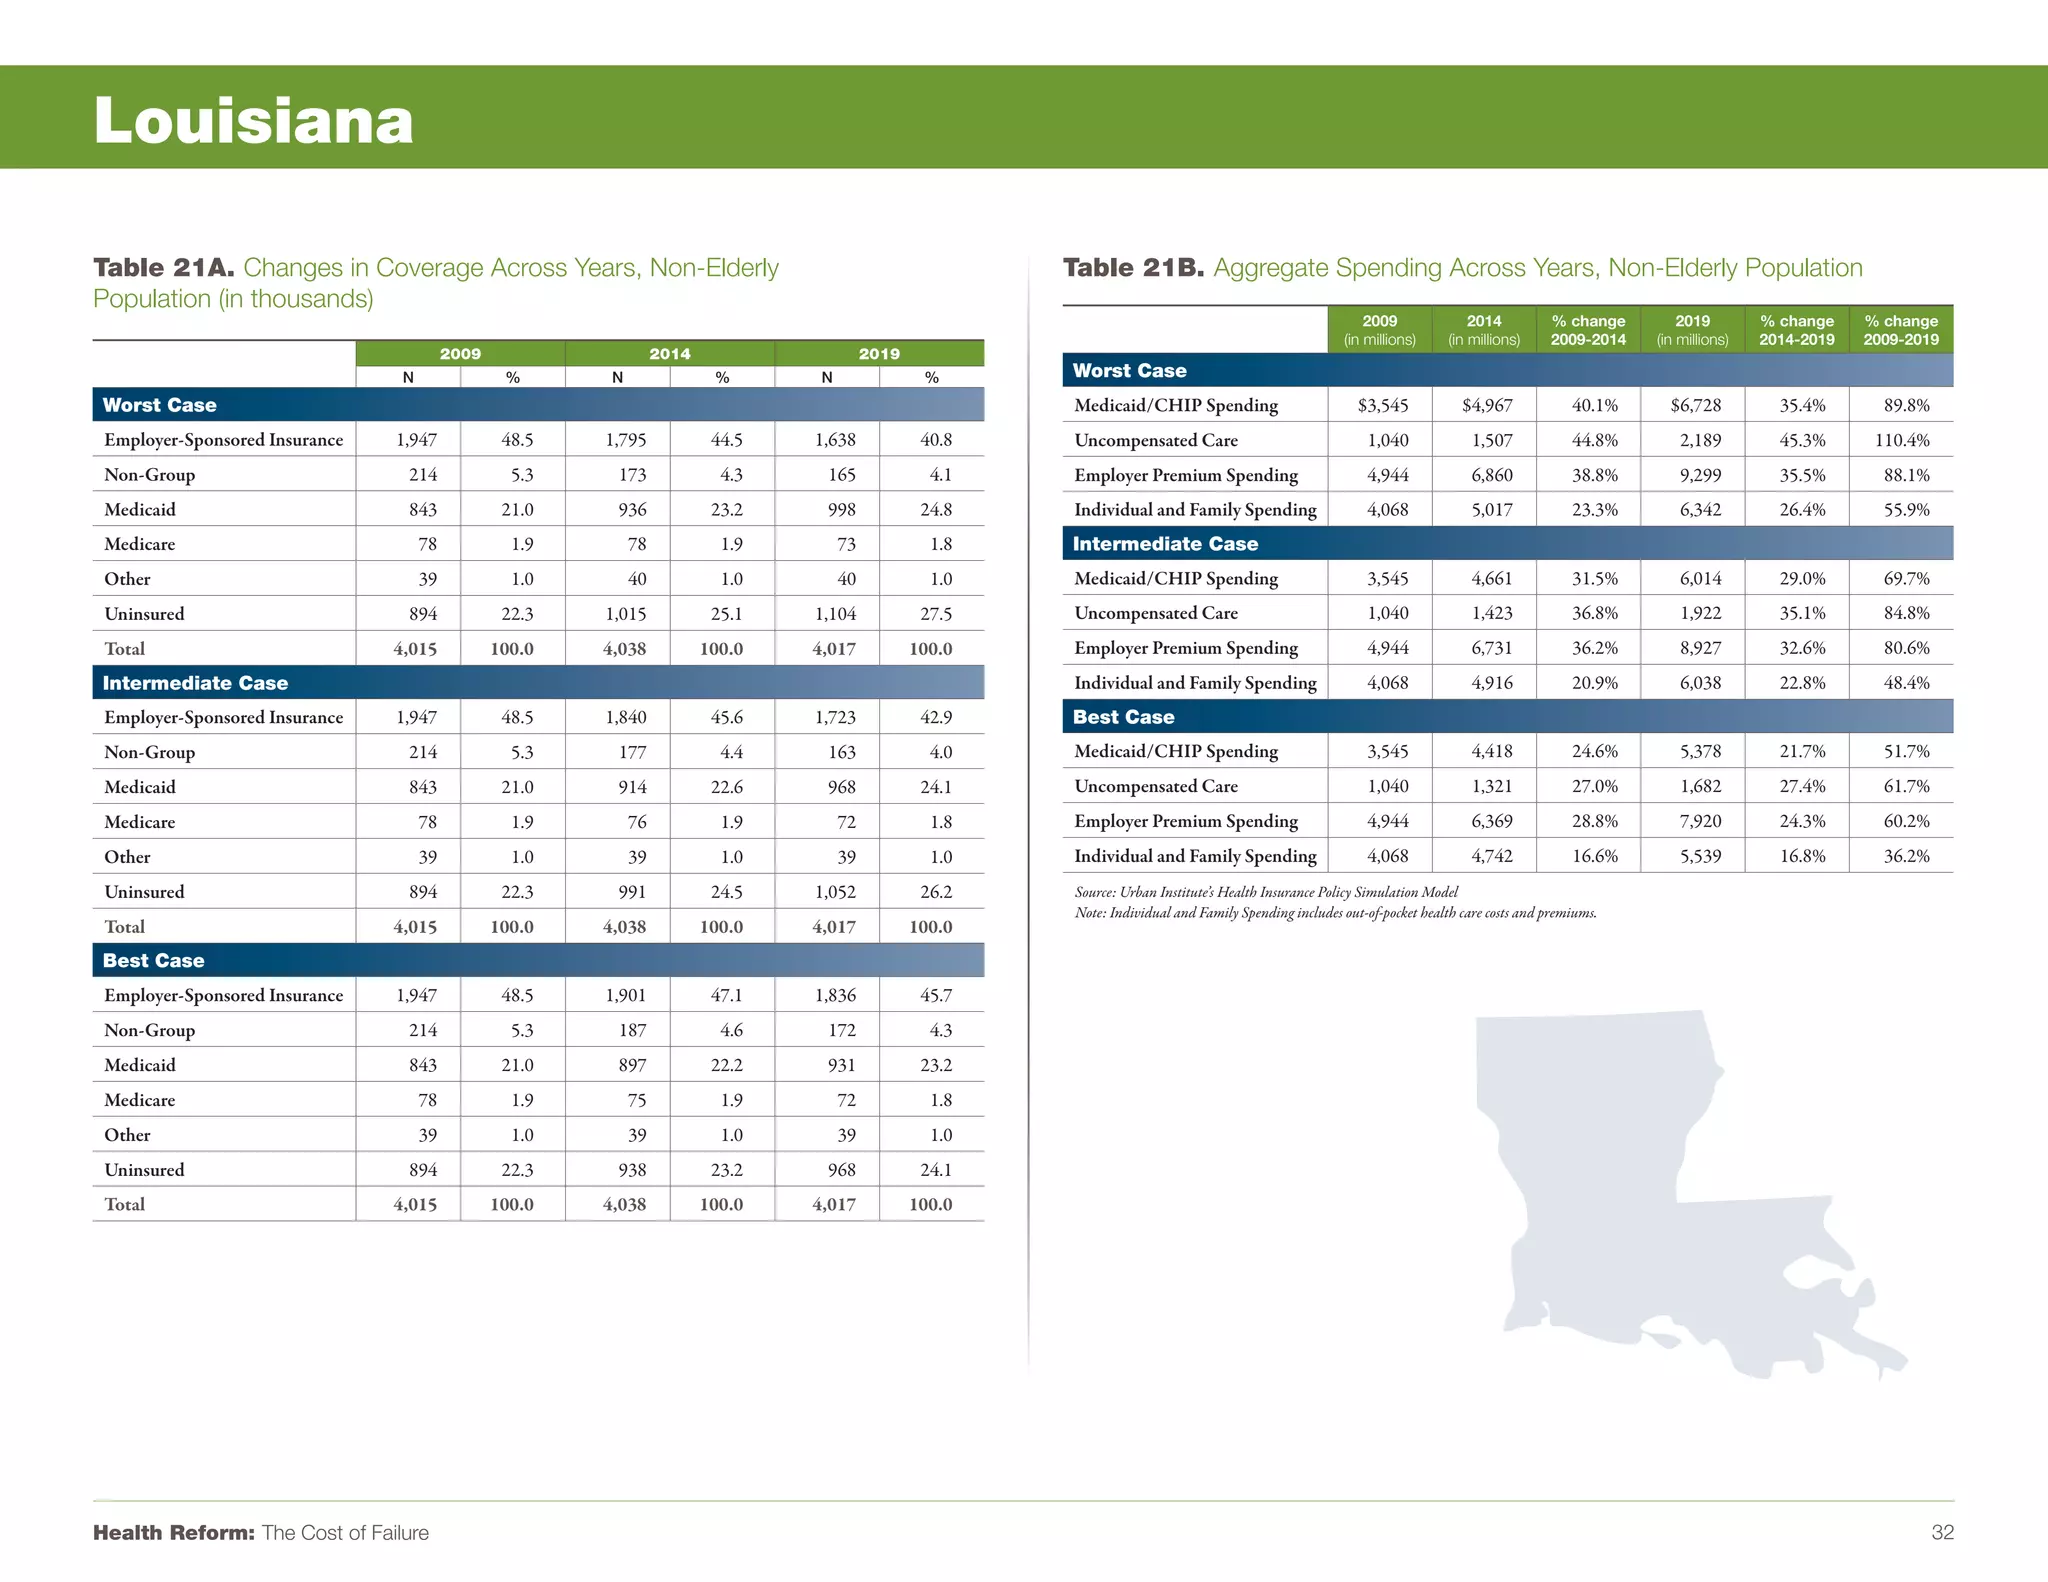
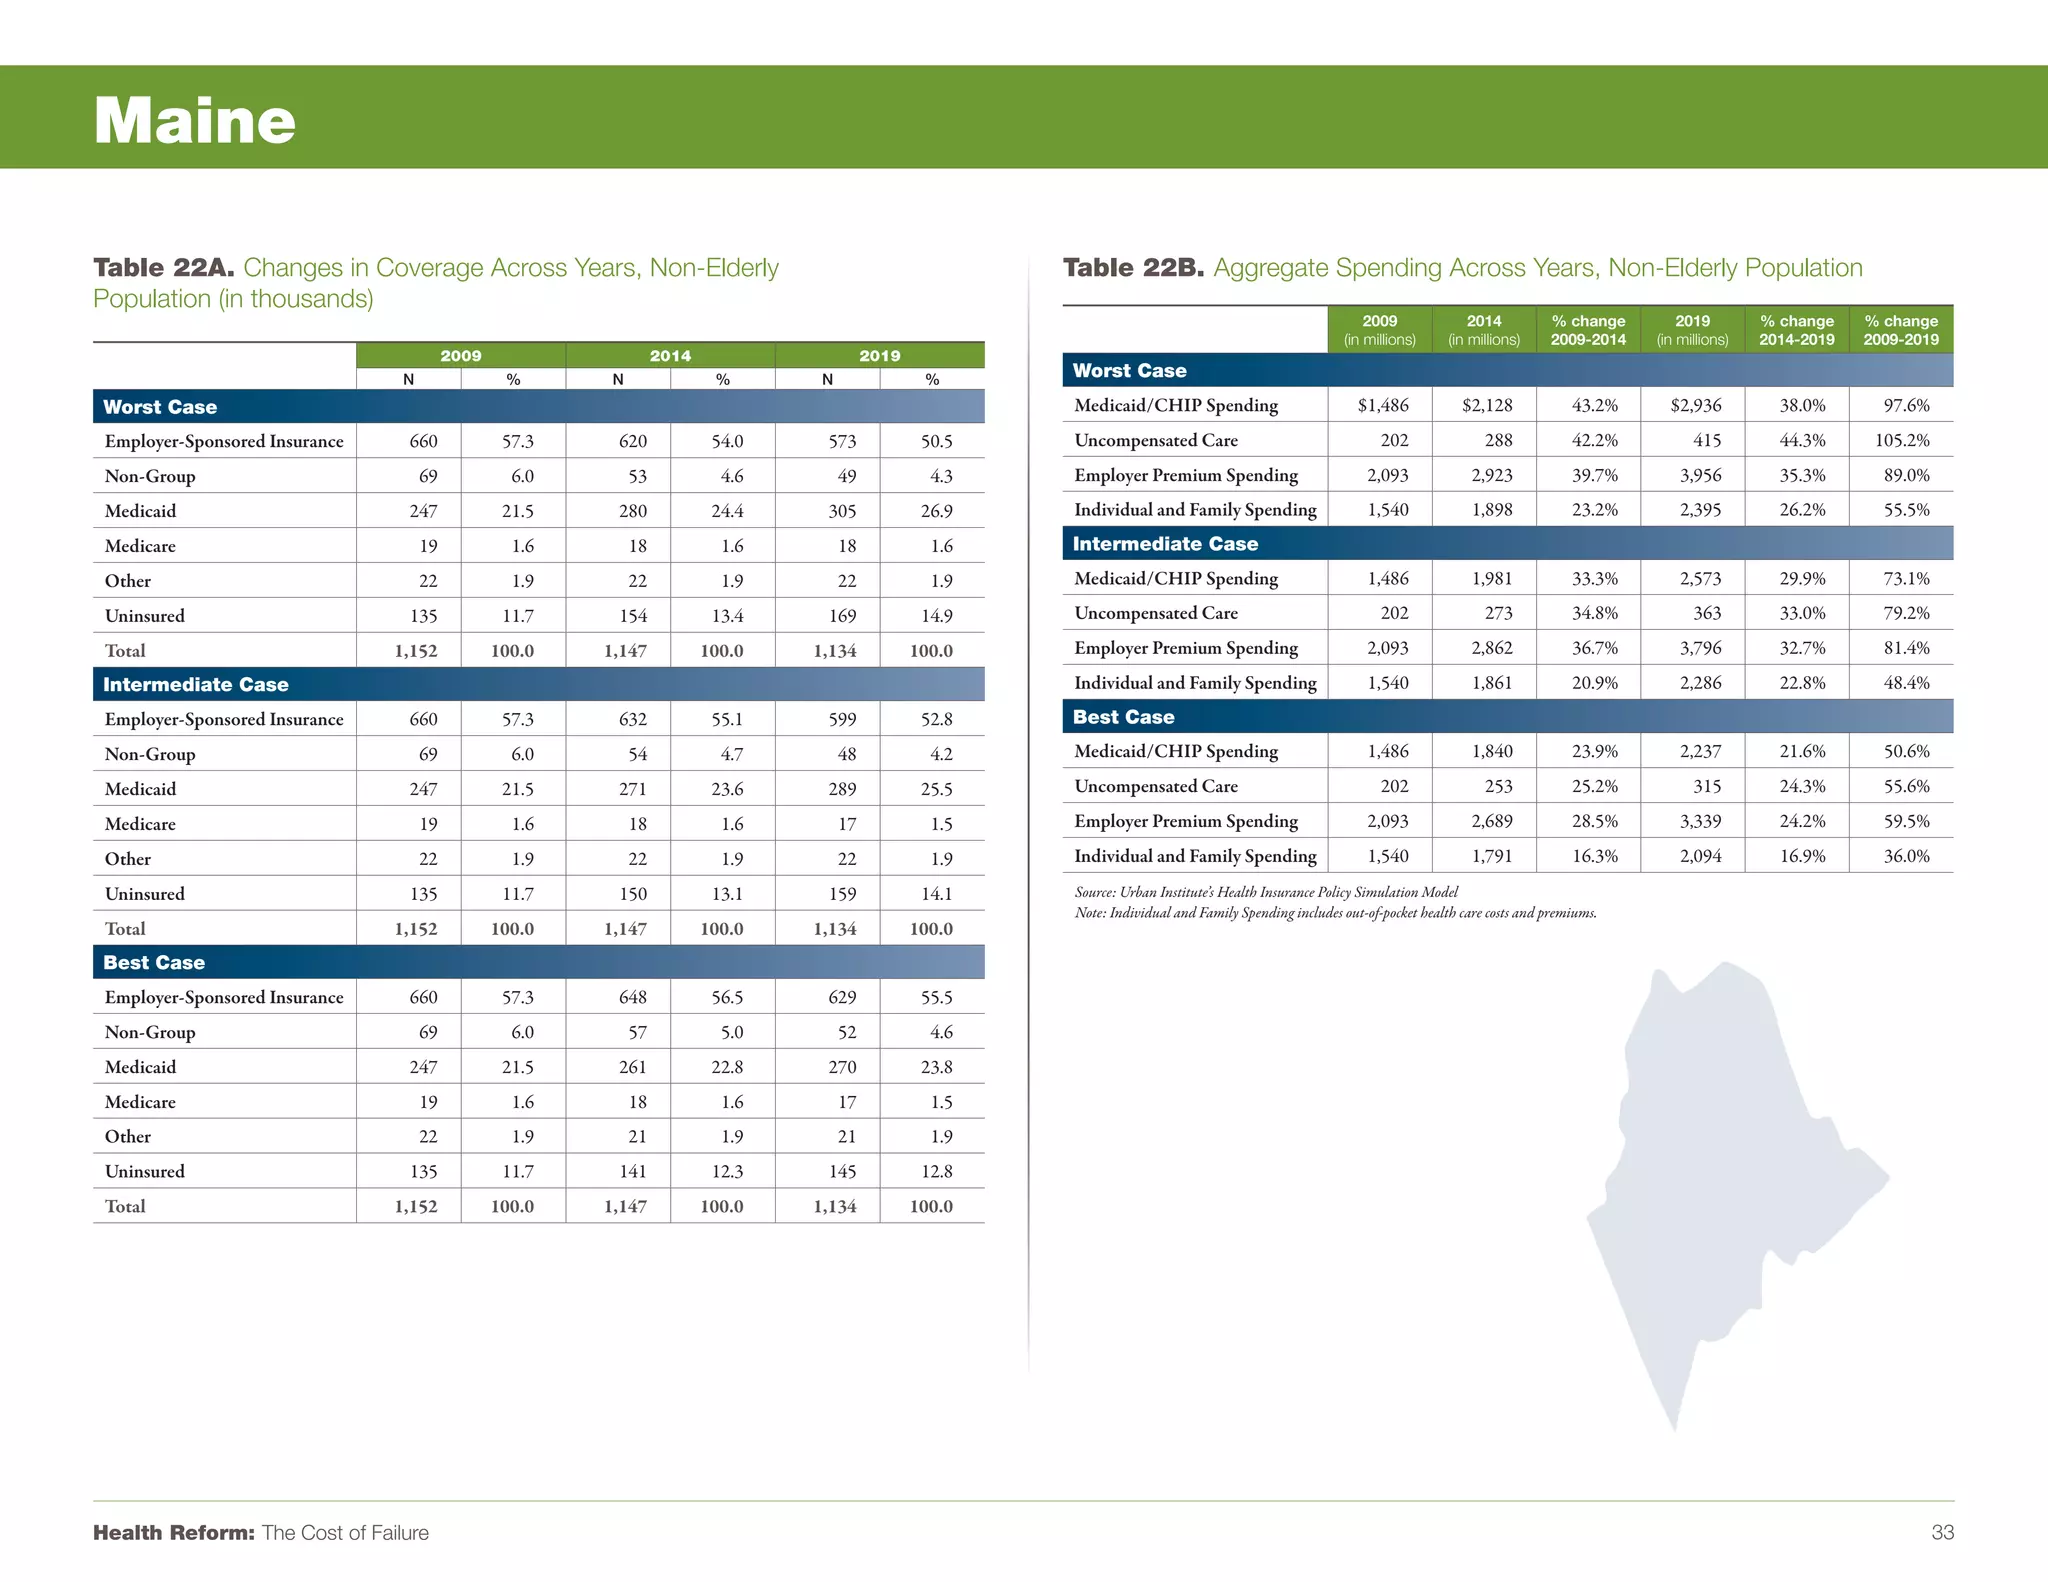
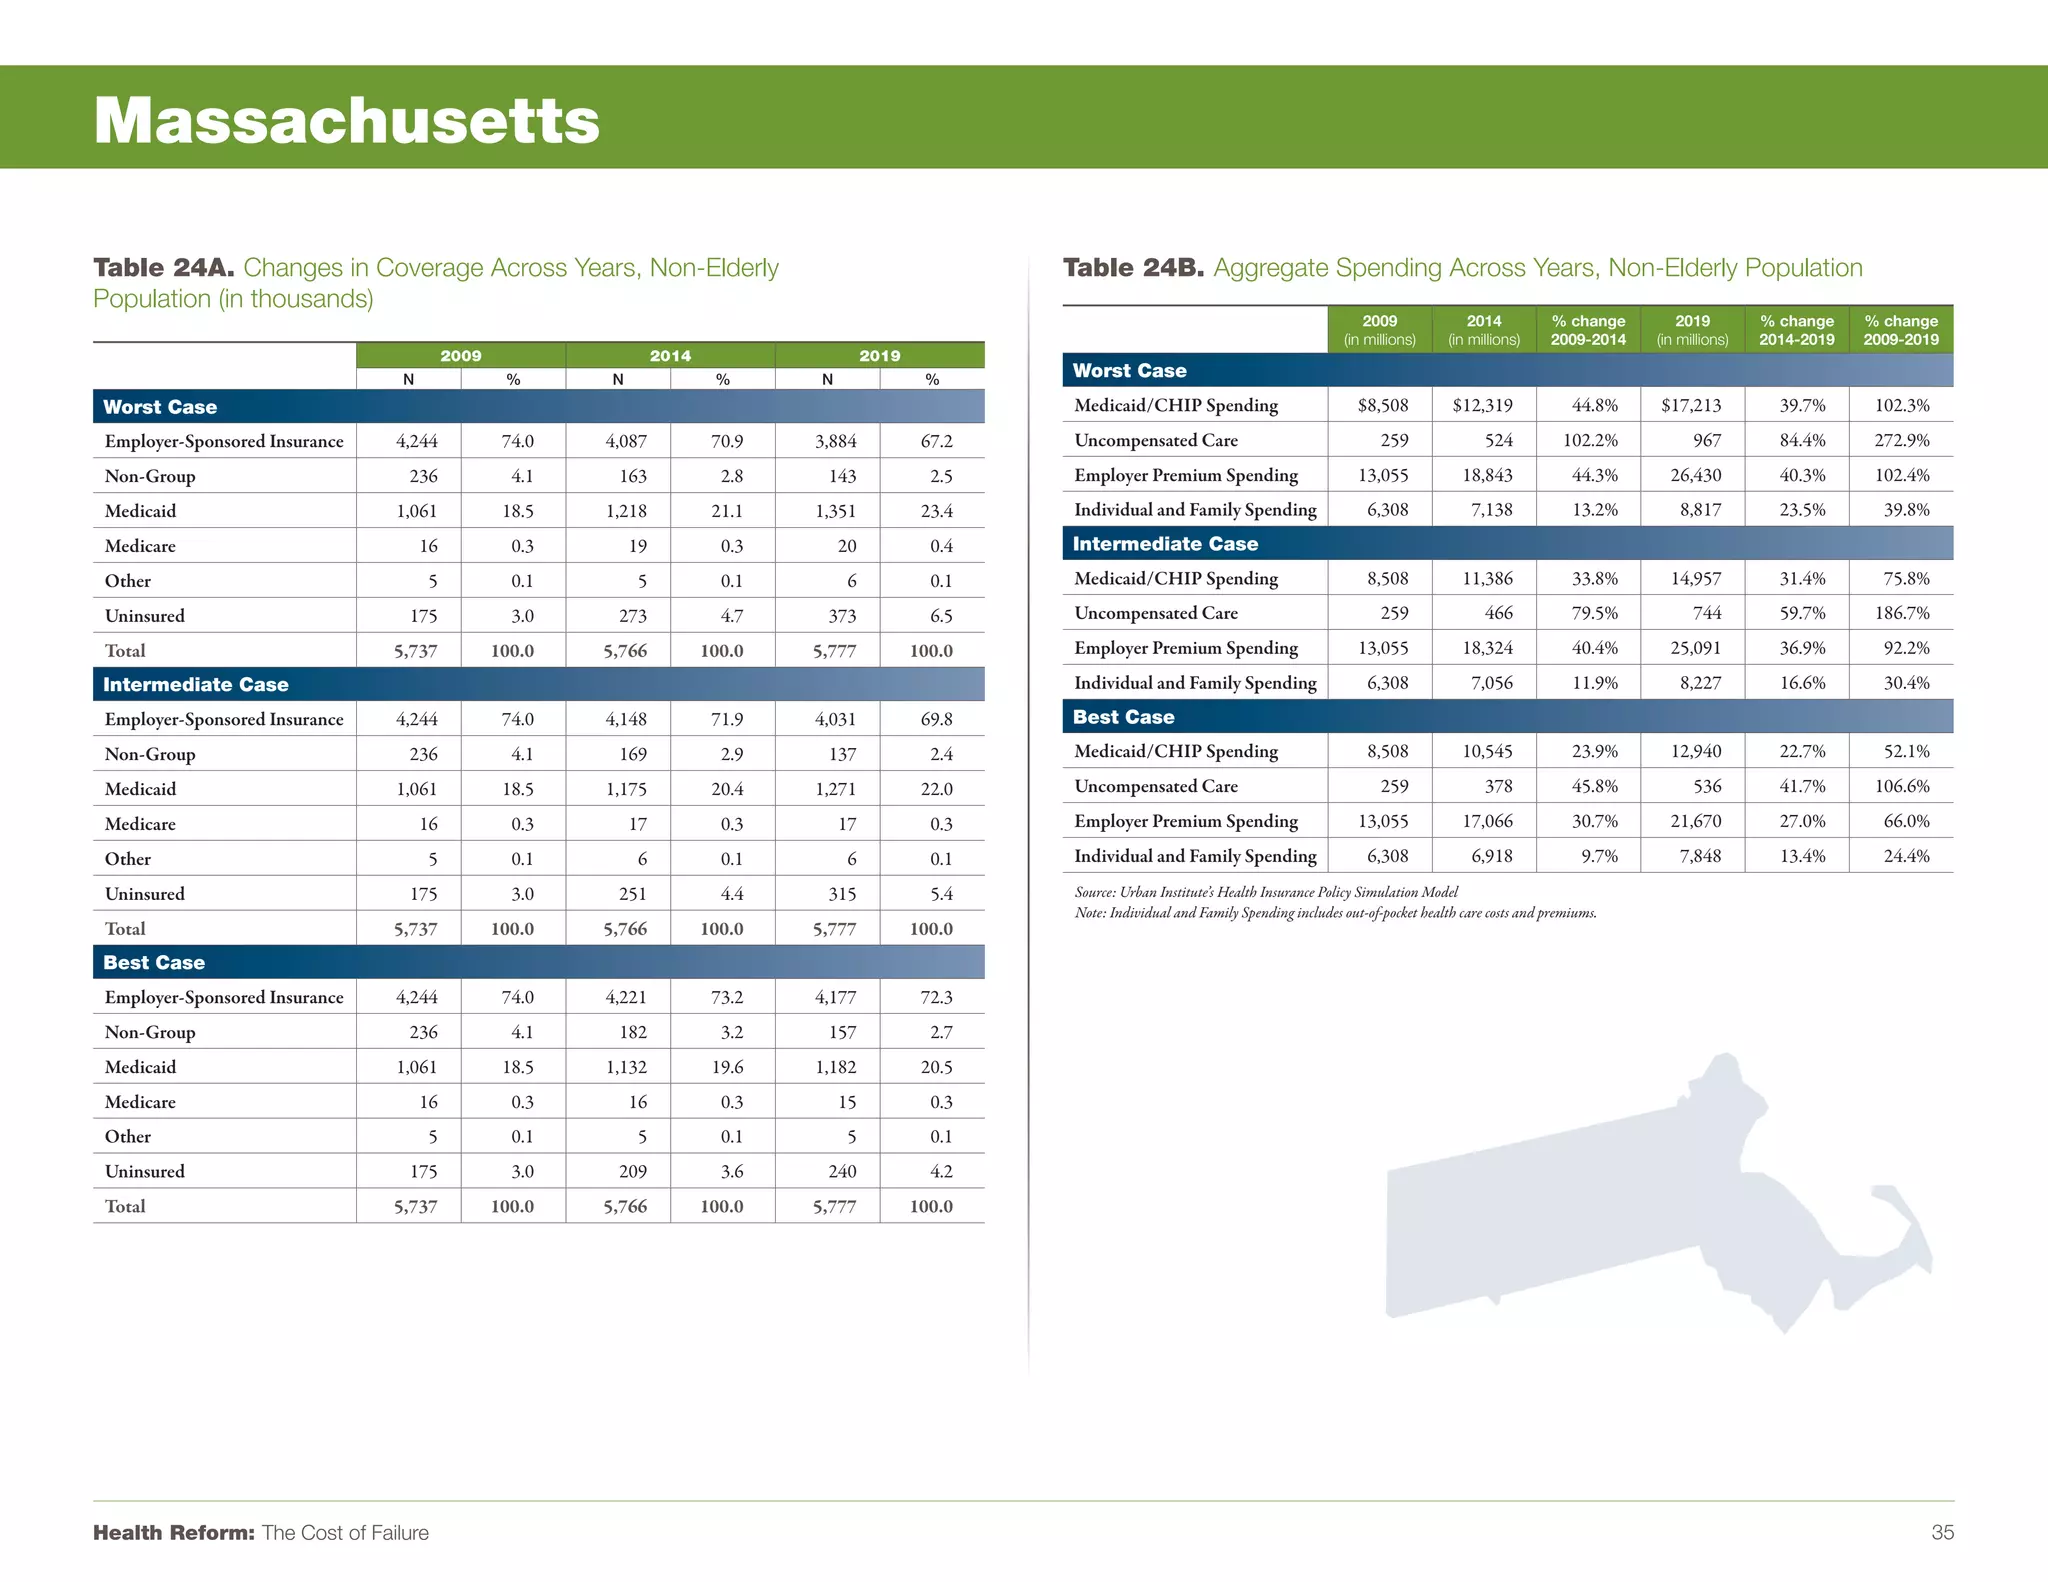
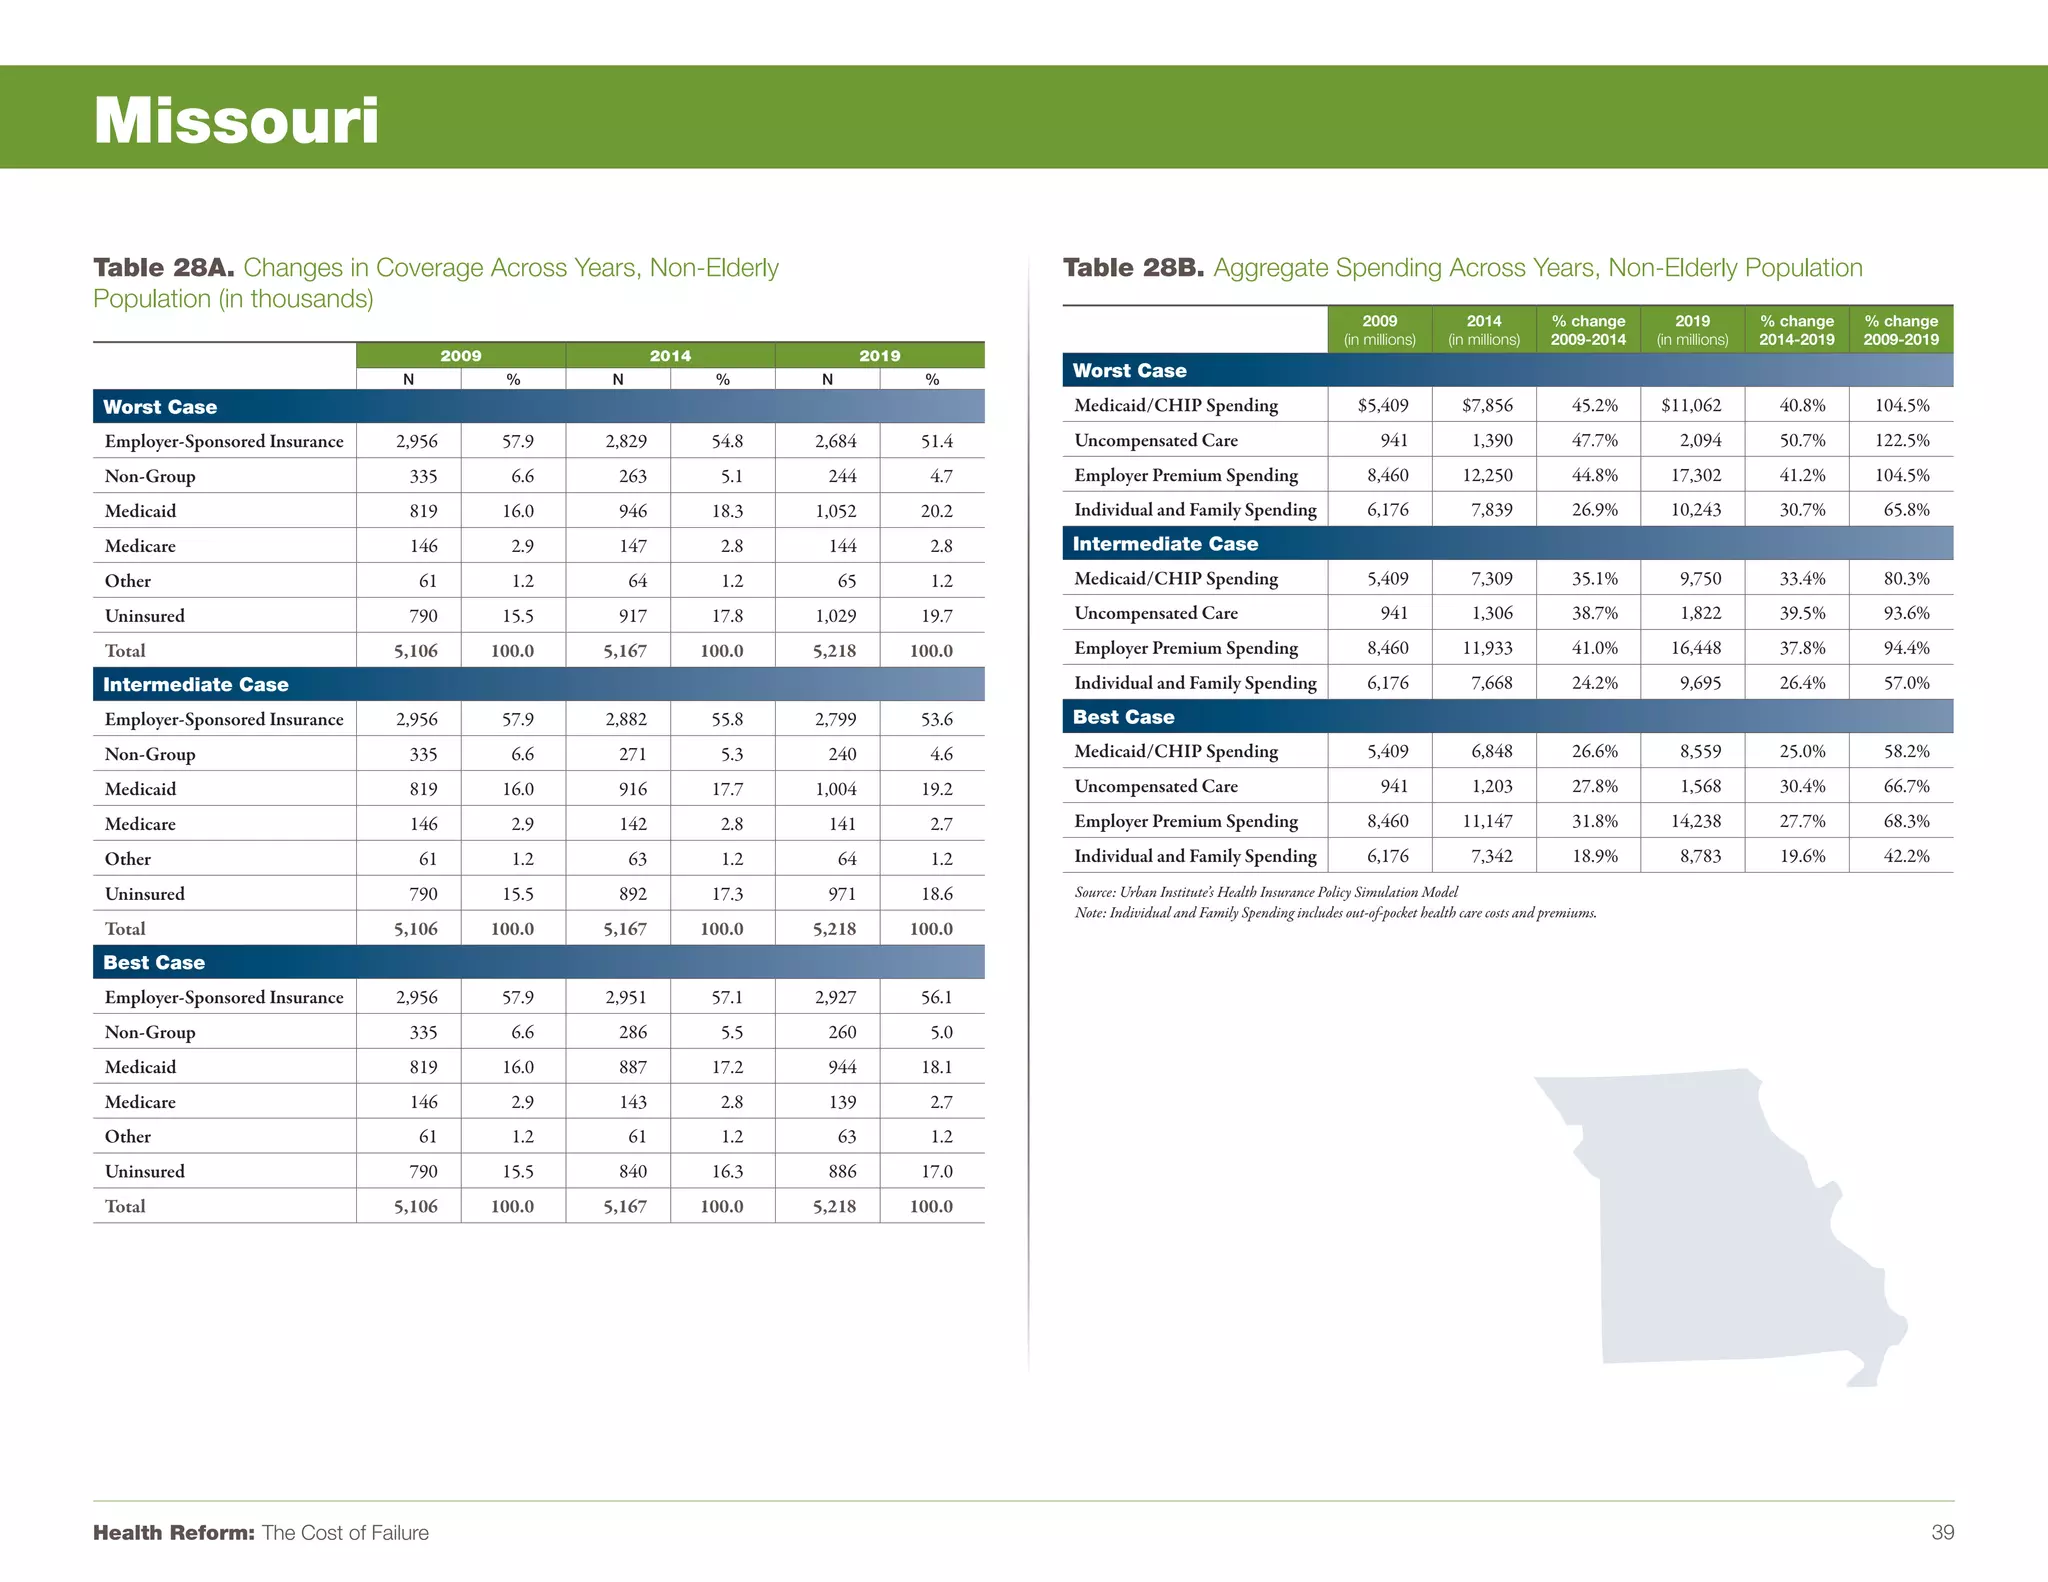
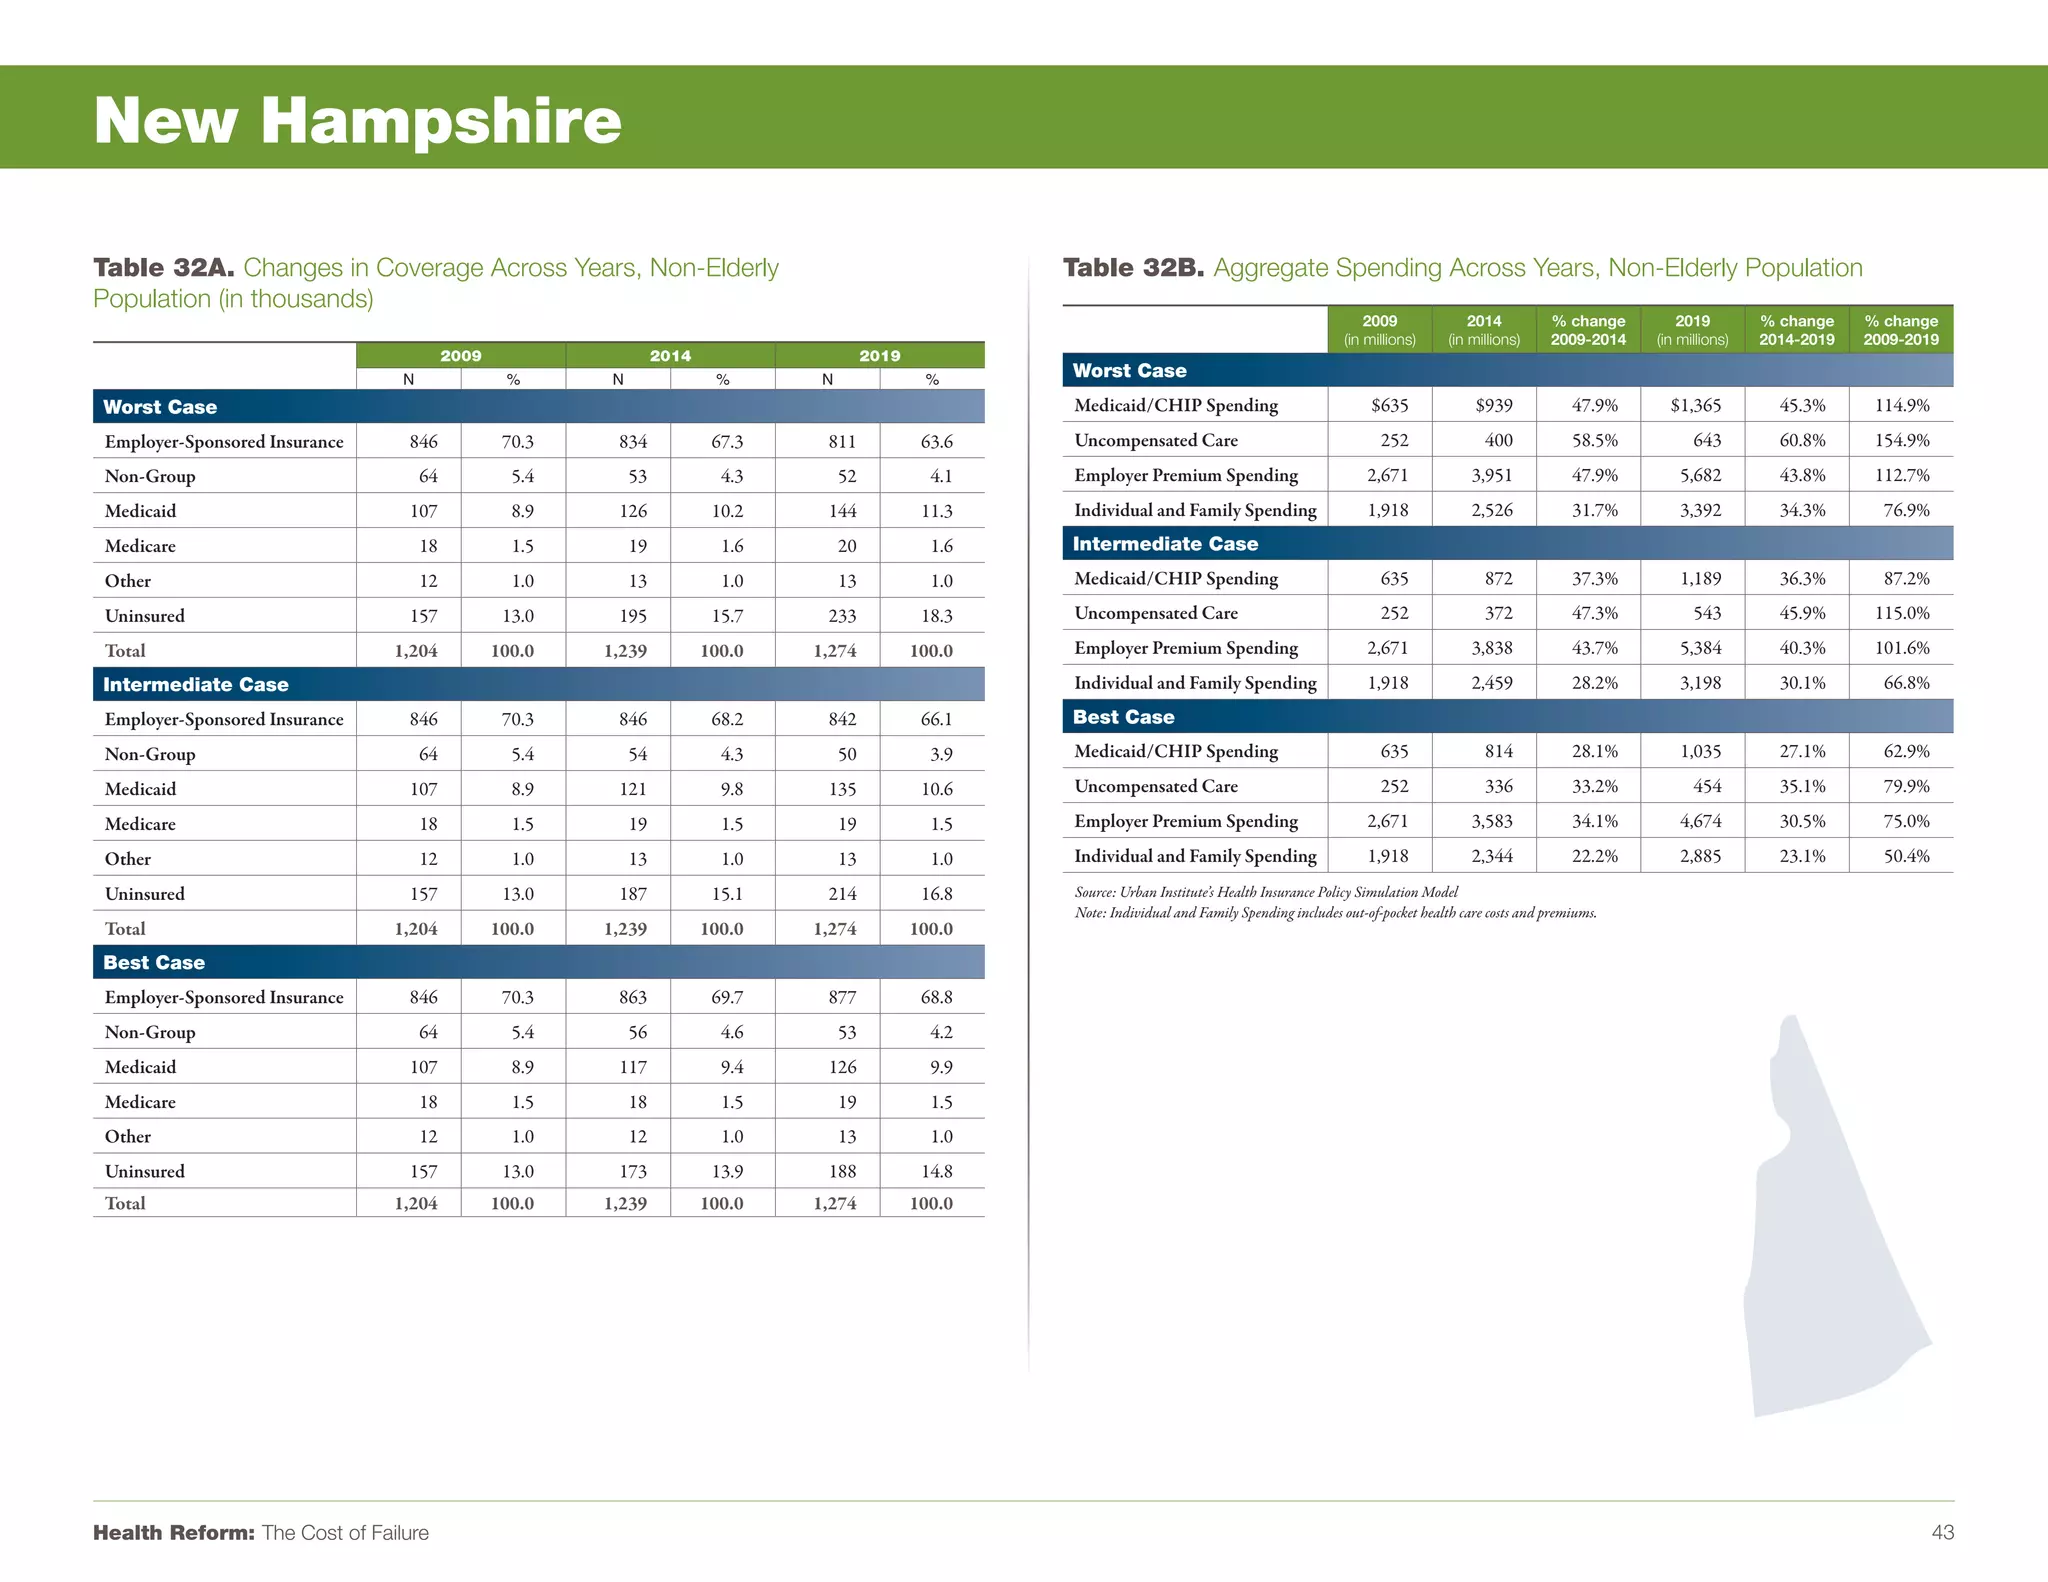
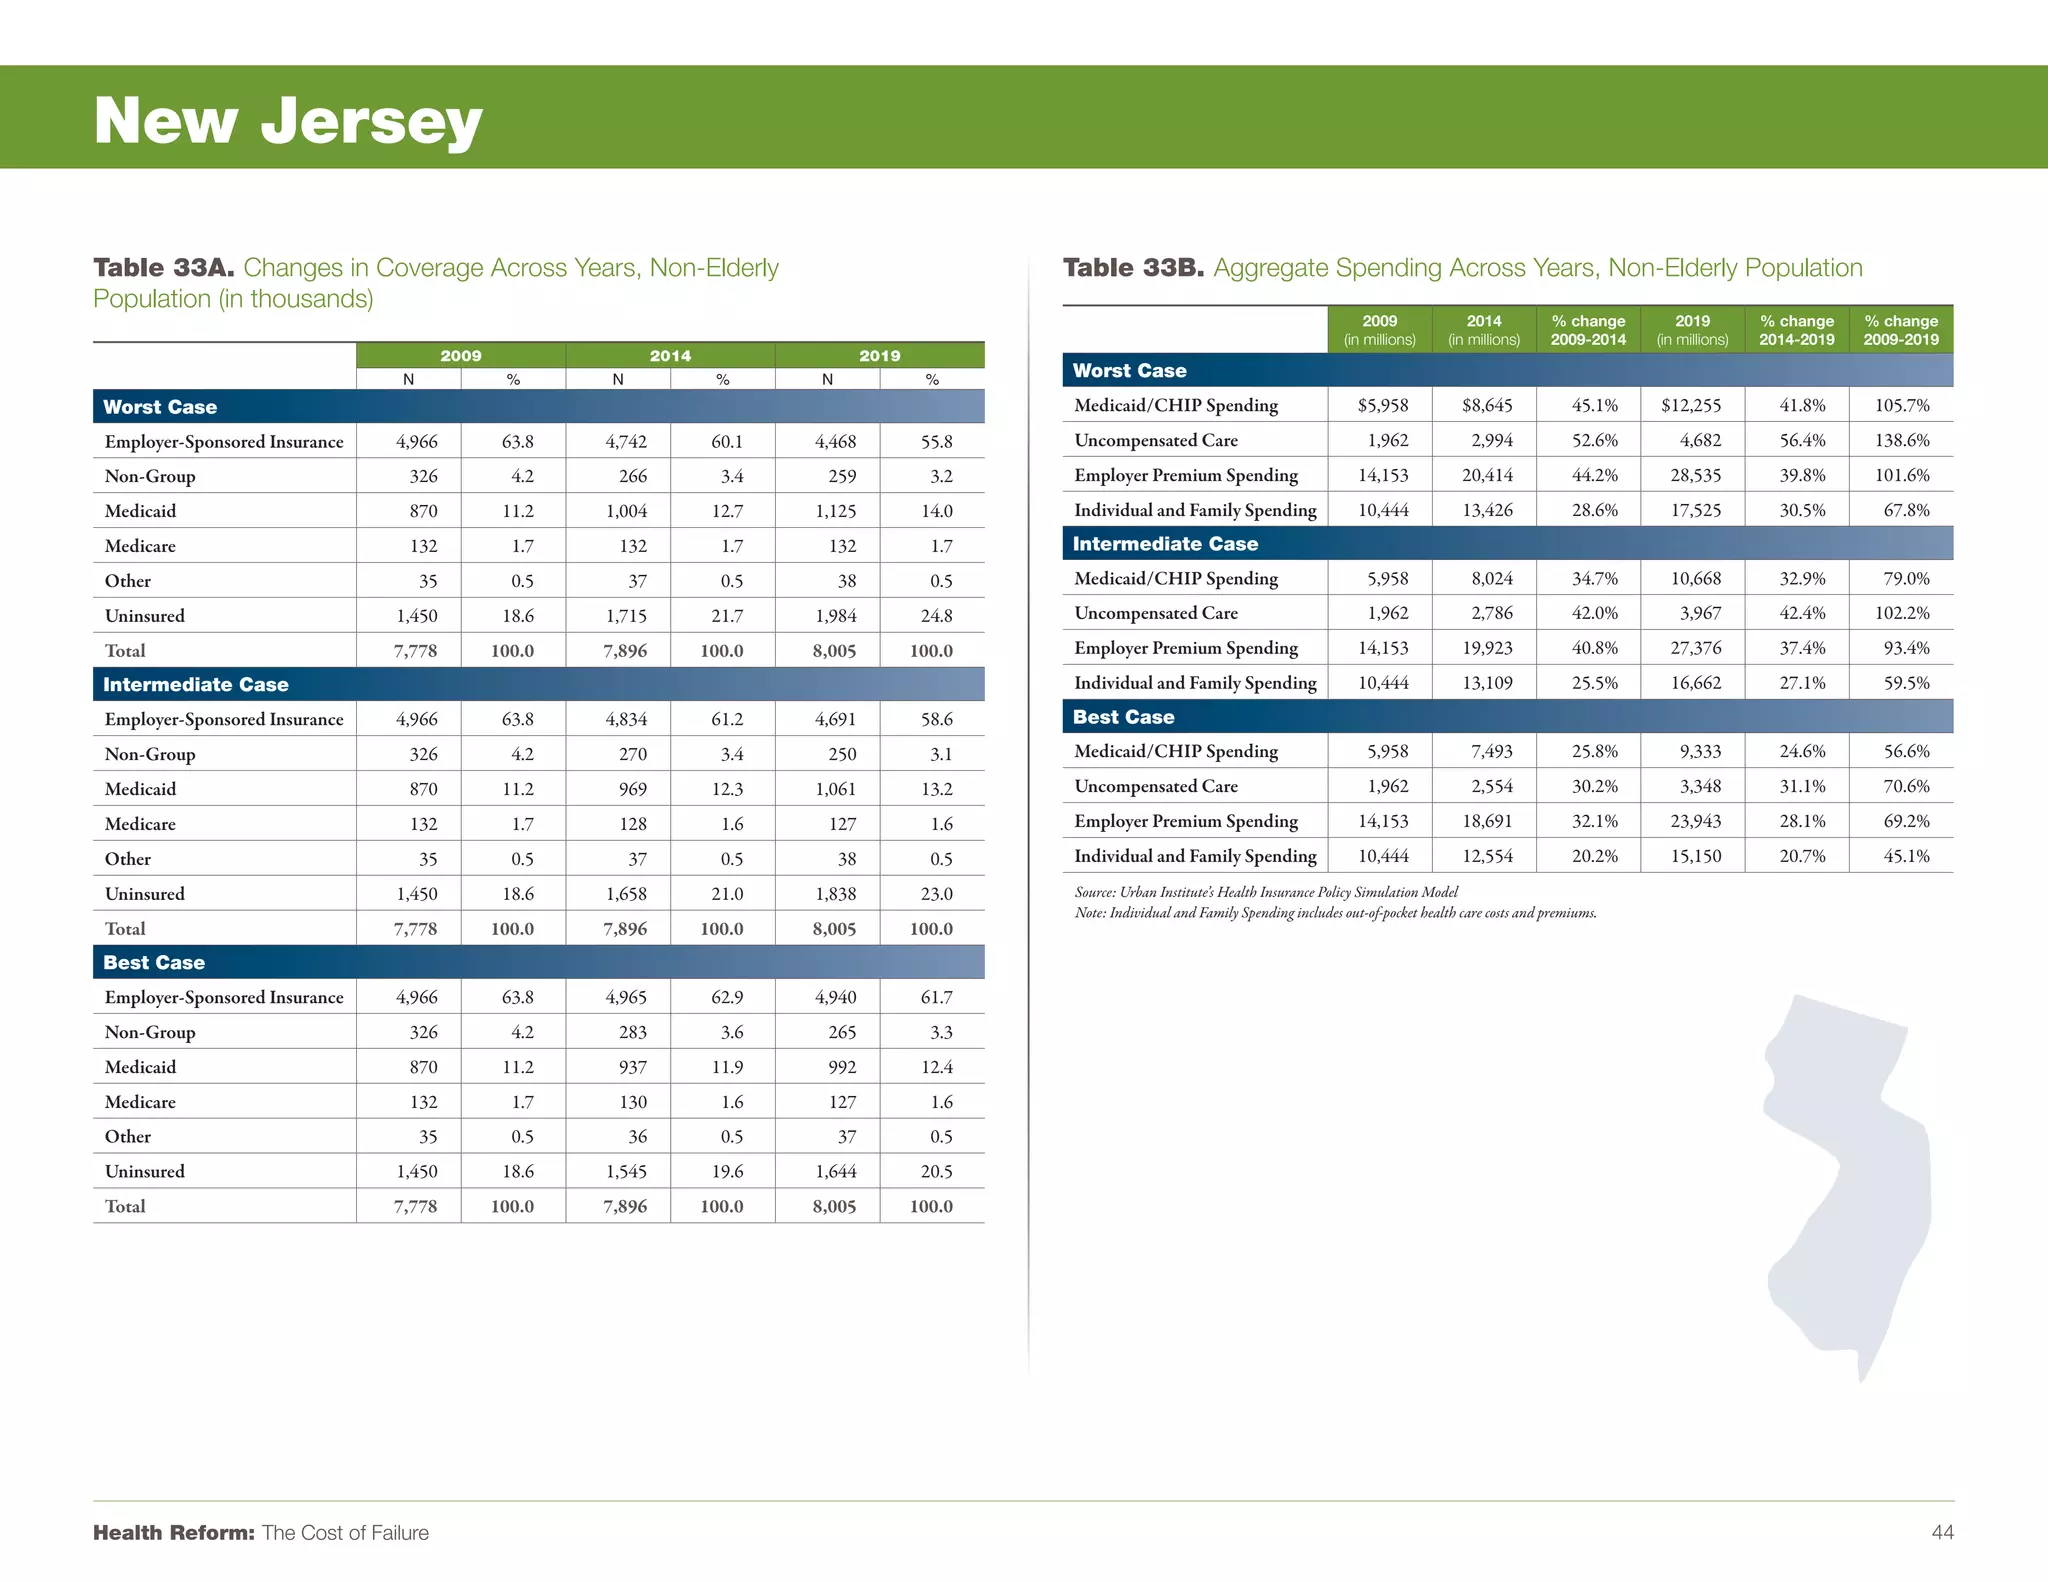
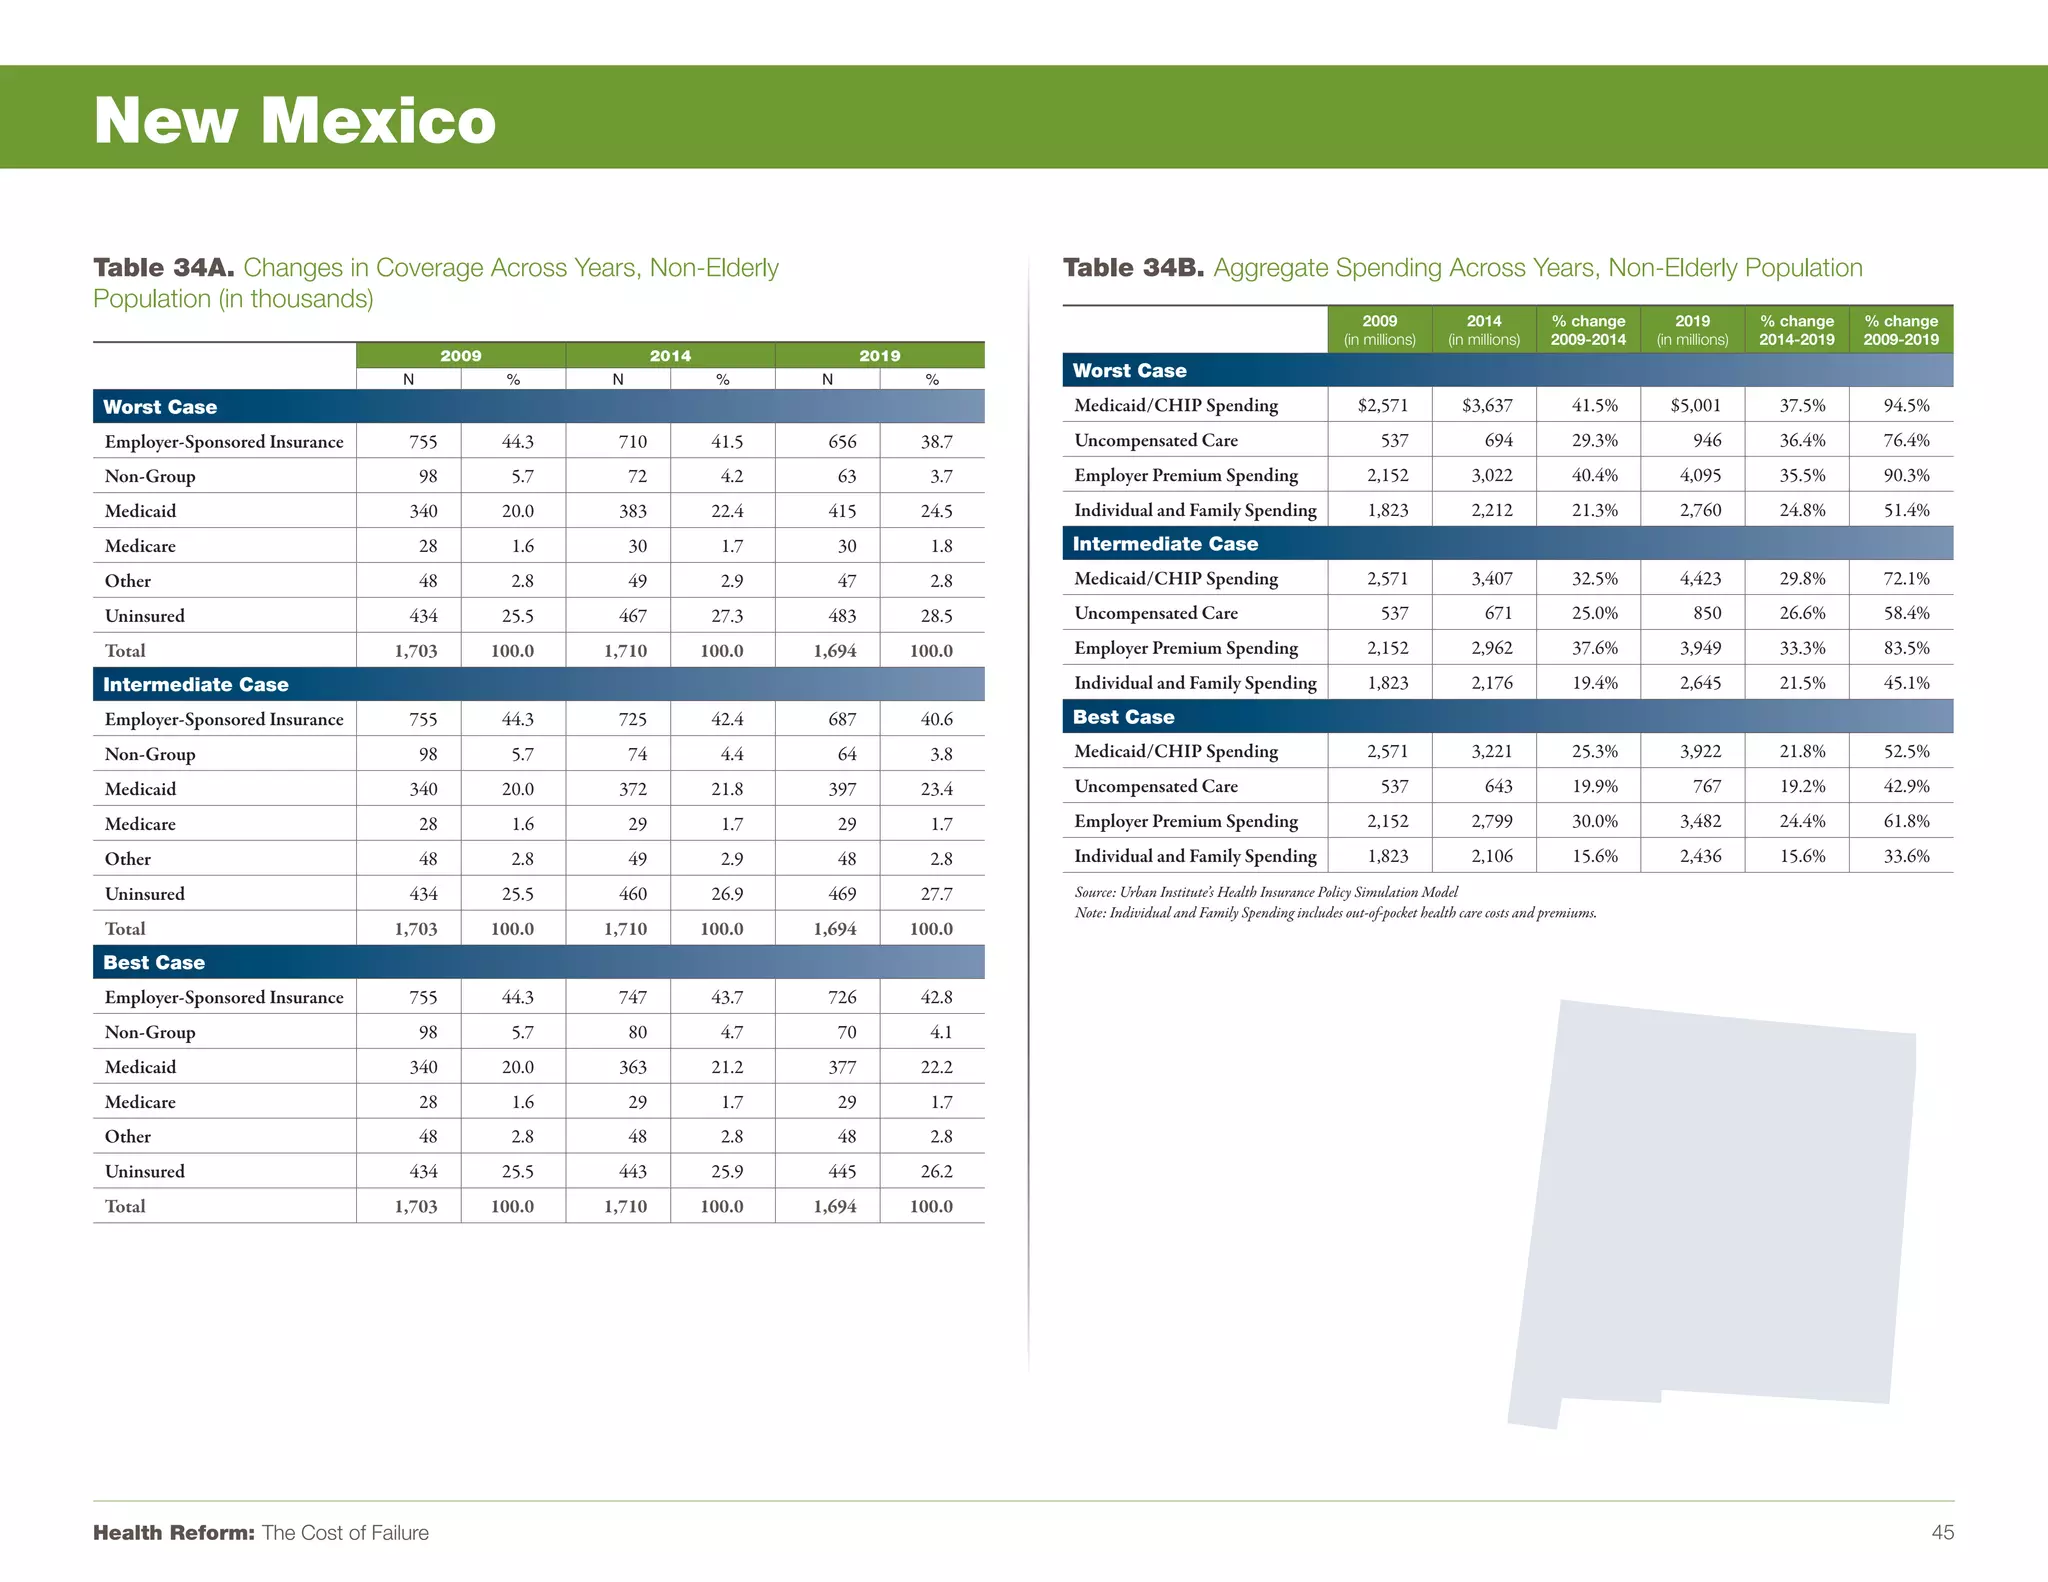
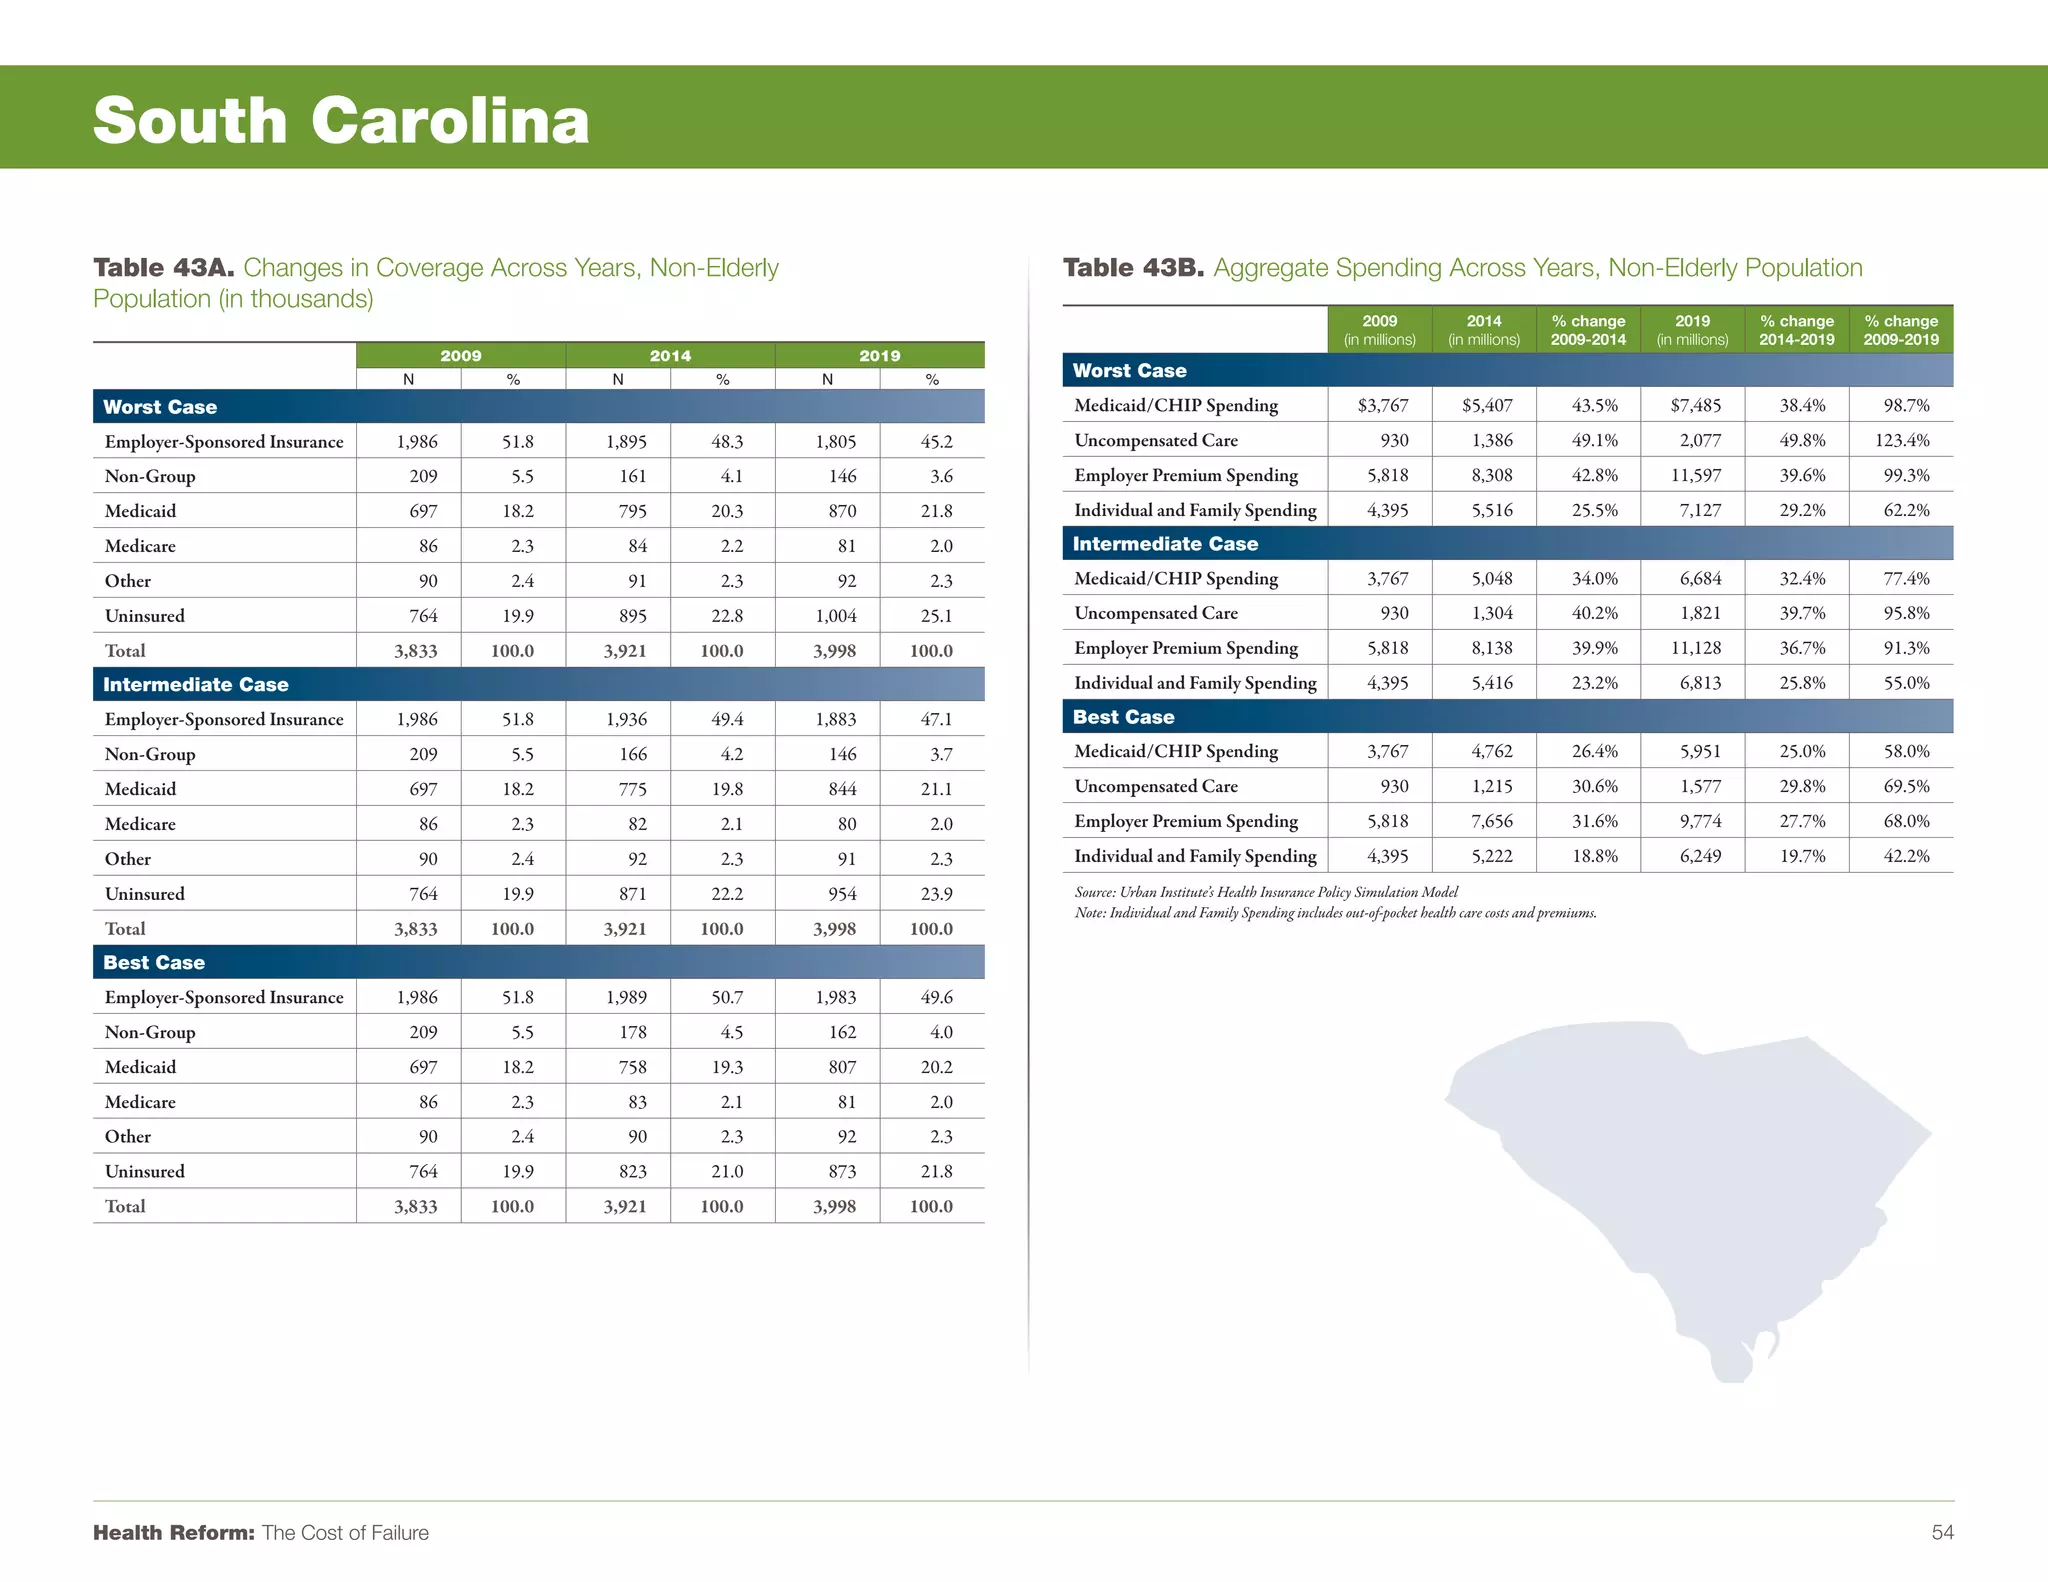
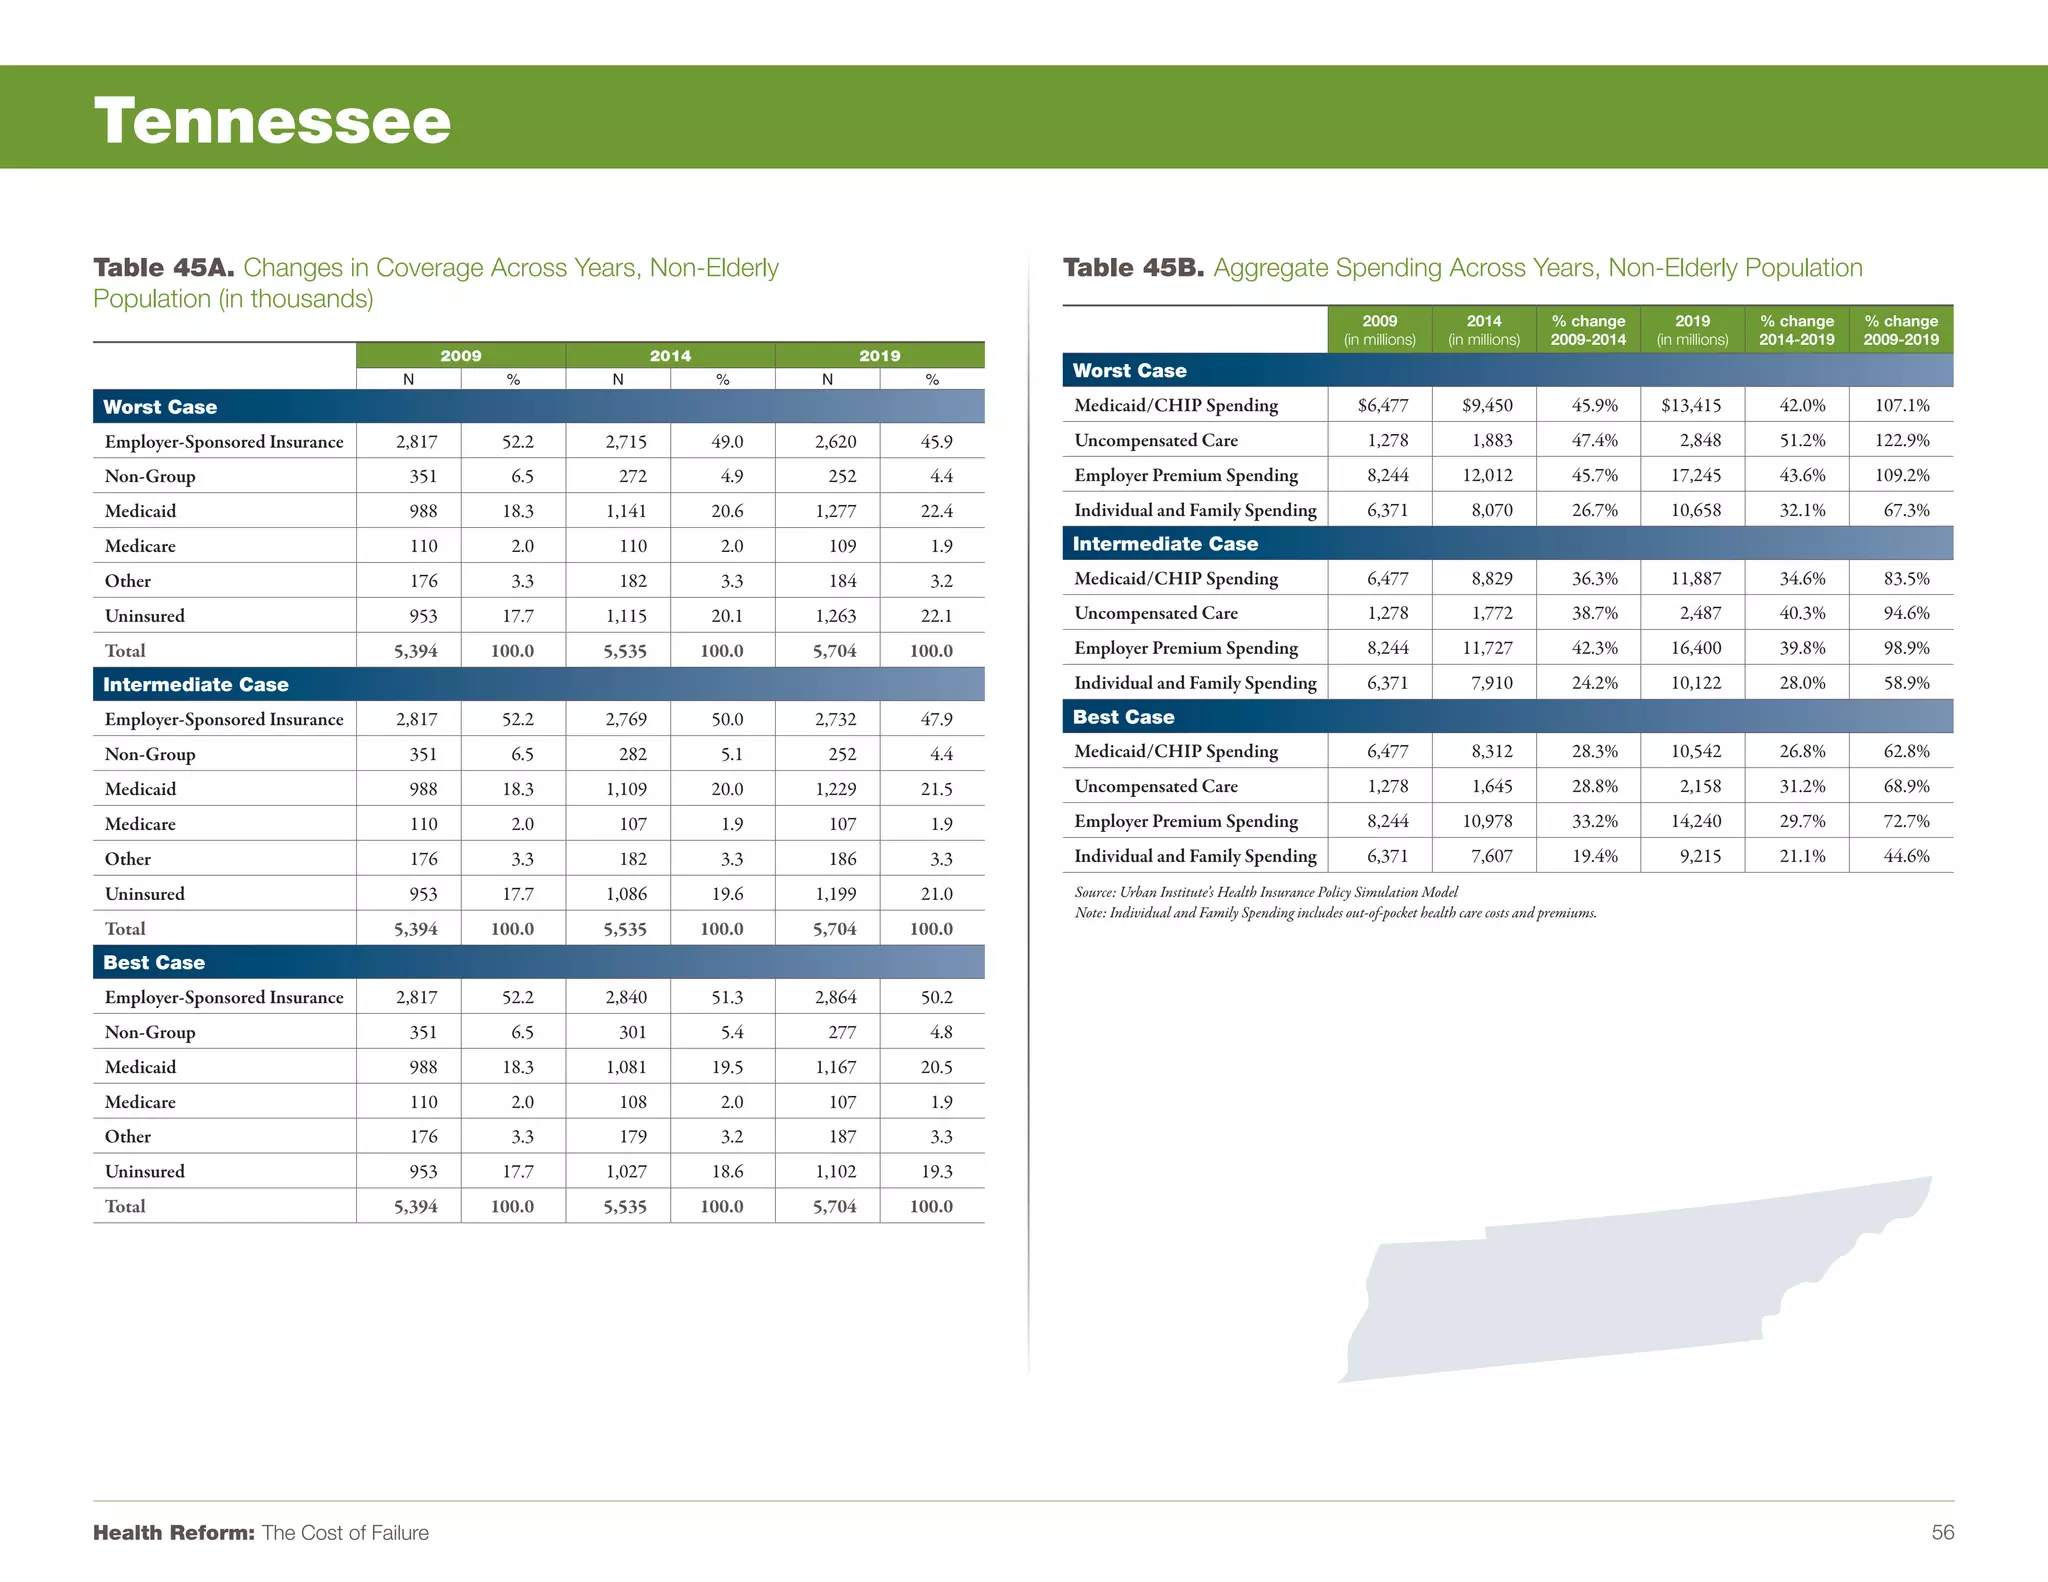
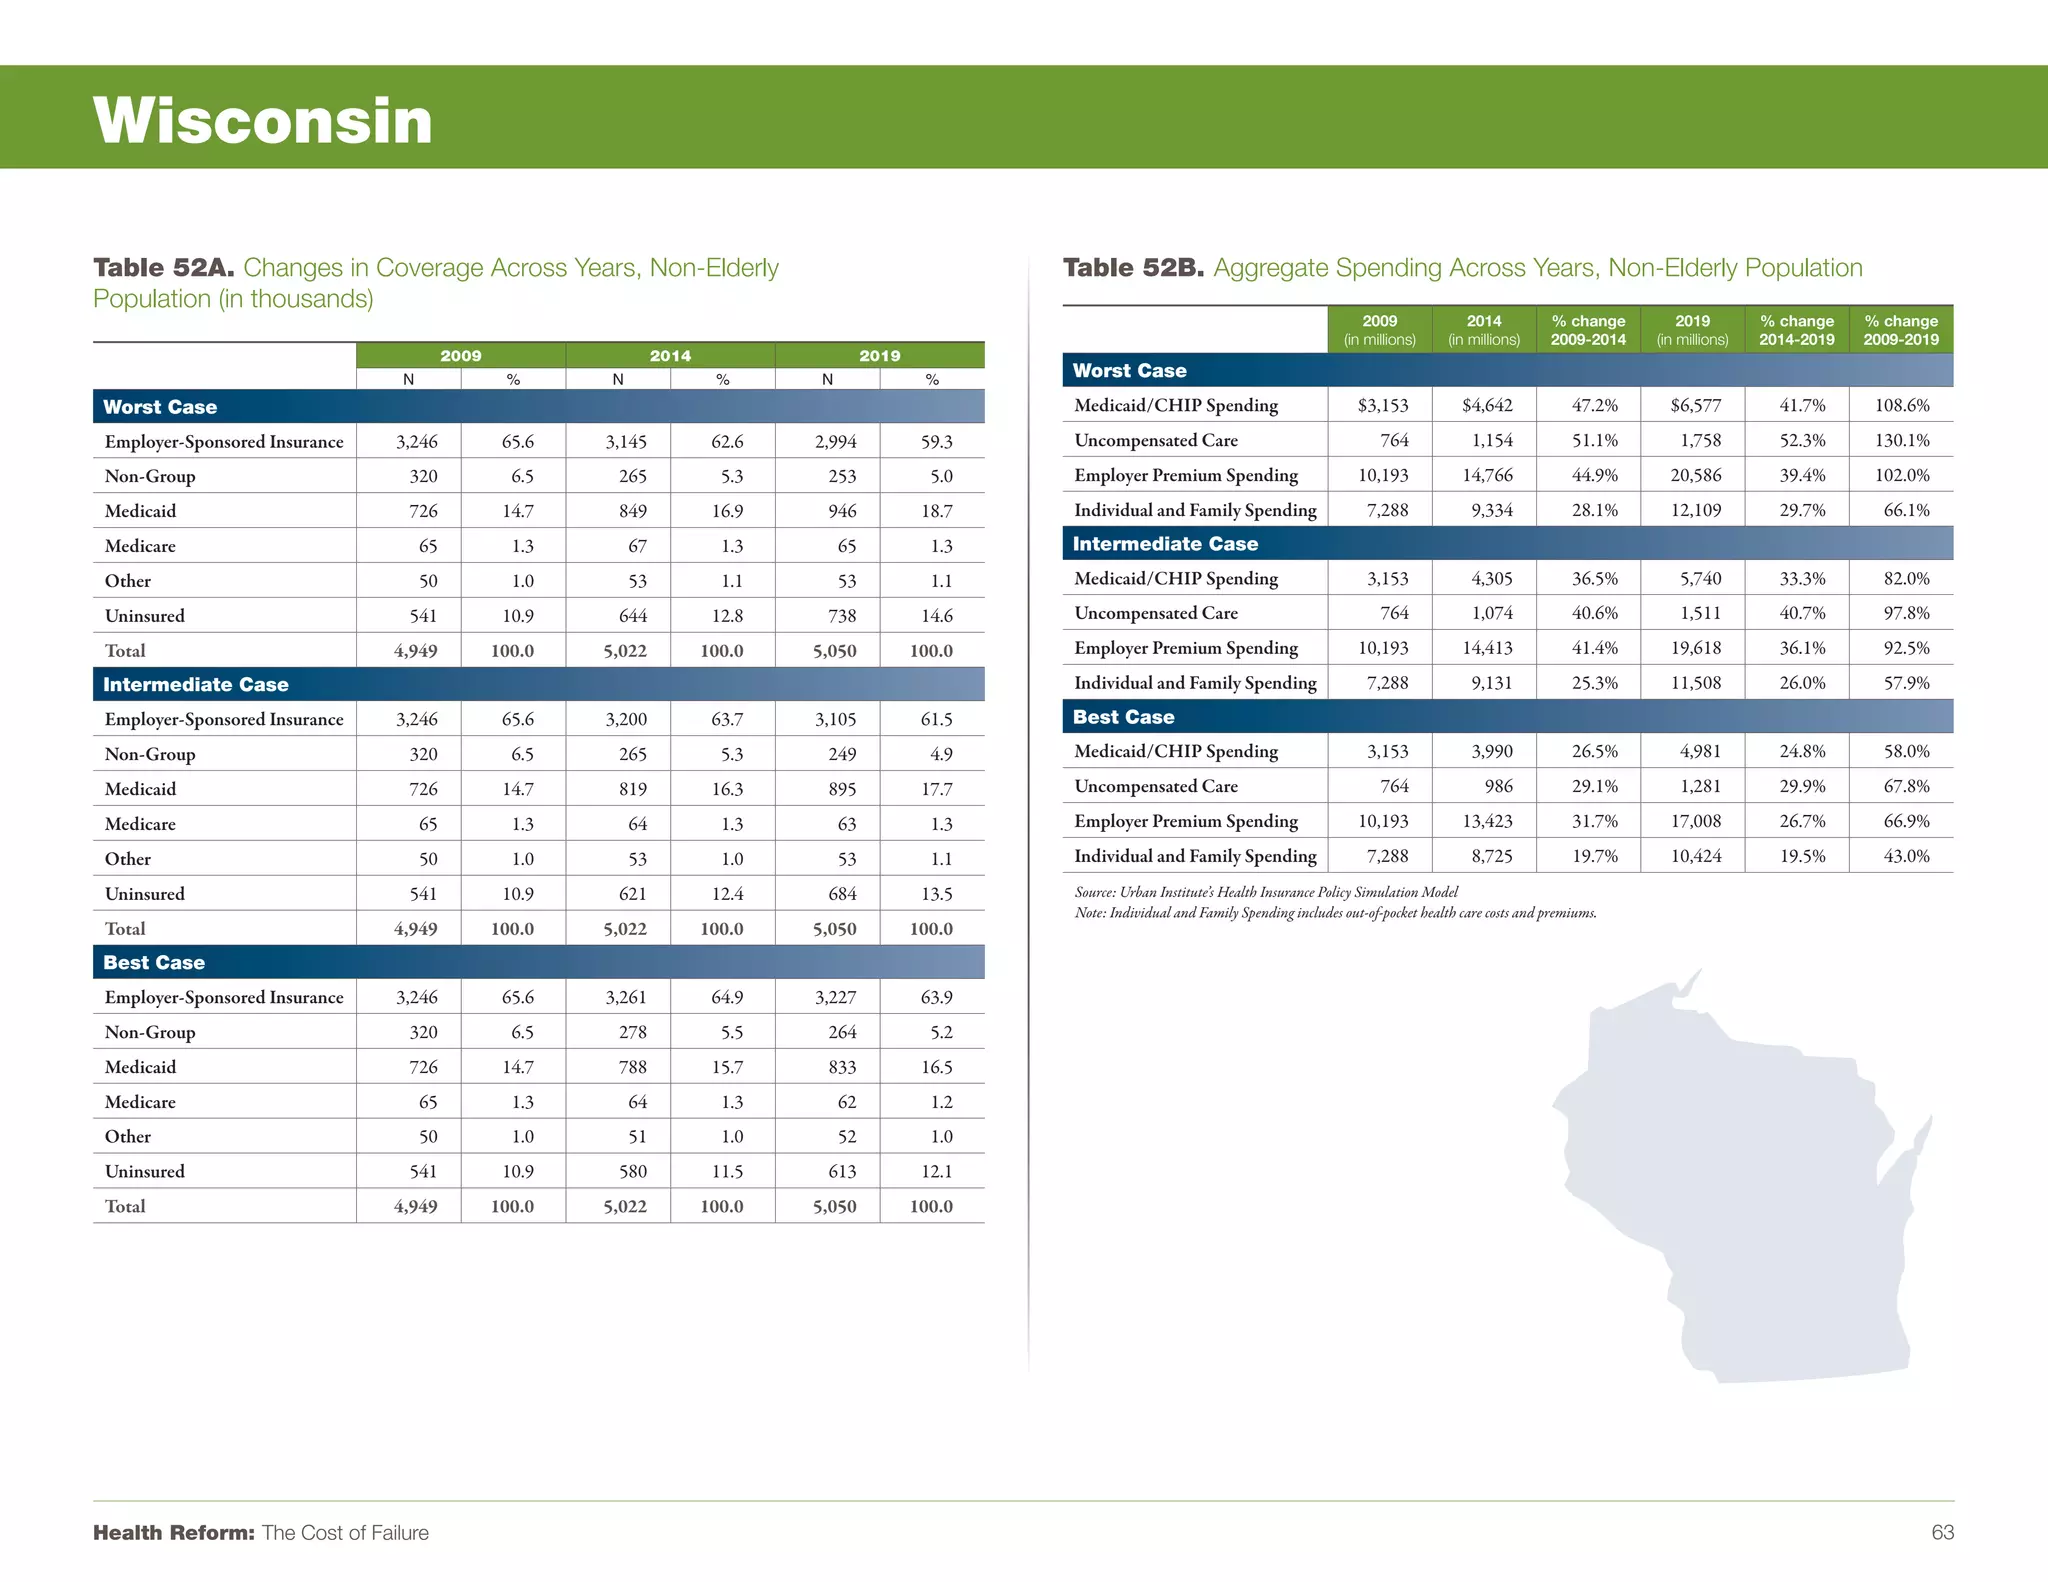
1) The number of uninsured Americans would increase to 65.7 million by 2019, growing by at least 10% in every state. The number of uninsured would increase by over 30% in 29 states.
2) Employer-sponsored health insurance rates would fall substantially nationwide, declining from 56.1% to 49.2% by 2019.
3) Medicaid enrollment would rise significantly across all states, increasing the national Medicaid rate from 16.5% to 20.3% by 2019, with enrollment growing by 13.3 million people. States would see Medicaid spending rise by over 75% by 2019 under half of the states seeing increases over 100%.