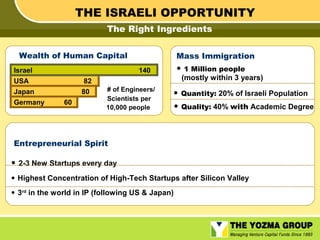
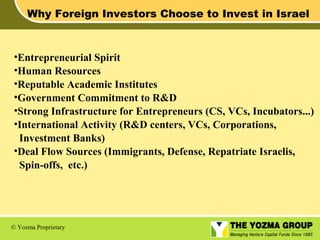
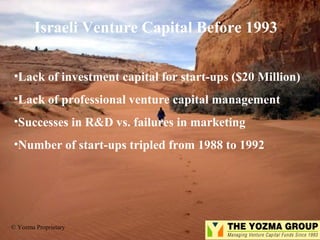
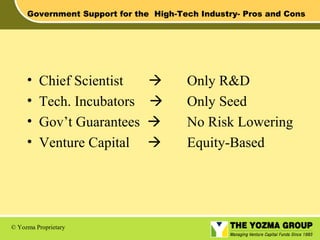
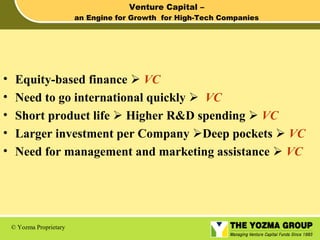
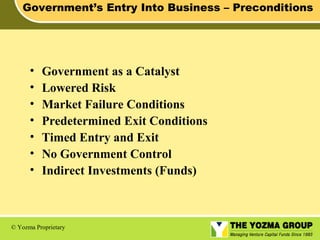
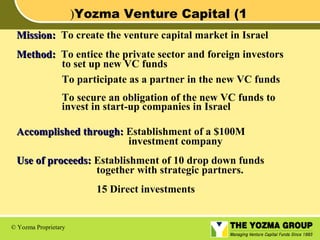
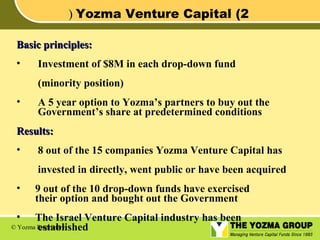
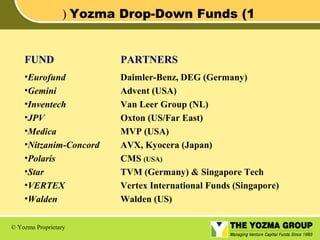
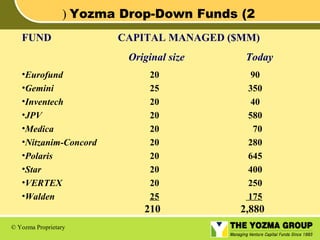
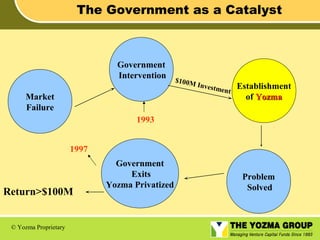
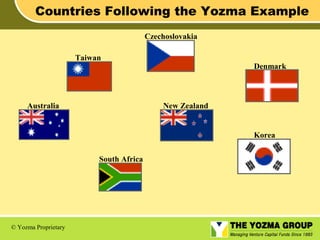
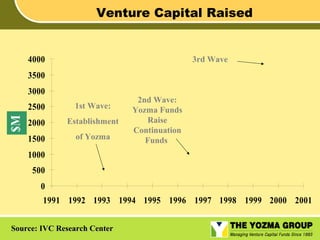
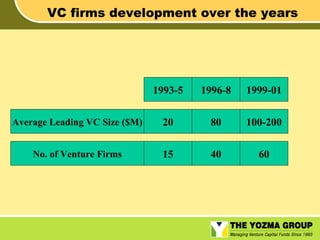
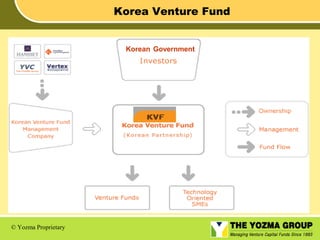
The Yozma Program Success Factors & Policy
Presented by:
Yigal Erlich
the Yozma Group
Tel Aviv, Israel
THE ISRAELI OPPORTUNITY
The Right Ingredients
Wealth of Human Capital
Israel
USA
Japan
Germany

Mass Immigration

•

140
82
80
60

# of Engineers/
Scientists per
10,000 people

•
•

1 Million people

(mostly within 3 years)
Quantity: 20% of Israeli Population
Quality: 40% with Academic Degree

Entrepreneurial Spirit

• 2-3 New Startups every day
• Highest Concentration of High-Tech Startups after Silicon Valley
• 3rd in the world in IP (following US & Japan)
Why Foreign Investors Choose to Invest in Israel

•Entrepreneurial Spirit
•Human Resources
•Reputable Academic Institutes
•Government Commitment to R&D
•Strong Infrastructure for Entrepreneurs (CS, VCs, Incubators...)
•International Activity (R&D centers, VCs, Corporations,
Investment Banks)
•Deal Flow Sources (Immigrants, Defense, Repatriate Israelis,
Spin-offs, etc.)

© Yozma Proprietary
Deal Flow Sources
Repatriate
Israelis
Defense

Corporations

Deal Flow
Sources

Spin-offs
R&D centers

Universities
New
Immigrants
© Yozma Proprietary
Israeli Venture Capital Before 1993
•Lack of investment capital for start-ups ($20 Million)
•Lack of professional venture capital management
•Successes in R&D vs. failures in marketing
•Number of start-ups tripled from 1988 to 1992

© Yozma Proprietary
Government Support for the High-Tech Industry- Pros and Cons

•
•
•
•

Chief Scientist
Tech. Incubators
Gov’t Guarantees
Venture Capital

© Yozma Proprietary






Only R&D
Only Seed
No Risk Lowering
Equity-Based
Venture Capital –
an Engine for Growth for High-Tech Companies

•
•
•
•
•

Equity-based finance  VC
Need to go international quickly  VC
Short product life  Higher R&D spending  VC
Larger investment per Company Deep pockets  VC
Need for management and marketing assistance  VC

© Yozma Proprietary
Government’s Entry Into Business – Preconditions

•
•
•
•
•
•
•

Government as a Catalyst
Lowered Risk
Market Failure Conditions
Predetermined Exit Conditions
Timed Entry and Exit
No Government Control
Indirect Investments (Funds)

© Yozma Proprietary
(Yozma Venture Capital (1
Mission: To create the venture capital market in Israel
Method: To entice the private sector and foreign investors
to set up new VC funds
To participate as a partner in the new VC funds
To secure an obligation of the new VC funds to
invest in start-up companies in Israel
Accomplished through: Establishment of a $100M
investment company
Use of proceeds: Establishment of 10 drop down funds
together with strategic partners.
15 Direct investments

© Yozma Proprietary
( Yozma Venture Capital (2
Basic principles:
•

Investment of $8M in each drop-down fund
(minority position)

•

A 5 year option to Yozma’s partners to buy out the
Government’s share at predetermined conditions

Results:
•

8 out of the 15 companies Yozma Venture Capital has
invested in directly, went public or have been acquired

•
•

9 out of the 10 drop-down funds have exercised
their option and bought out the Government

The Israel Venture Capital industry has been
© Yozma Proprietary
established
( Yozma Drop-Down Funds (1

FUND

PARTNERS

•Eurofund
•Gemini
•Inventech
•JPV
•Medica
•Nitzanim-Concord
•Polaris
•Star
•VERTEX
•Walden

Daimler-Benz, DEG (Germany)
Advent (USA)
Van Leer Group (NL)
Oxton (US/Far East)
MVP (USA)
AVX, Kyocera (Japan)
CMS (USA)
TVM (Germany) & Singapore Tech
Vertex International Funds (Singapore)
Walden (US)

© Yozma Proprietary
( Yozma Drop-Down Funds (2
FUND

CAPITAL MANAGED ($MM)
Original size

•Eurofund
•Gemini
•Inventech
•JPV
•Medica
•Nitzanim-Concord
•Polaris
•Star
•VERTEX
•Walden

Today
90
350
40
580
70
280
645
400
250
175

210
© Yozma Proprietary

20
25
20
20
20
20
20
20
20
25

2,880
The Government as a Catalyst

Government
Intervention
Market
Failure

$100M
I

nvestm
ent

Establishment
of Yozma

1993
1997

Return>$100M
© Yozma Proprietary

Government
Exits
Yozma Privatized

Problem
Solved
Countries Following the Yozma Example
Czechoslovakia
Taiwan

Australia

Denmark

New Zealand

Korea
South Africa

© Yozma Proprietary
Venture Capital Raised

4000

3rd Wave

3500
3000
1st Wave:

2000

Establishment

1500

$M

2500

of Yozma

2nd Wave:
Yozma Funds
Raise
Continuation
Funds

1000
500
0
1991 1992 1993 1994 1995 1996 1997 1998 1999 2000 2001
Source: IVC Research Center
Total Amount Raised by Israeli
High-Tech Companies ($M)
3,500

3,092

3,000
2,500

1,985
1,822

2,000

1,012

1,500

600

430

1,000

576
500
0

190
240
1997

1,173

1,270

260

812

340

436

1998

1999

Israeli VC Fund

Source: IVC Research Center

2000

Other Entities

2001
Capital Raised by Technological Sector –
2001 and 2000
9%

Internet

Life Sciences

30%
16%

8%

Other Technology

13%

6%

Software

20%

16%

42%
40%

Communications
0%

5%

10%

15%

20%

2000
Source: IVC Research Center

25%

2001

30%

35%

40%

45%
Israel's high Tech Cluster of the 90s
00
Number of SUs:
Number of VC Companies:
Accumulated No of IPOs (hi tech):
Accumulated VC-backed IPOs:
% Foreign Sources in SU funding
% IT Exports in Manufacturing Exports

90

80

~3000

~300

~150

~100

2

0

~130

9

1

~70

3

1

67%

NA

NA

45.7%

~33%

~20%
Capital Raised in US Public Offerings
of Israeli Companies (94’-01’)

3500
3000
2500

$M

Venture Backed

2000

All
1500
1000
500
0
1994

1995

1996

1997

1998

1999

2000

2001

In total: during the past 8 years more than 100 Israeli companies raised ~$9B ;
~50% of them were venture-backed

Source: IVC Research Center
M&As of Israeli Technology Companies
and Foreign Strategic Partners:
1996

$0.6B

1997

$0.8B

1998

$1.8B

1999

$2.9B

2000

$10.5B

2001

$0.6B

Source: IVC Research Center
Israeli VC Activity in 2001

•

Total Amount Invested ($m) : 812

•

No. of Deals : 656

•

No. of Companies : 438

•

Average Amount Invested ($m) : 1.2

Source: IVC Research Center
Israel VC Industry - Trends & Challenges
• Co-opetition
• Volatile Capital Markets
• Decrease in International Investments
• Maintaining Existing Portfolios
• Difficulties in Raising Capital
• Focus on Future Technologies
• Government Involvement
Thank You

© Yozma Proprietary
VC firms development over the years

1993-5

1996-8

1999-01

Average Leading VC Size ($M)

20

80

100-200

No. of Venture Firms

15

40

60
Share of Capital Invested by Israeli VCs
(Financing rounds in which at Least One Israeli VC Participated)

Other Entities

55% 55%

56%

59%

66%

54%

64%

50%

42%
58%
58%

45% 45%

44%

Israeli VCs

Q1/99 Q2/99 Q3/99

41%

50%

46%
34%

36%

Q4/99 Q1/00 Q2/00 Q3/00 Q4/00 Q1/01

Source: IVC Research Center

42%

46%
60%
54%

40%

Q2/01 Q3/01 Q4/01
First and Follow-on Investments by Quarter
100%
90%
80%

46%

42%

36%

32%
44%

44%

42%

34%

46%

48%

70%
72%

60%

73%

50%
40%
30%

54%

58%

64%

68%
56%

56%

58%

54%

66%
52%

20%
28%

10%

27%

0%
Q1/99 Q2/99 Q3/99 Q4/99 Q1/00 Q2/00 Q3/00 Q4/00 Q1/01 Q2/01 Q3/01 Q4/01

First

Source: IVC Research Center

Follow-On
Venture Capitalists – the Truth Revealed (part 1)

SEED

Hard & Fascinating

First & Second Rounds

Proof of Concept/Prototype/Beta
(Good Chance)

Third Round

Product/Initial Sales
(Attractive)

Pre-IPO

Profitability, Expansion
(Love it)

© Yozma Proprietary
Venture Capitalists – the Truth Revealed (part 2)

• Hate Risk
• Management more than Technology
• High return on investment (IRR>50%, X10 in 5 years)
• Innovation, not revolution
• Don’t want to control or micro-manage the company
• No time, but always open for new ideas
• As much details as possible
• Usually long and tired investment process

© Yozma Proprietary
Korea Venture Fund

Korean Government

© Yozma Proprietary

YOZMA -- by Yigal Erlich

  • 1.
    The Yozma ProgramSuccess Factors & Policy Presented by: Yigal Erlich the Yozma Group Tel Aviv, Israel
  • 2.
    THE ISRAELI OPPORTUNITY TheRight Ingredients Wealth of Human Capital Israel USA Japan Germany Mass Immigration • 140 82 80 60 # of Engineers/ Scientists per 10,000 people • • 1 Million people (mostly within 3 years) Quantity: 20% of Israeli Population Quality: 40% with Academic Degree Entrepreneurial Spirit • 2-3 New Startups every day • Highest Concentration of High-Tech Startups after Silicon Valley • 3rd in the world in IP (following US & Japan)
  • 3.
    Why Foreign InvestorsChoose to Invest in Israel •Entrepreneurial Spirit •Human Resources •Reputable Academic Institutes •Government Commitment to R&D •Strong Infrastructure for Entrepreneurs (CS, VCs, Incubators...) •International Activity (R&D centers, VCs, Corporations, Investment Banks) •Deal Flow Sources (Immigrants, Defense, Repatriate Israelis, Spin-offs, etc.) © Yozma Proprietary
  • 4.
    Deal Flow Sources Repatriate Israelis Defense Corporations DealFlow Sources Spin-offs R&D centers Universities New Immigrants © Yozma Proprietary
  • 5.
    Israeli Venture CapitalBefore 1993 •Lack of investment capital for start-ups ($20 Million) •Lack of professional venture capital management •Successes in R&D vs. failures in marketing •Number of start-ups tripled from 1988 to 1992 © Yozma Proprietary
  • 6.
    Government Support forthe High-Tech Industry- Pros and Cons • • • • Chief Scientist Tech. Incubators Gov’t Guarantees Venture Capital © Yozma Proprietary     Only R&D Only Seed No Risk Lowering Equity-Based
  • 7.
    Venture Capital – anEngine for Growth for High-Tech Companies • • • • • Equity-based finance  VC Need to go international quickly  VC Short product life  Higher R&D spending  VC Larger investment per Company Deep pockets  VC Need for management and marketing assistance  VC © Yozma Proprietary
  • 8.
    Government’s Entry IntoBusiness – Preconditions • • • • • • • Government as a Catalyst Lowered Risk Market Failure Conditions Predetermined Exit Conditions Timed Entry and Exit No Government Control Indirect Investments (Funds) © Yozma Proprietary
  • 9.
    (Yozma Venture Capital(1 Mission: To create the venture capital market in Israel Method: To entice the private sector and foreign investors to set up new VC funds To participate as a partner in the new VC funds To secure an obligation of the new VC funds to invest in start-up companies in Israel Accomplished through: Establishment of a $100M investment company Use of proceeds: Establishment of 10 drop down funds together with strategic partners. 15 Direct investments © Yozma Proprietary
  • 10.
    ( Yozma VentureCapital (2 Basic principles: • Investment of $8M in each drop-down fund (minority position) • A 5 year option to Yozma’s partners to buy out the Government’s share at predetermined conditions Results: • 8 out of the 15 companies Yozma Venture Capital has invested in directly, went public or have been acquired • • 9 out of the 10 drop-down funds have exercised their option and bought out the Government The Israel Venture Capital industry has been © Yozma Proprietary established
  • 11.
    ( Yozma Drop-DownFunds (1 FUND PARTNERS •Eurofund •Gemini •Inventech •JPV •Medica •Nitzanim-Concord •Polaris •Star •VERTEX •Walden Daimler-Benz, DEG (Germany) Advent (USA) Van Leer Group (NL) Oxton (US/Far East) MVP (USA) AVX, Kyocera (Japan) CMS (USA) TVM (Germany) & Singapore Tech Vertex International Funds (Singapore) Walden (US) © Yozma Proprietary
  • 12.
    ( Yozma Drop-DownFunds (2 FUND CAPITAL MANAGED ($MM) Original size •Eurofund •Gemini •Inventech •JPV •Medica •Nitzanim-Concord •Polaris •Star •VERTEX •Walden Today 90 350 40 580 70 280 645 400 250 175 210 © Yozma Proprietary 20 25 20 20 20 20 20 20 20 25 2,880
  • 13.
    The Government asa Catalyst Government Intervention Market Failure $100M I nvestm ent Establishment of Yozma 1993 1997 Return>$100M © Yozma Proprietary Government Exits Yozma Privatized Problem Solved
  • 14.
    Countries Following theYozma Example Czechoslovakia Taiwan Australia Denmark New Zealand Korea South Africa © Yozma Proprietary
  • 15.
    Venture Capital Raised 4000 3rdWave 3500 3000 1st Wave: 2000 Establishment 1500 $M 2500 of Yozma 2nd Wave: Yozma Funds Raise Continuation Funds 1000 500 0 1991 1992 1993 1994 1995 1996 1997 1998 1999 2000 2001 Source: IVC Research Center
  • 16.
    Total Amount Raisedby Israeli High-Tech Companies ($M) 3,500 3,092 3,000 2,500 1,985 1,822 2,000 1,012 1,500 600 430 1,000 576 500 0 190 240 1997 1,173 1,270 260 812 340 436 1998 1999 Israeli VC Fund Source: IVC Research Center 2000 Other Entities 2001
  • 17.
    Capital Raised byTechnological Sector – 2001 and 2000 9% Internet Life Sciences 30% 16% 8% Other Technology 13% 6% Software 20% 16% 42% 40% Communications 0% 5% 10% 15% 20% 2000 Source: IVC Research Center 25% 2001 30% 35% 40% 45%
  • 18.
    Israel's high TechCluster of the 90s 00 Number of SUs: Number of VC Companies: Accumulated No of IPOs (hi tech): Accumulated VC-backed IPOs: % Foreign Sources in SU funding % IT Exports in Manufacturing Exports 90 80 ~3000 ~300 ~150 ~100 2 0 ~130 9 1 ~70 3 1 67% NA NA 45.7% ~33% ~20%
  • 19.
    Capital Raised inUS Public Offerings of Israeli Companies (94’-01’) 3500 3000 2500 $M Venture Backed 2000 All 1500 1000 500 0 1994 1995 1996 1997 1998 1999 2000 2001 In total: during the past 8 years more than 100 Israeli companies raised ~$9B ; ~50% of them were venture-backed Source: IVC Research Center
  • 20.
    M&As of IsraeliTechnology Companies and Foreign Strategic Partners: 1996 $0.6B 1997 $0.8B 1998 $1.8B 1999 $2.9B 2000 $10.5B 2001 $0.6B Source: IVC Research Center
  • 21.
    Israeli VC Activityin 2001 • Total Amount Invested ($m) : 812 • No. of Deals : 656 • No. of Companies : 438 • Average Amount Invested ($m) : 1.2 Source: IVC Research Center
  • 22.
    Israel VC Industry- Trends & Challenges • Co-opetition • Volatile Capital Markets • Decrease in International Investments • Maintaining Existing Portfolios • Difficulties in Raising Capital • Focus on Future Technologies • Government Involvement
  • 23.
    Thank You © YozmaProprietary
  • 24.
    VC firms developmentover the years 1993-5 1996-8 1999-01 Average Leading VC Size ($M) 20 80 100-200 No. of Venture Firms 15 40 60
  • 25.
    Share of CapitalInvested by Israeli VCs (Financing rounds in which at Least One Israeli VC Participated) Other Entities 55% 55% 56% 59% 66% 54% 64% 50% 42% 58% 58% 45% 45% 44% Israeli VCs Q1/99 Q2/99 Q3/99 41% 50% 46% 34% 36% Q4/99 Q1/00 Q2/00 Q3/00 Q4/00 Q1/01 Source: IVC Research Center 42% 46% 60% 54% 40% Q2/01 Q3/01 Q4/01
  • 26.
    First and Follow-onInvestments by Quarter 100% 90% 80% 46% 42% 36% 32% 44% 44% 42% 34% 46% 48% 70% 72% 60% 73% 50% 40% 30% 54% 58% 64% 68% 56% 56% 58% 54% 66% 52% 20% 28% 10% 27% 0% Q1/99 Q2/99 Q3/99 Q4/99 Q1/00 Q2/00 Q3/00 Q4/00 Q1/01 Q2/01 Q3/01 Q4/01 First Source: IVC Research Center Follow-On
  • 27.
    Venture Capitalists –the Truth Revealed (part 1) SEED Hard & Fascinating First & Second Rounds Proof of Concept/Prototype/Beta (Good Chance) Third Round Product/Initial Sales (Attractive) Pre-IPO Profitability, Expansion (Love it) © Yozma Proprietary
  • 28.
    Venture Capitalists –the Truth Revealed (part 2) • Hate Risk • Management more than Technology • High return on investment (IRR>50%, X10 in 5 years) • Innovation, not revolution • Don’t want to control or micro-manage the company • No time, but always open for new ideas • As much details as possible • Usually long and tired investment process © Yozma Proprietary
  • 29.
    Korea Venture Fund KoreanGovernment © Yozma Proprietary

Editor's Notes

  • #19 תכונות של האשכול