Download to read offline

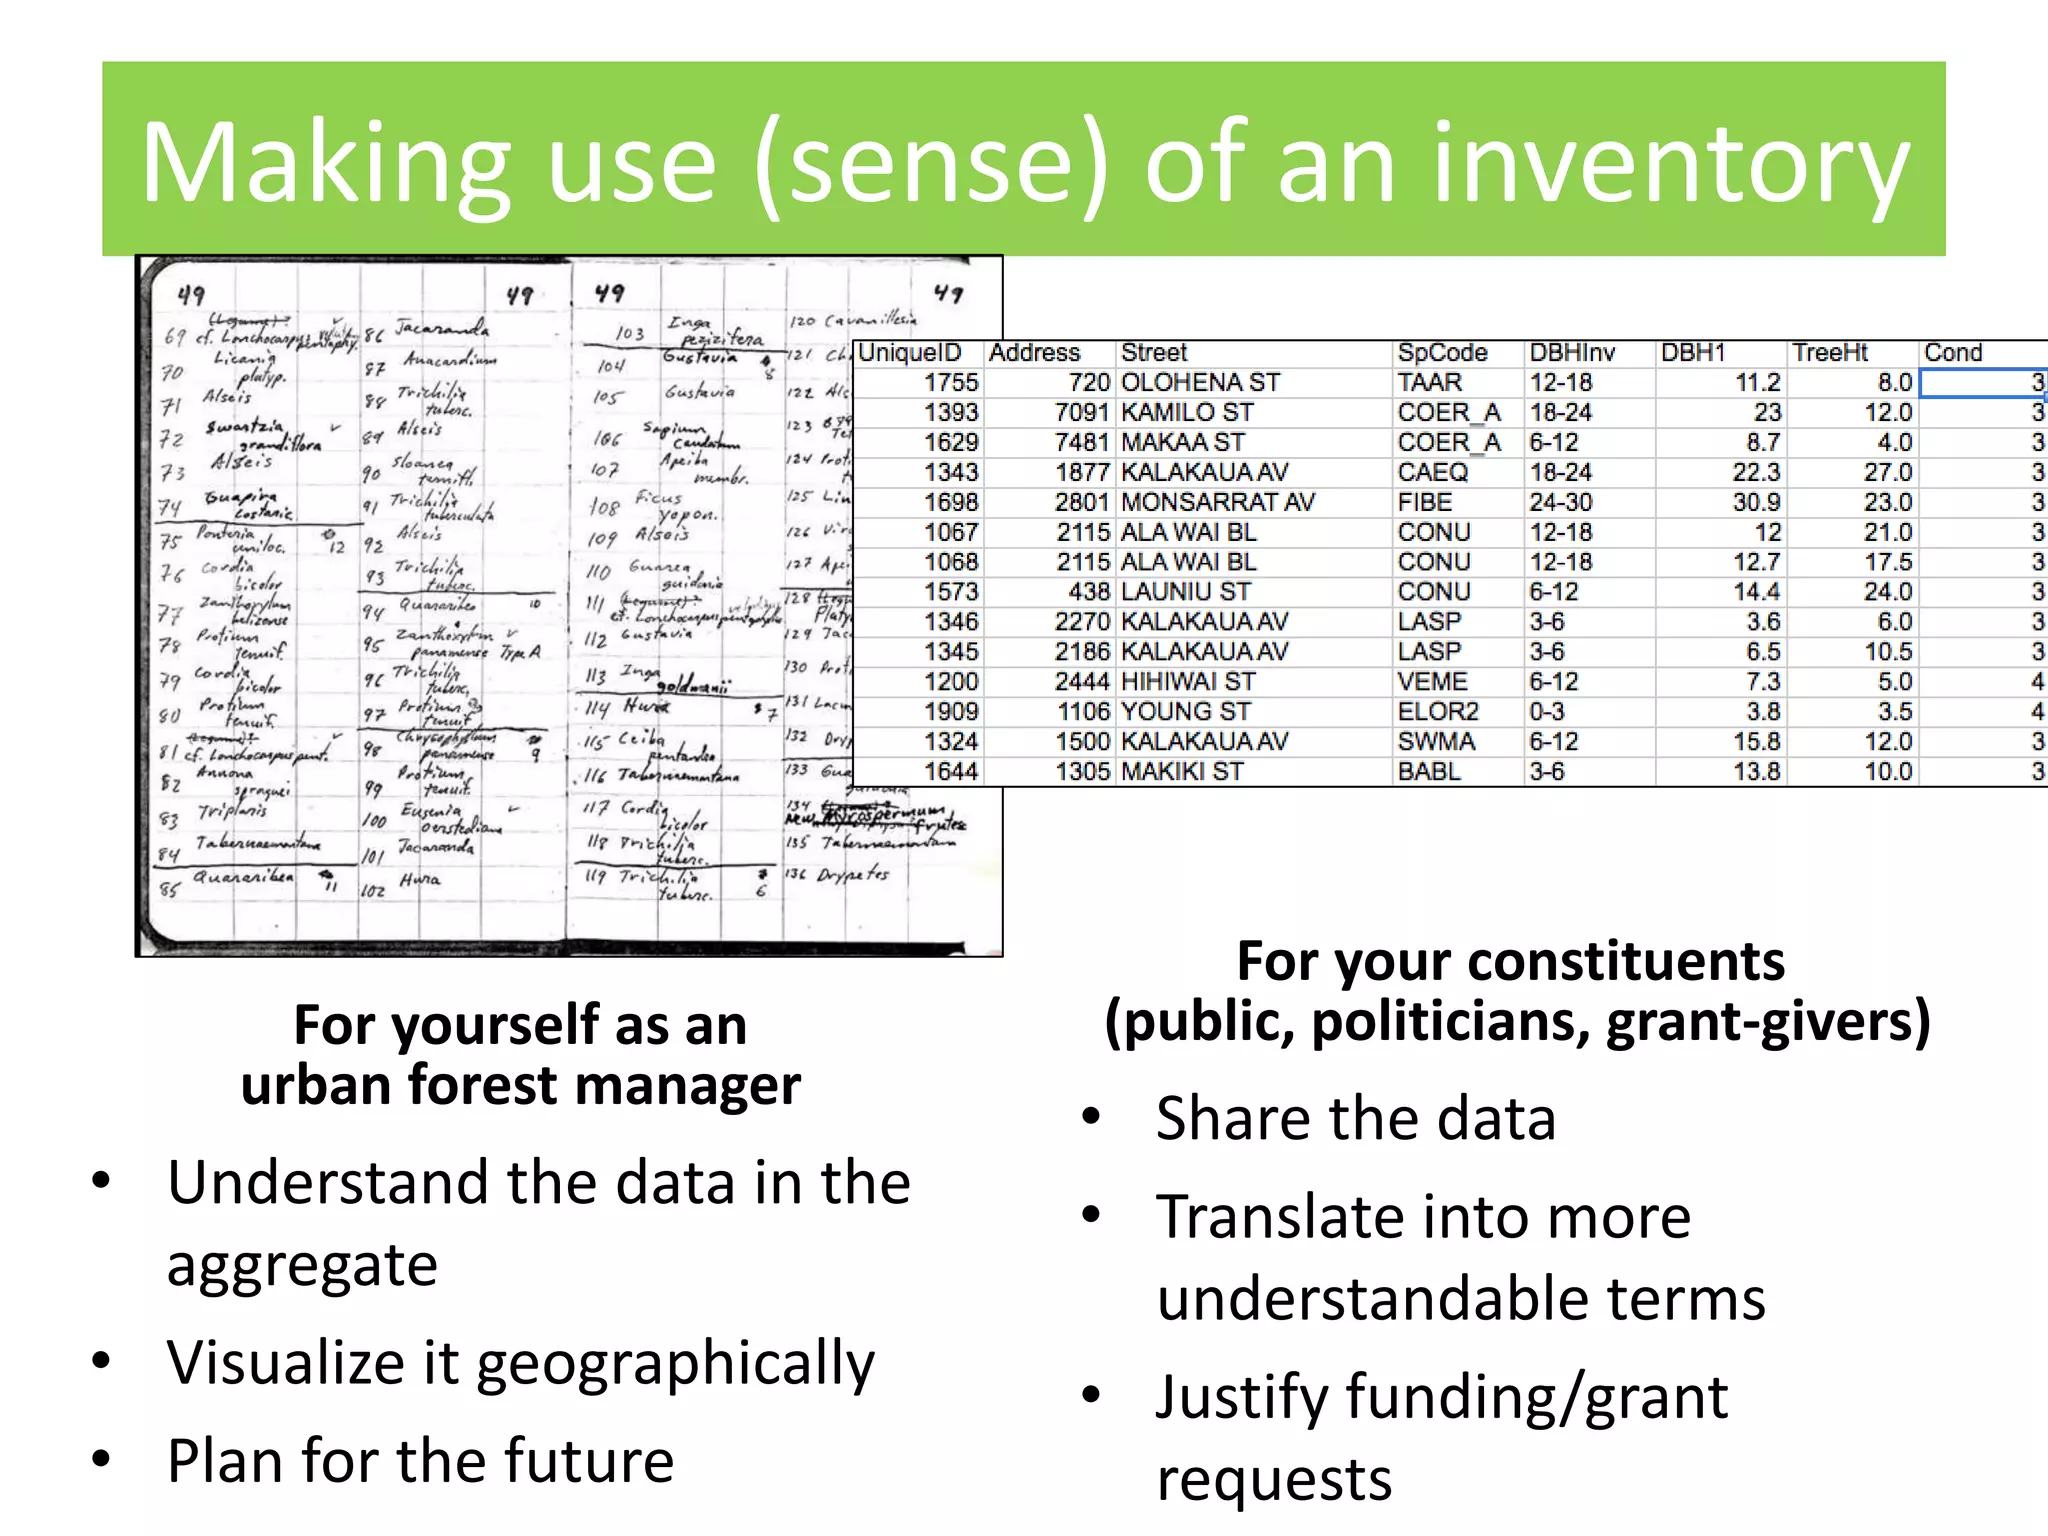
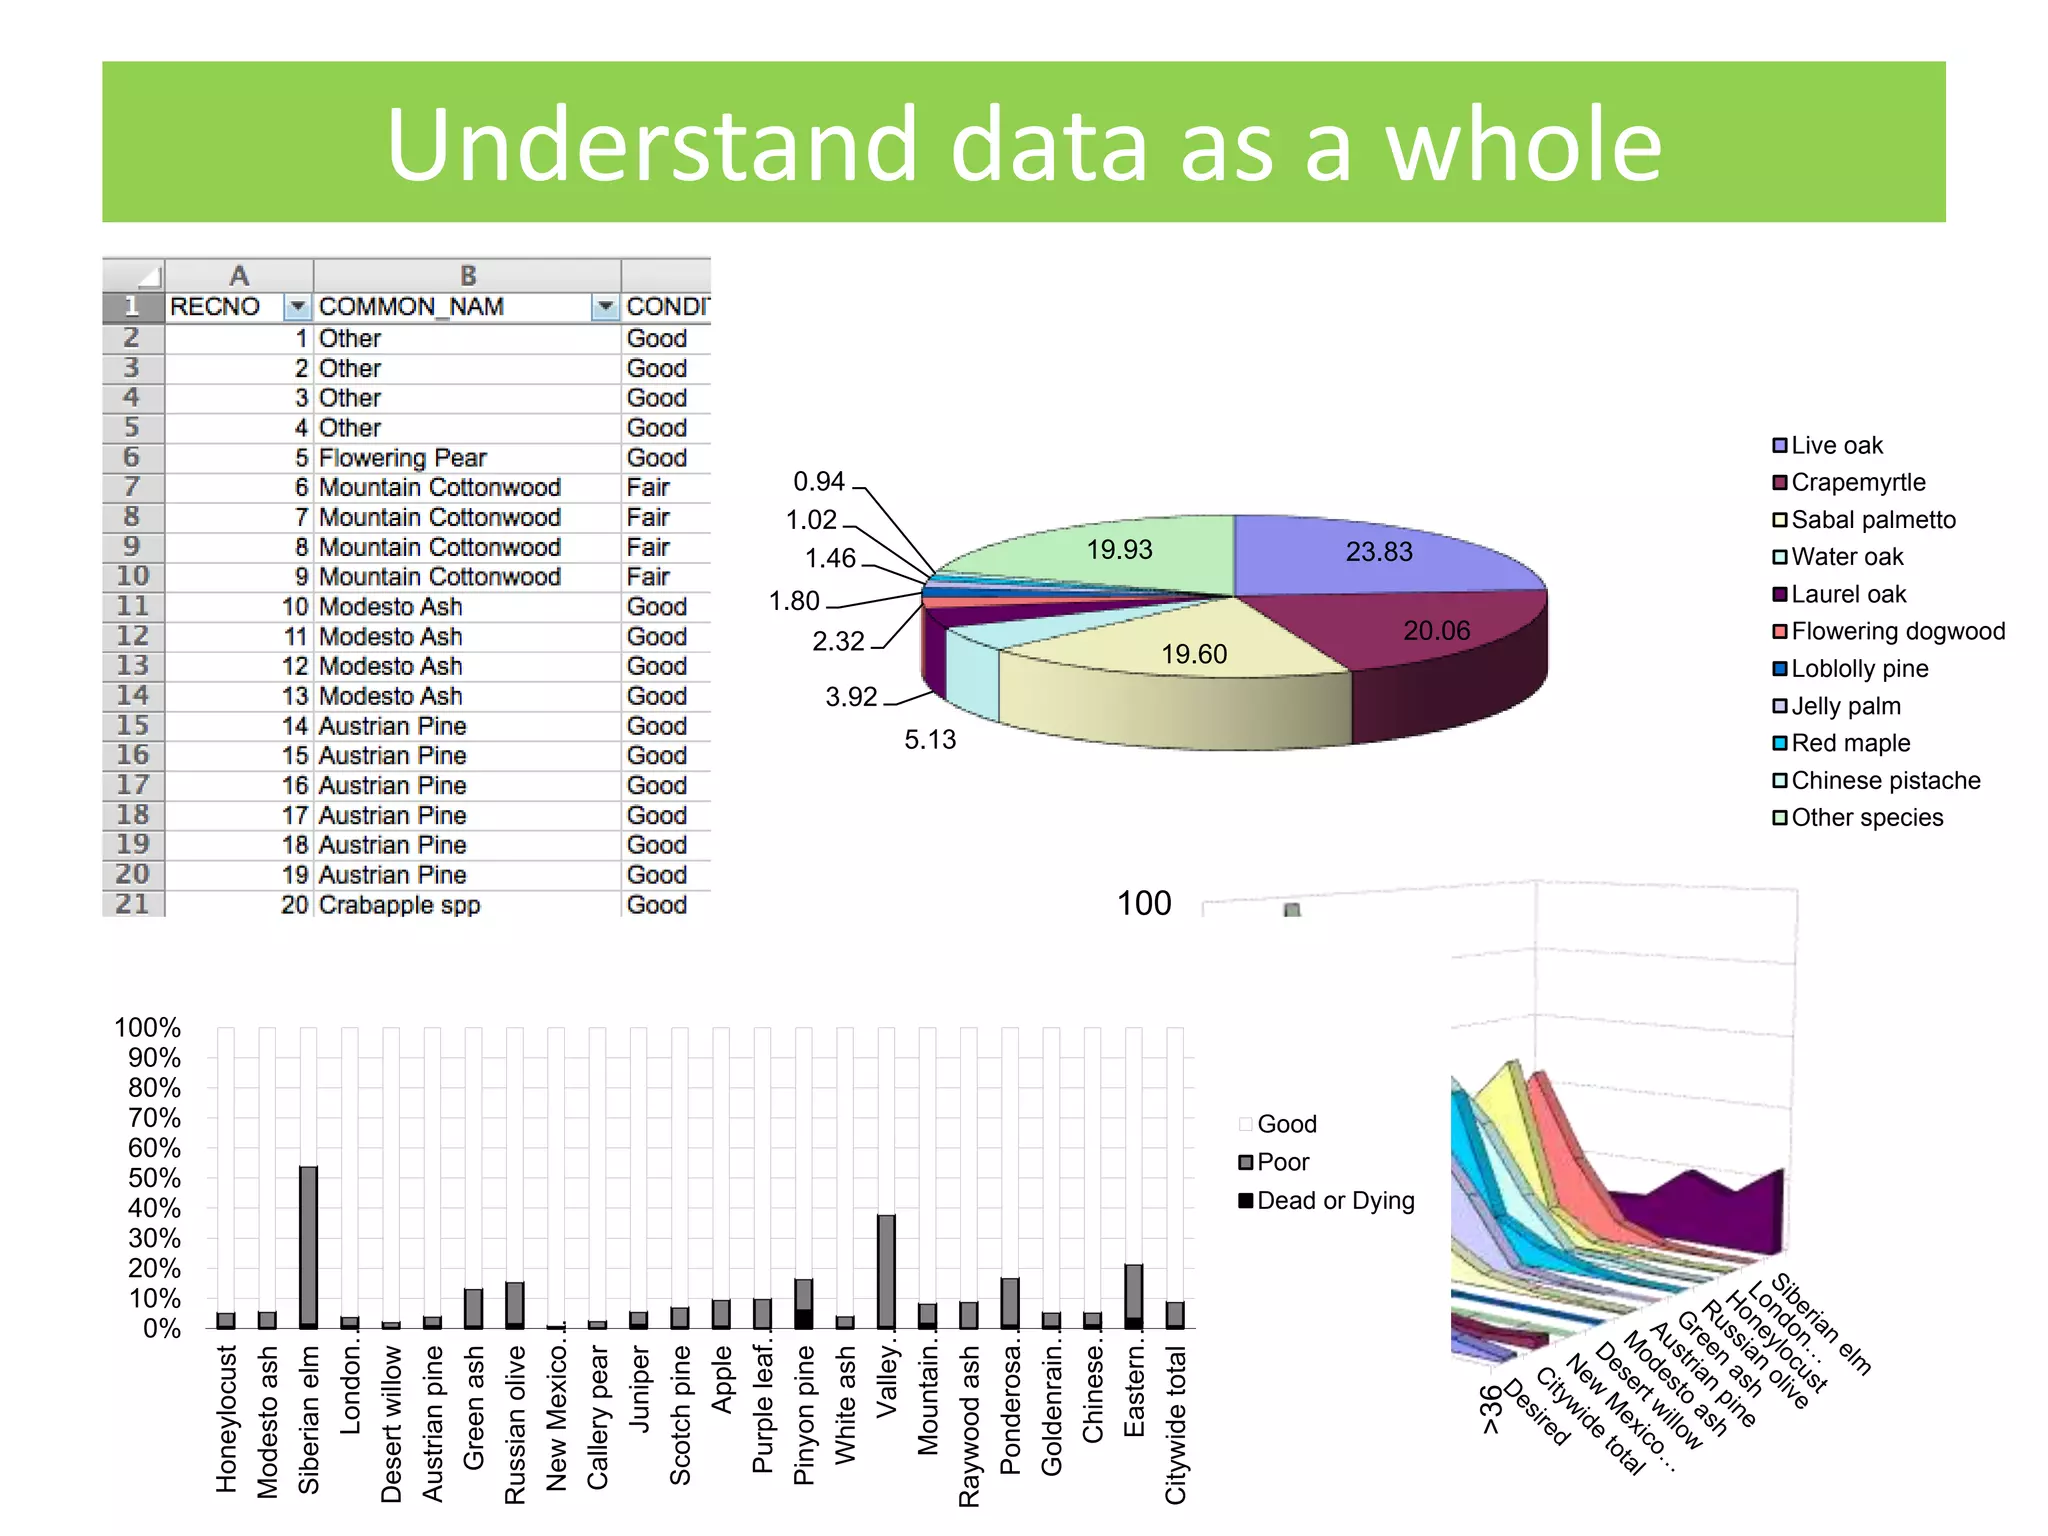
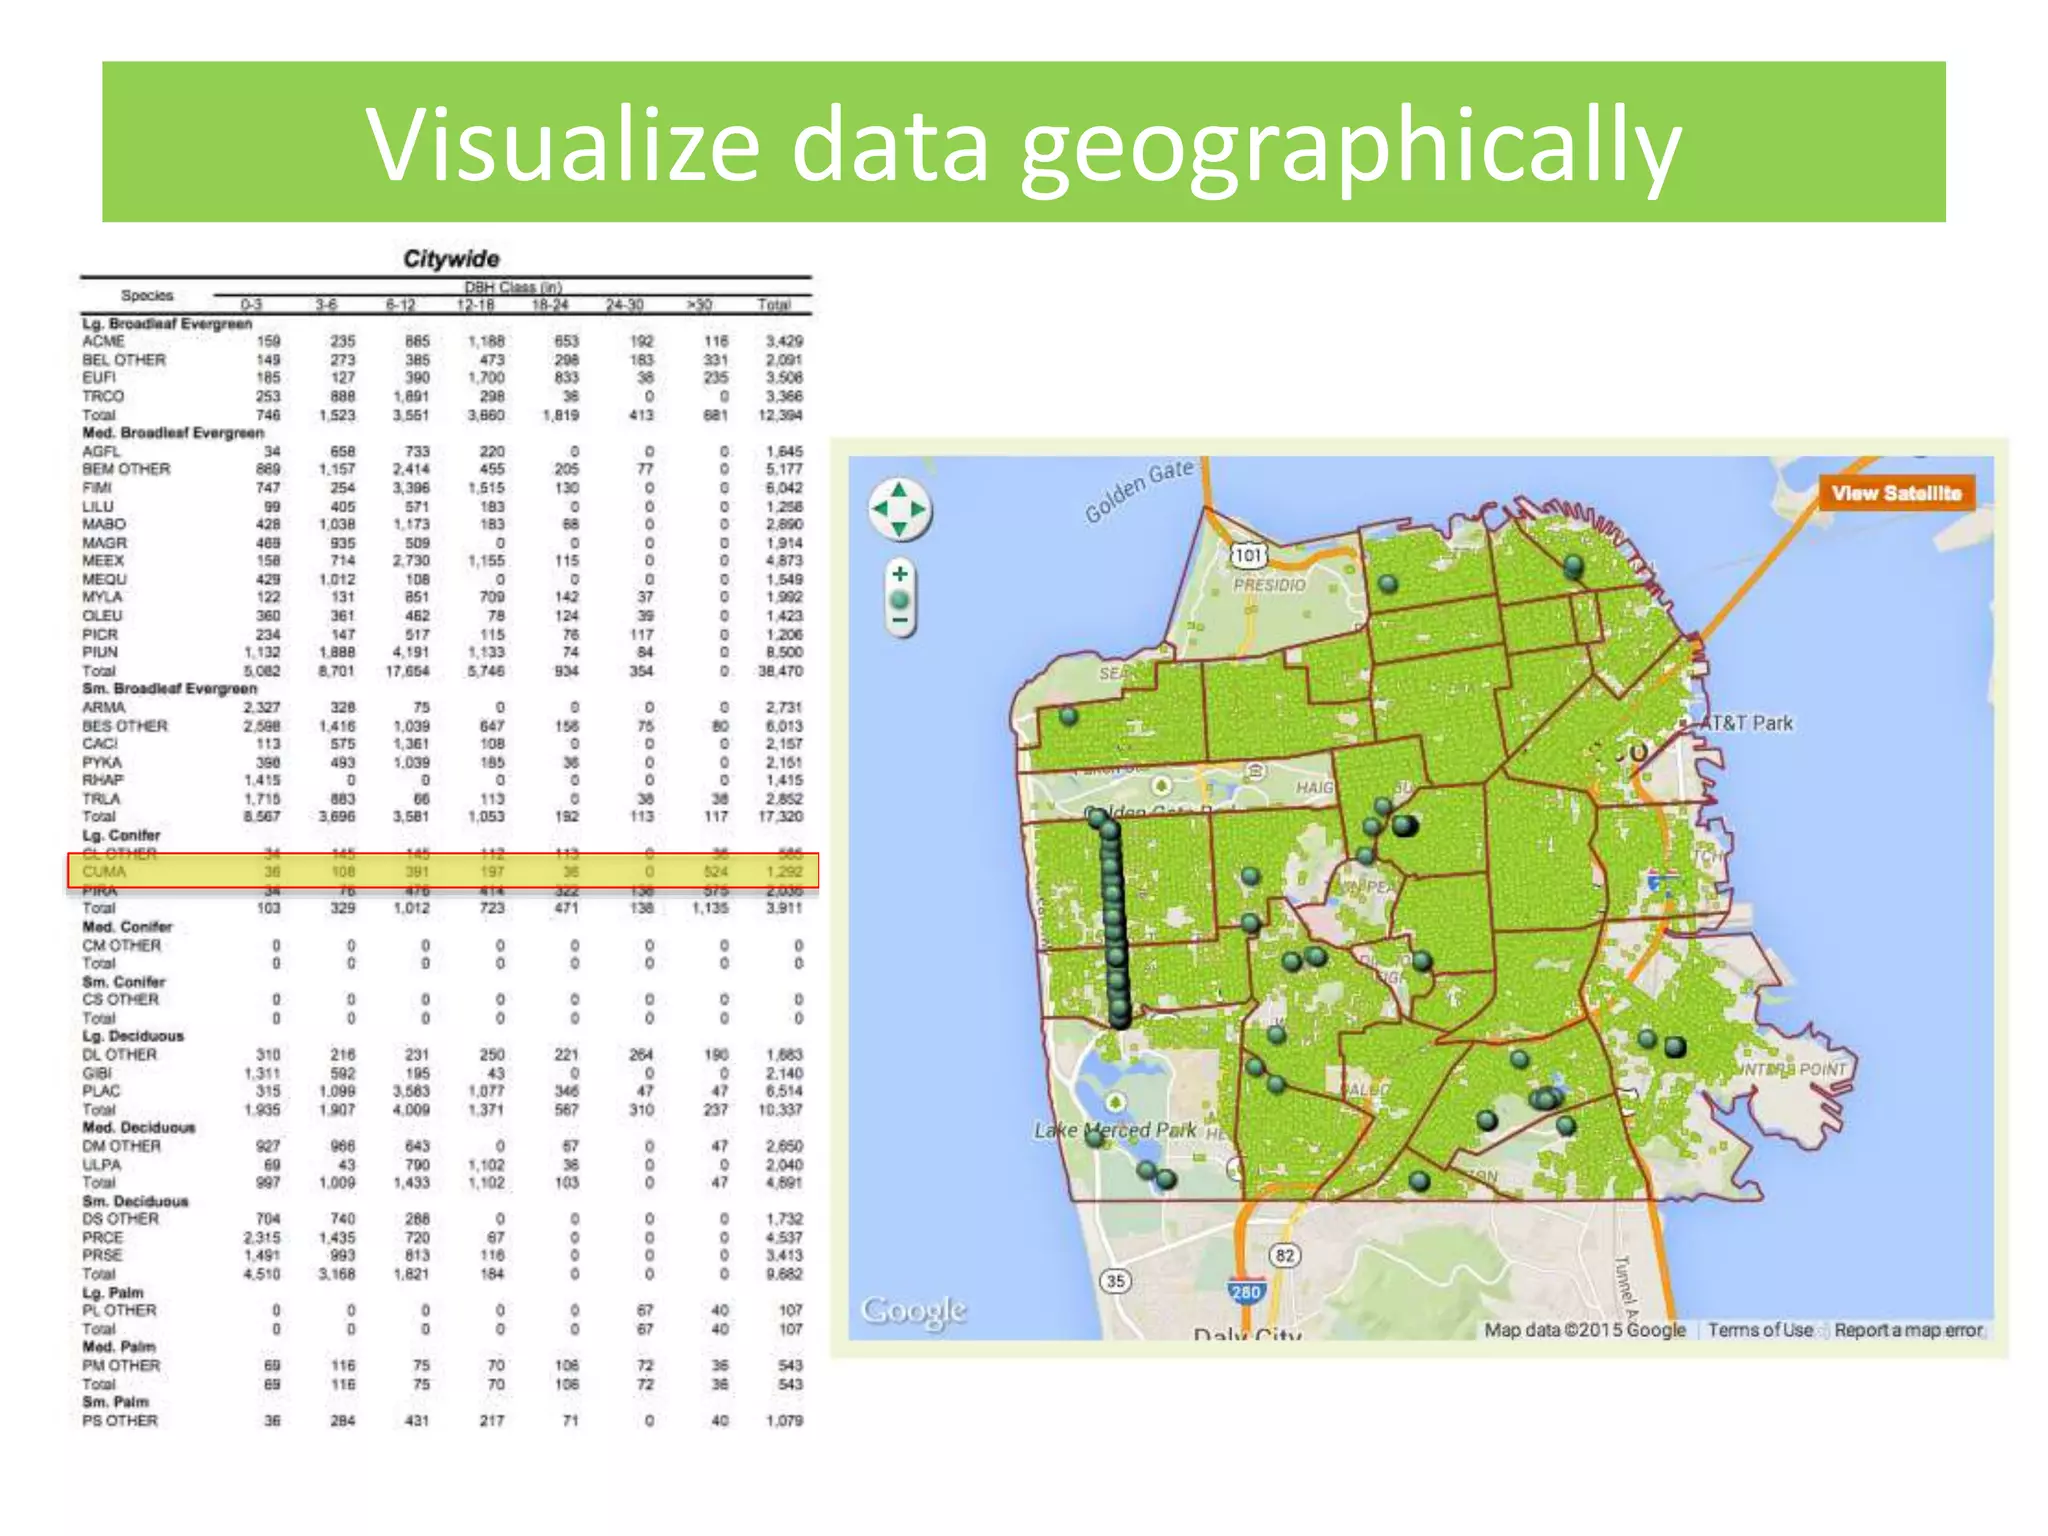
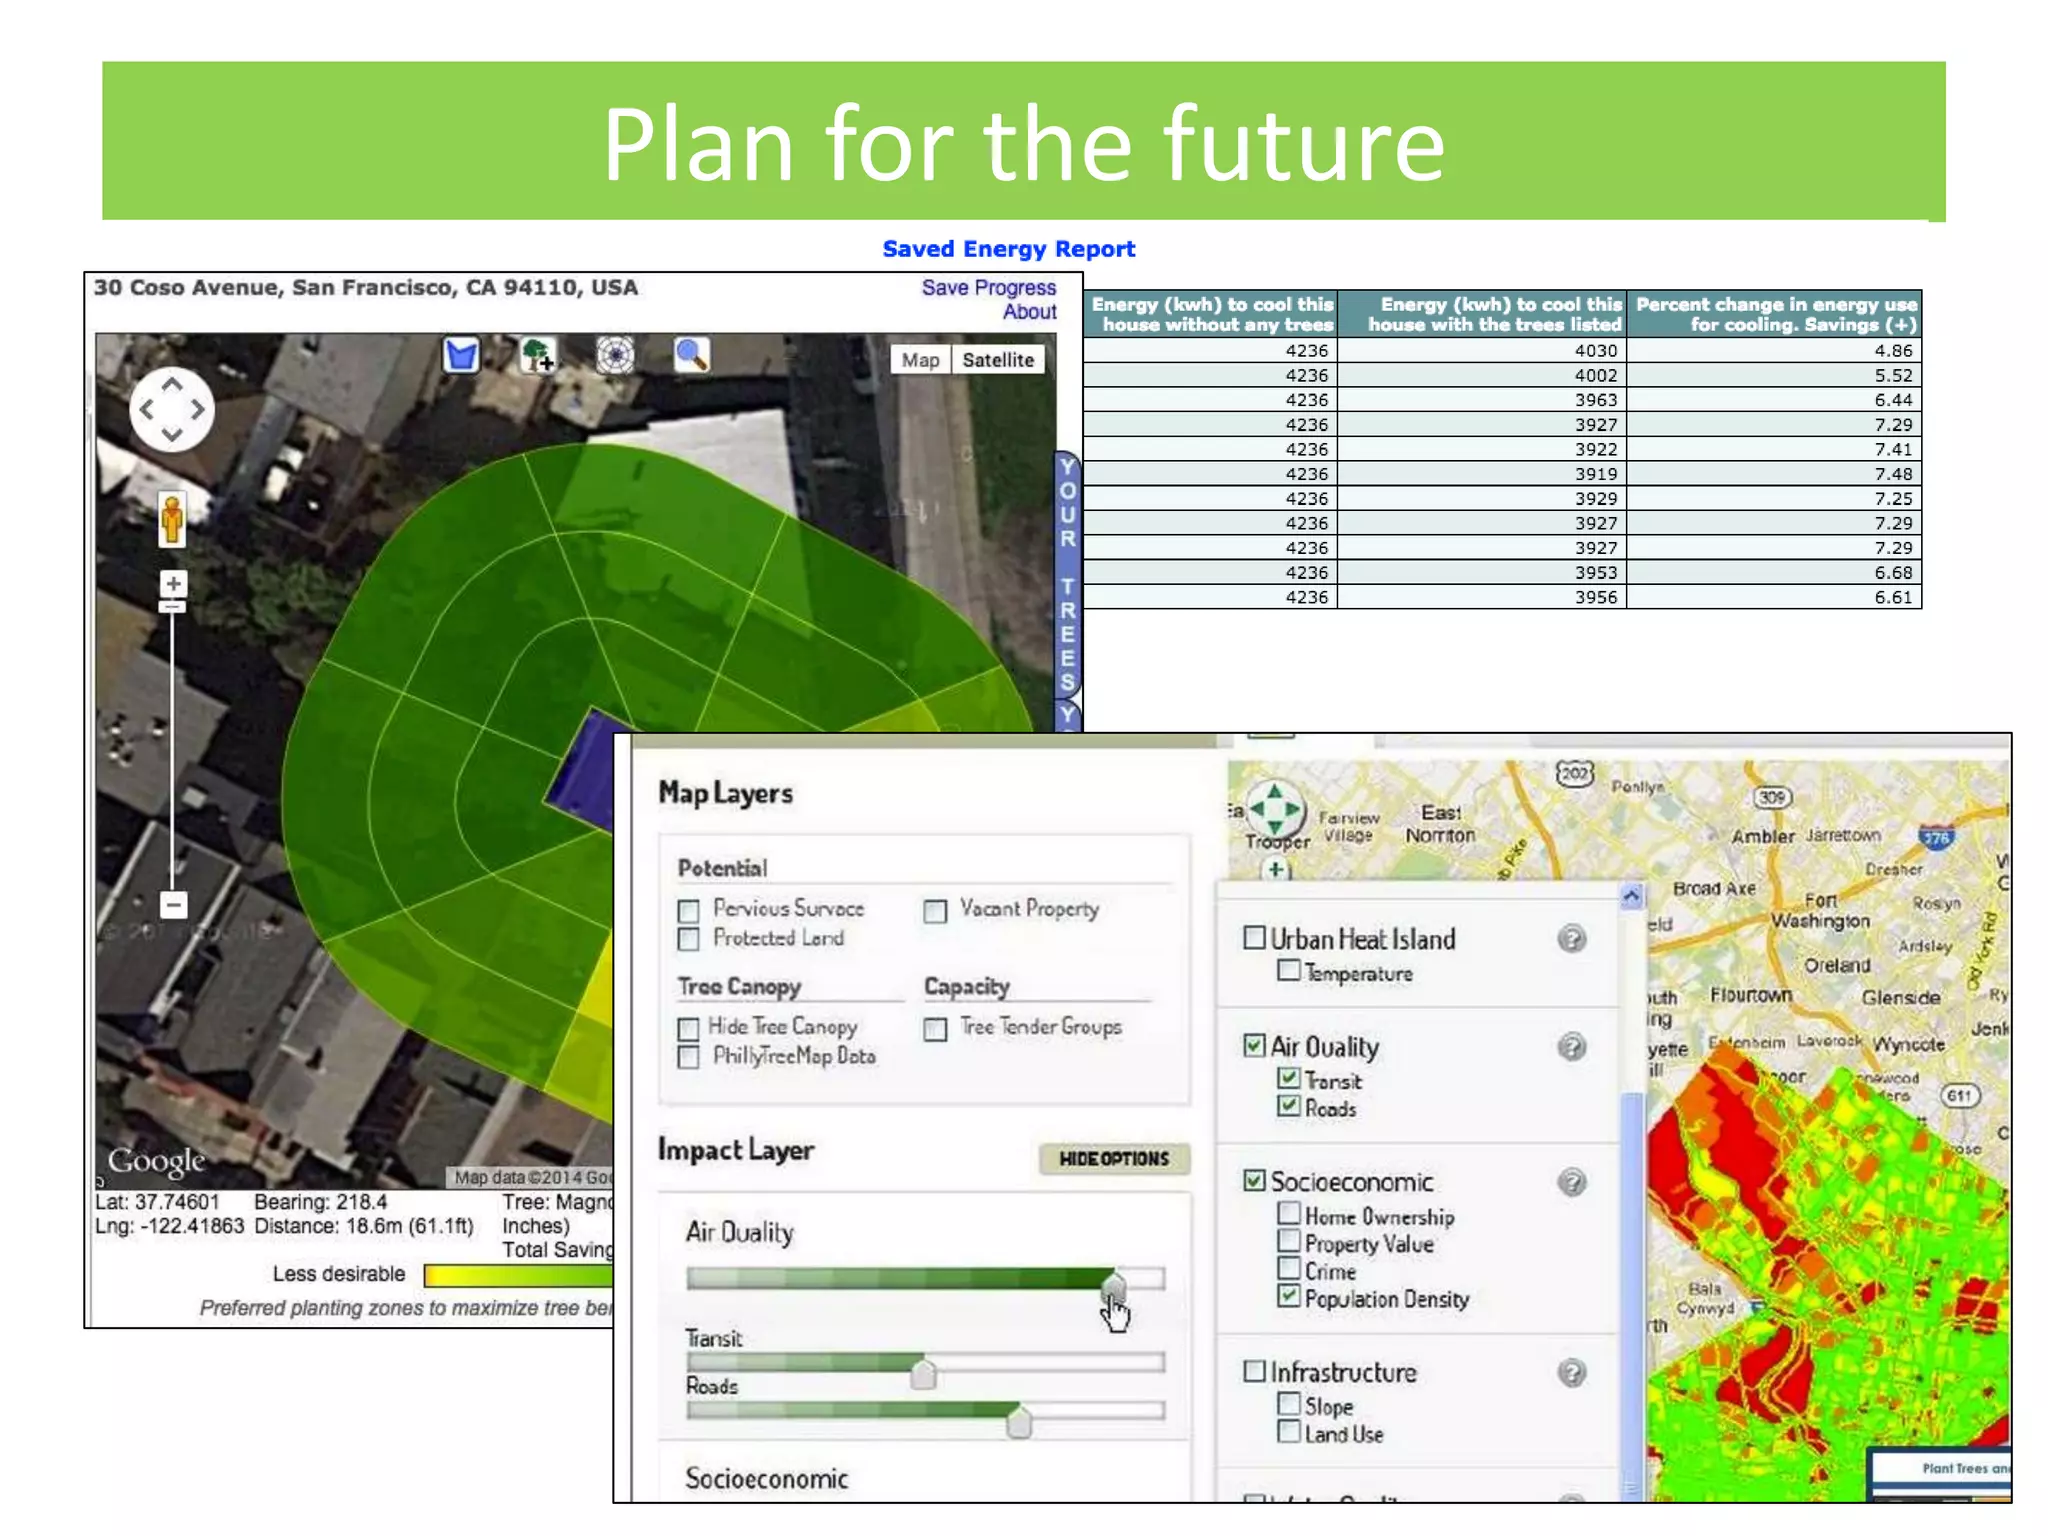
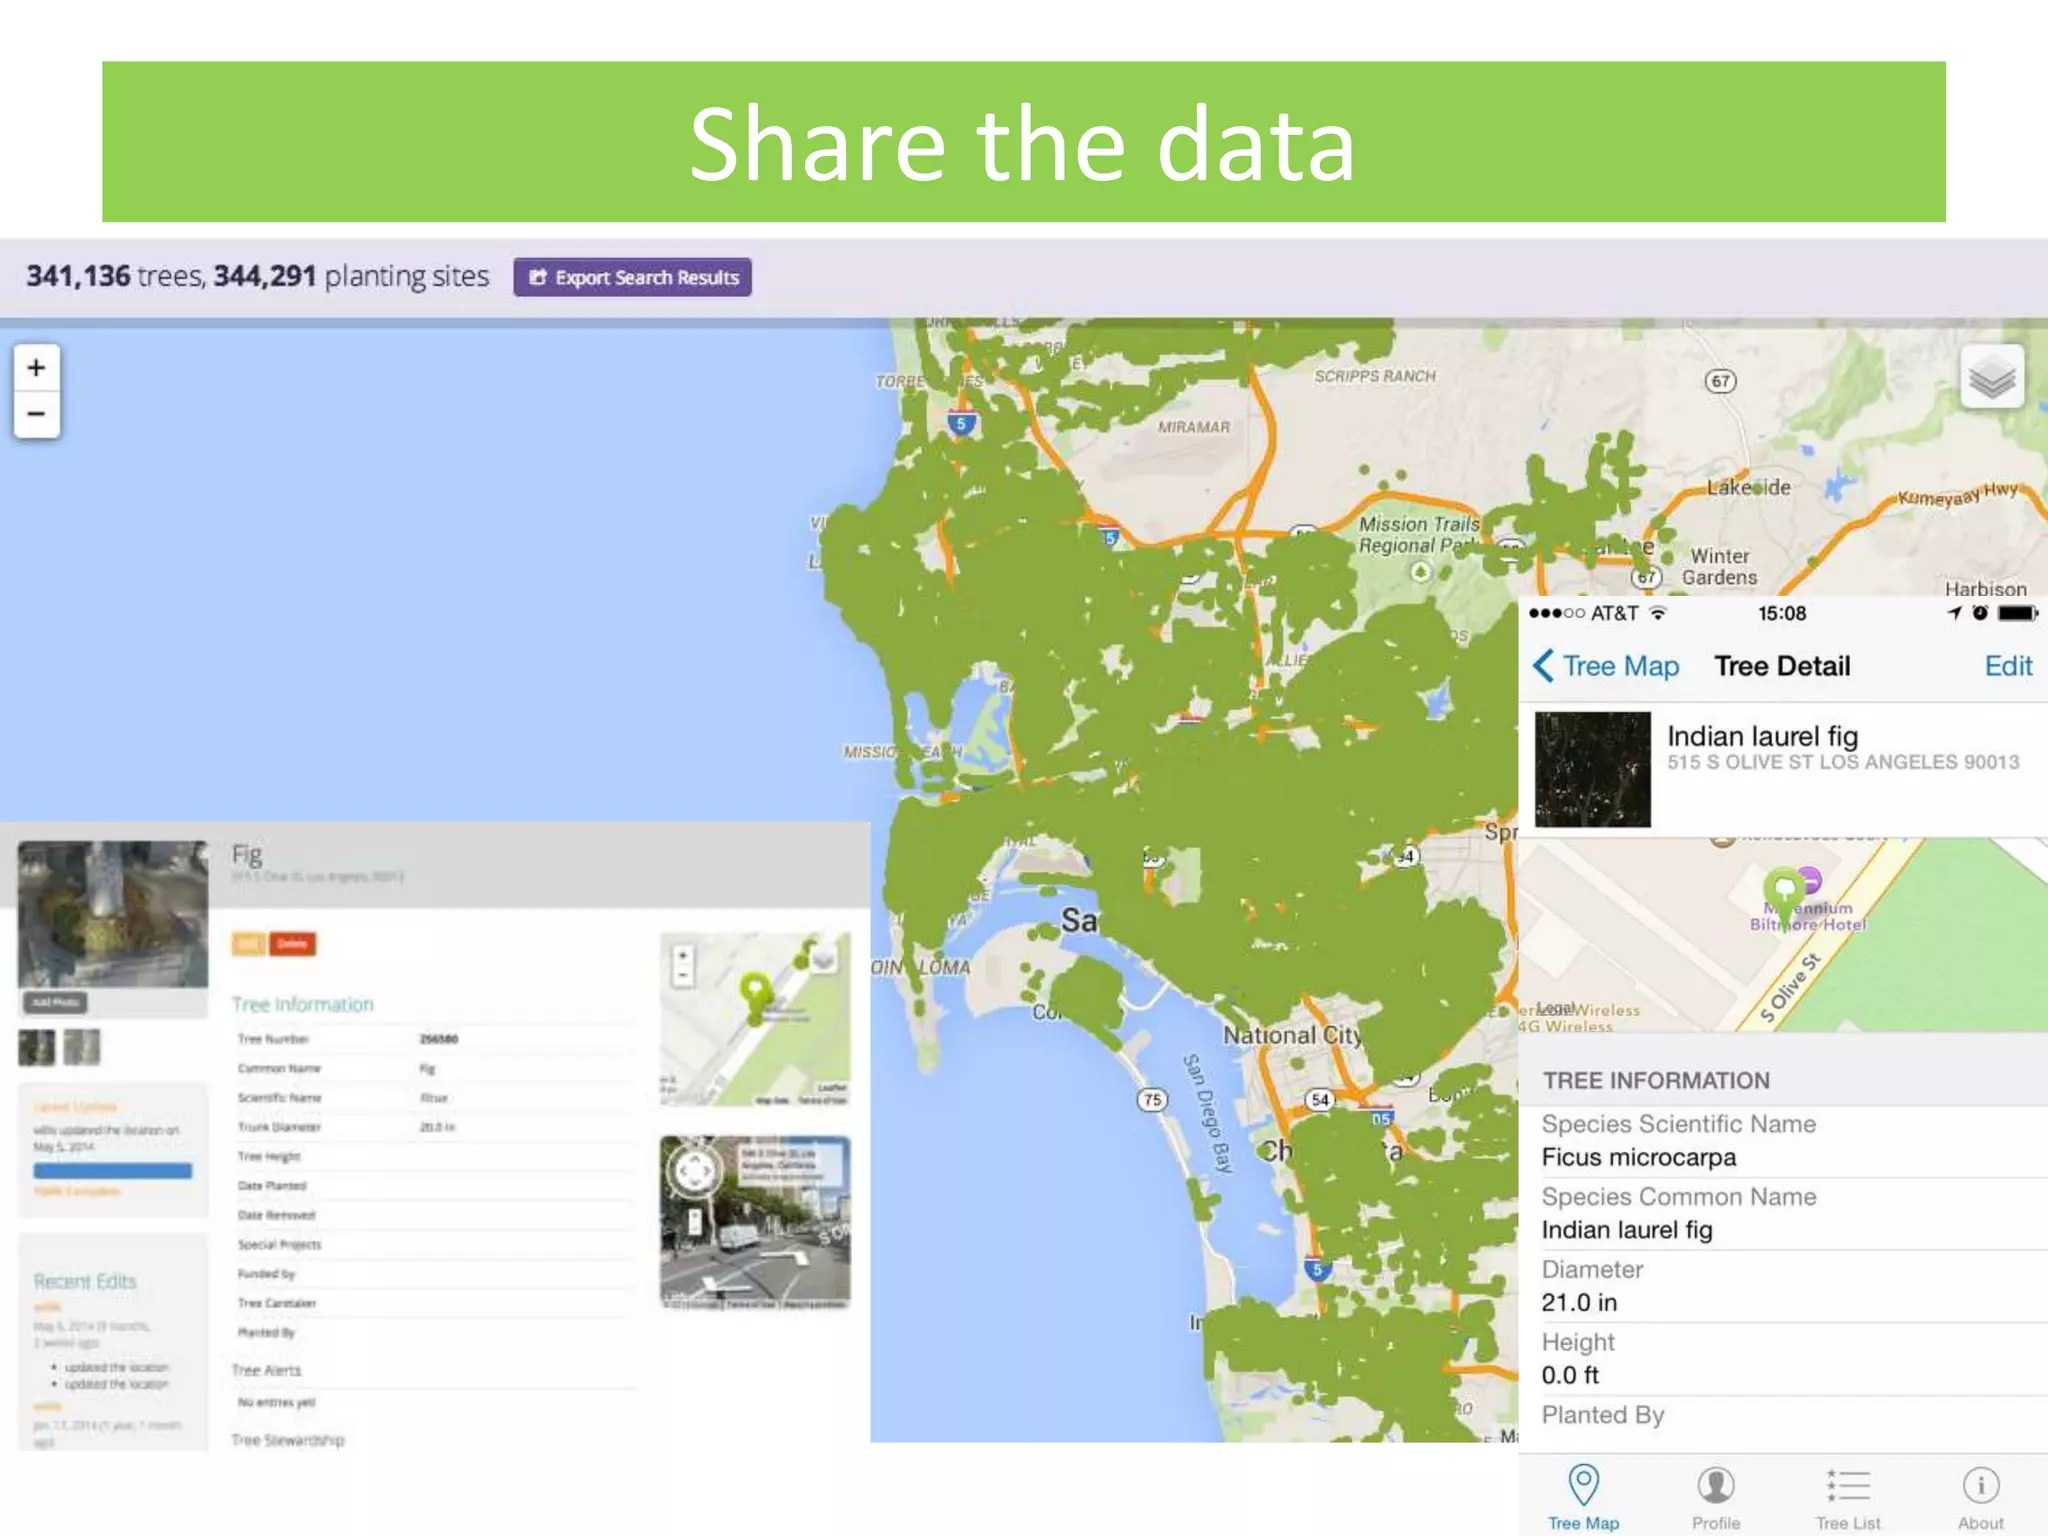
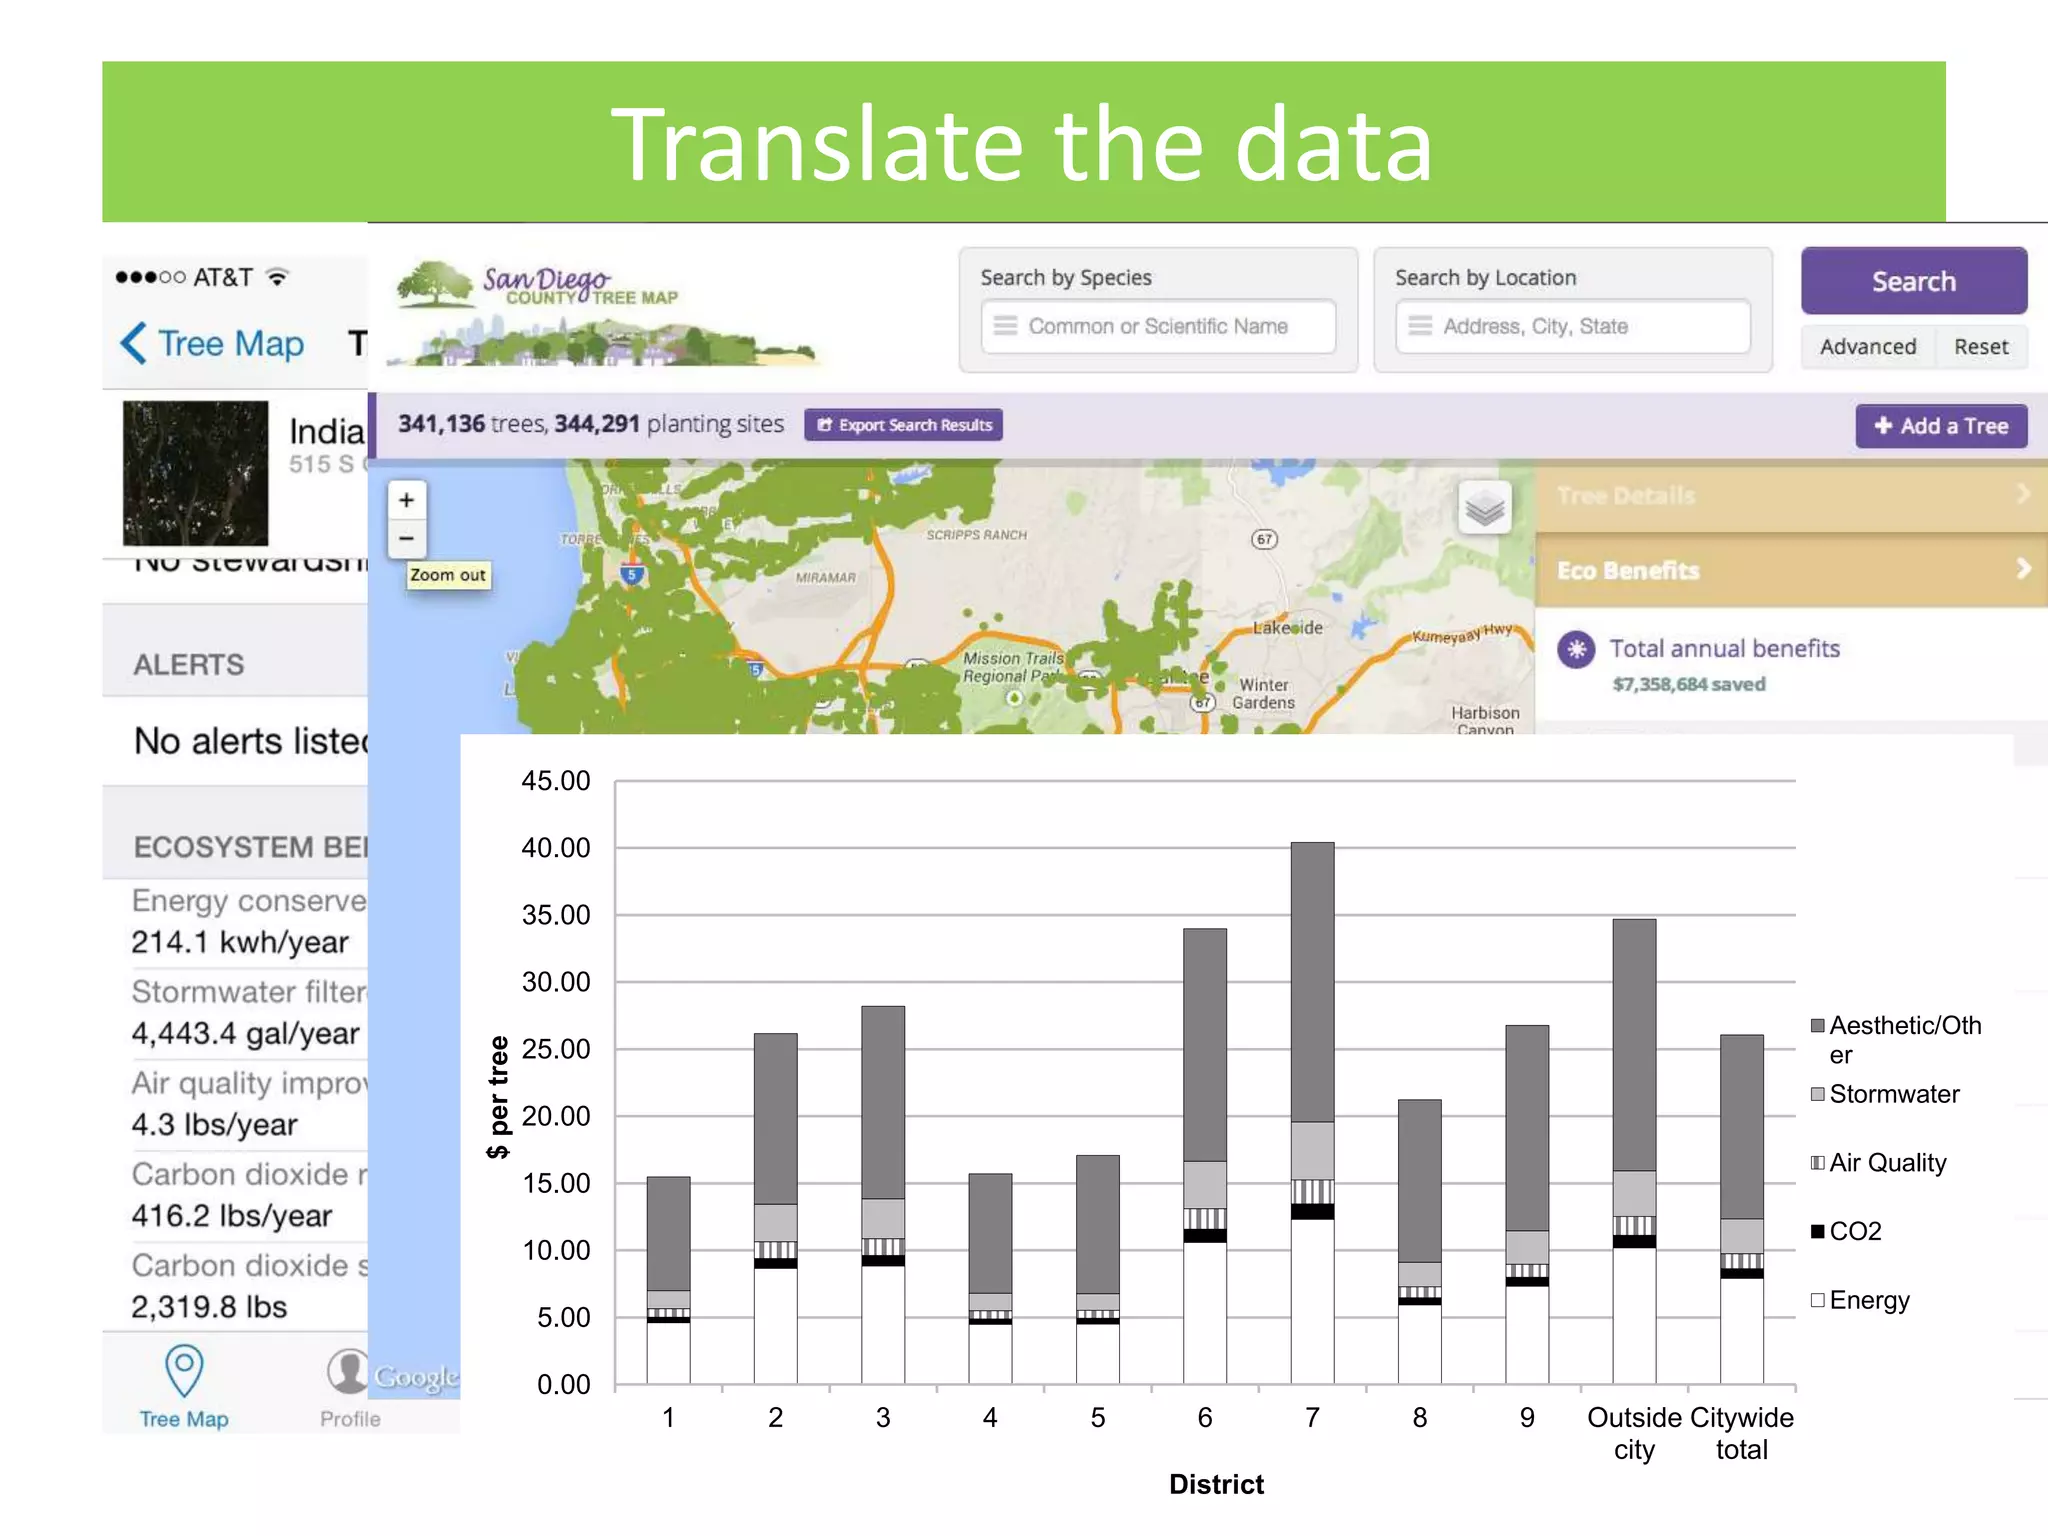
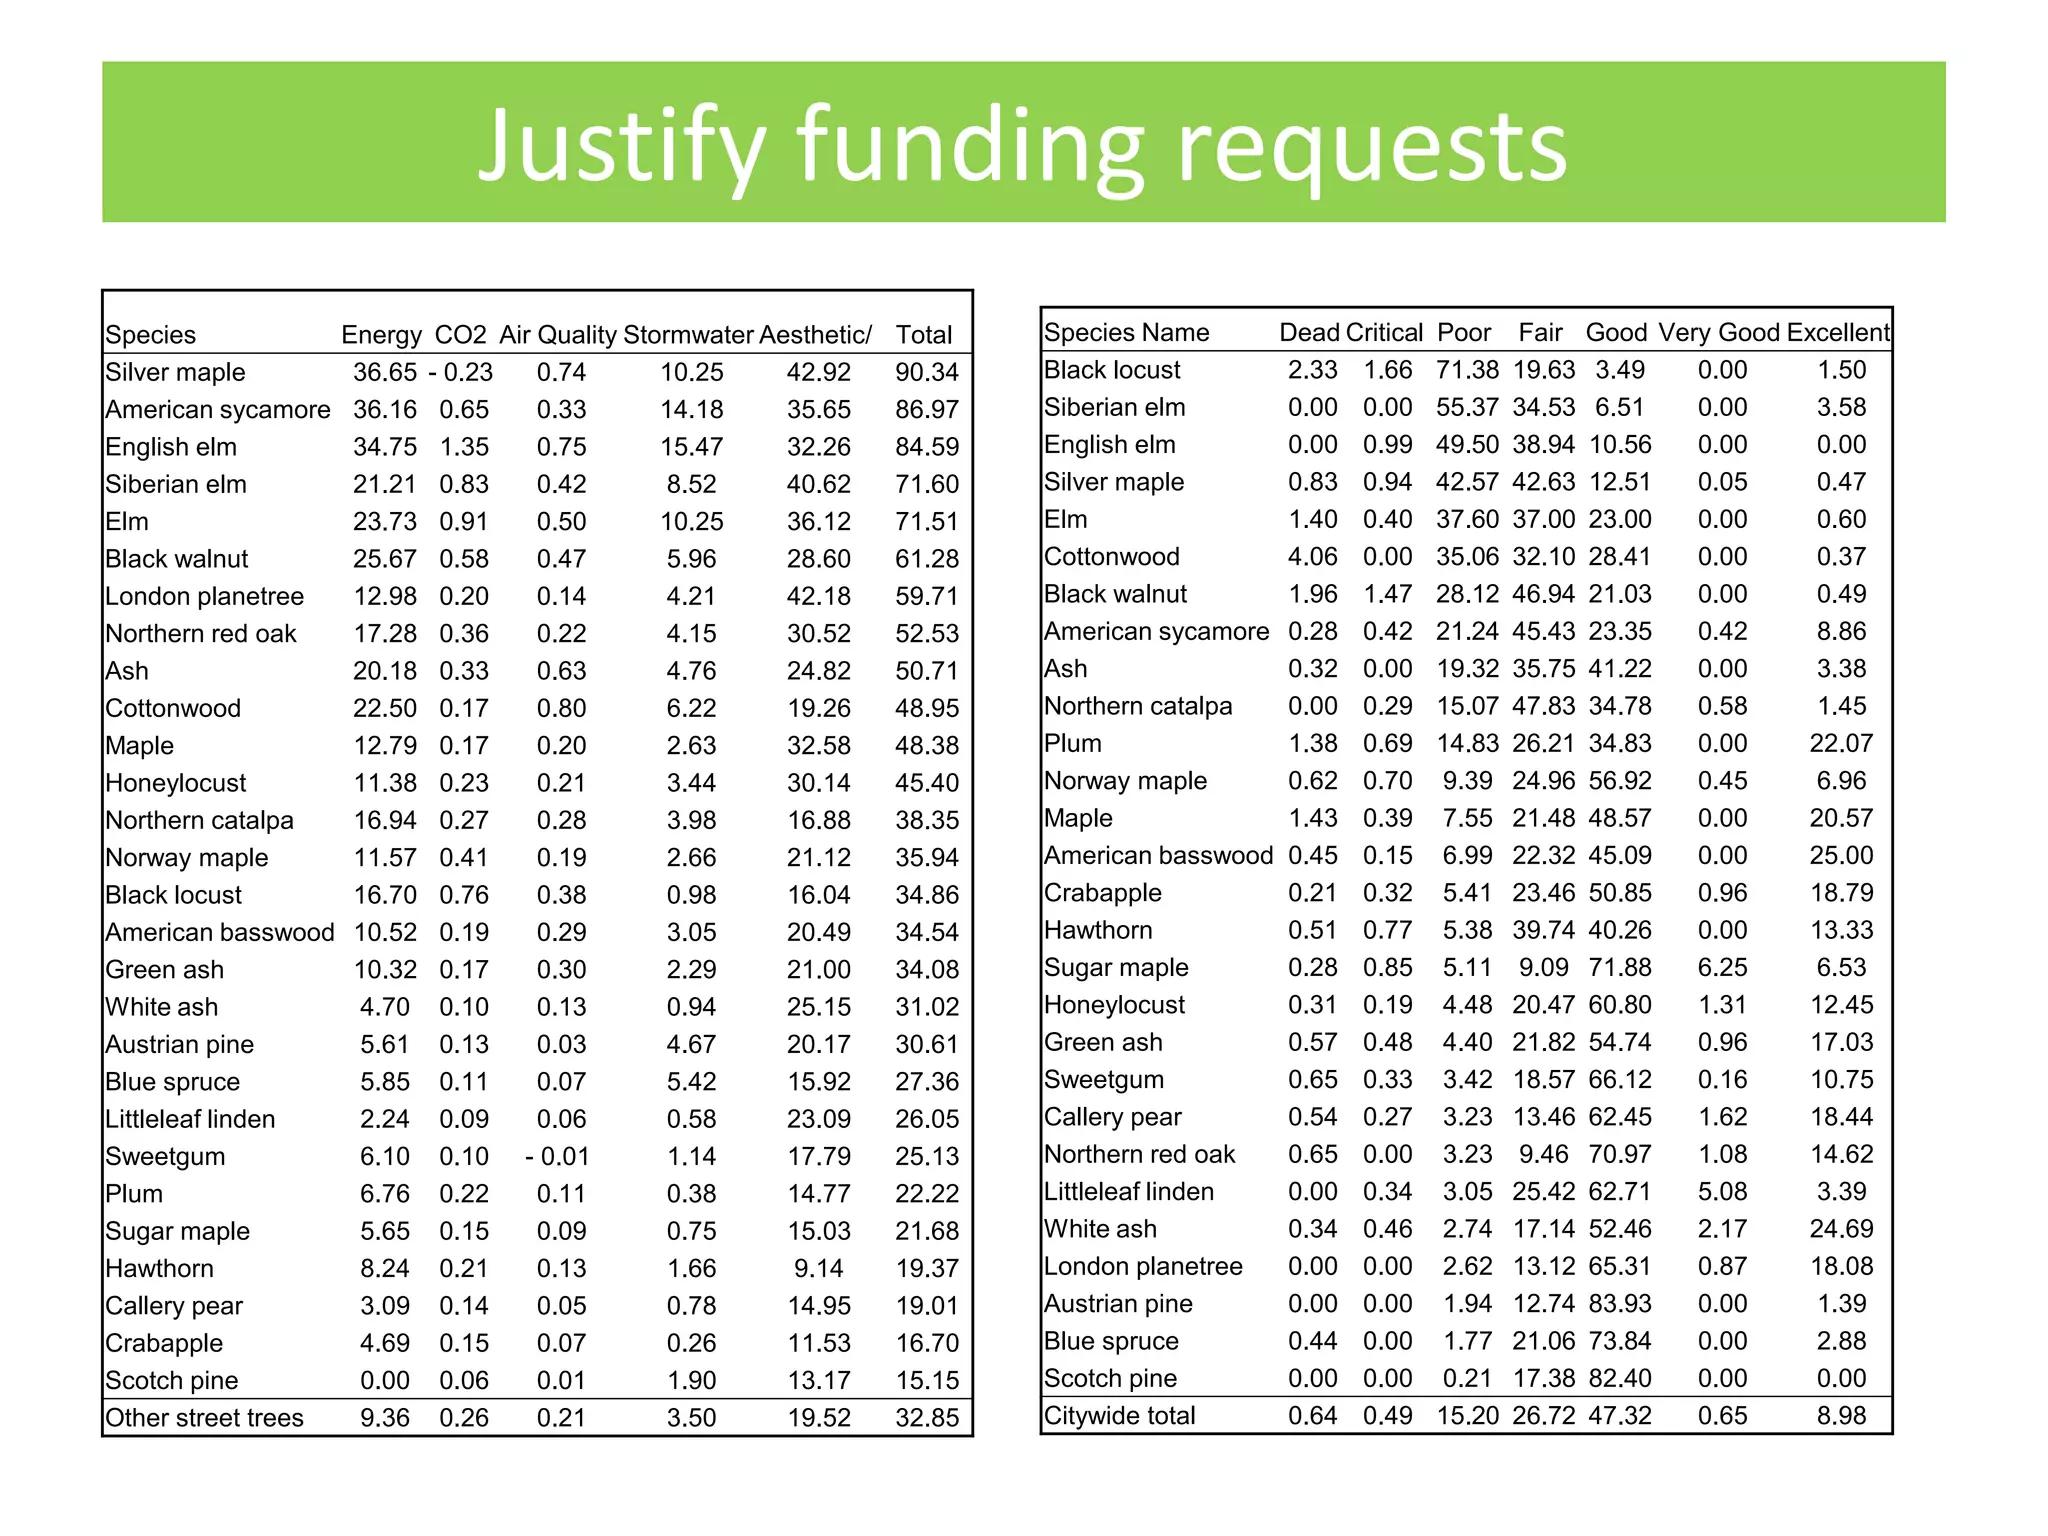
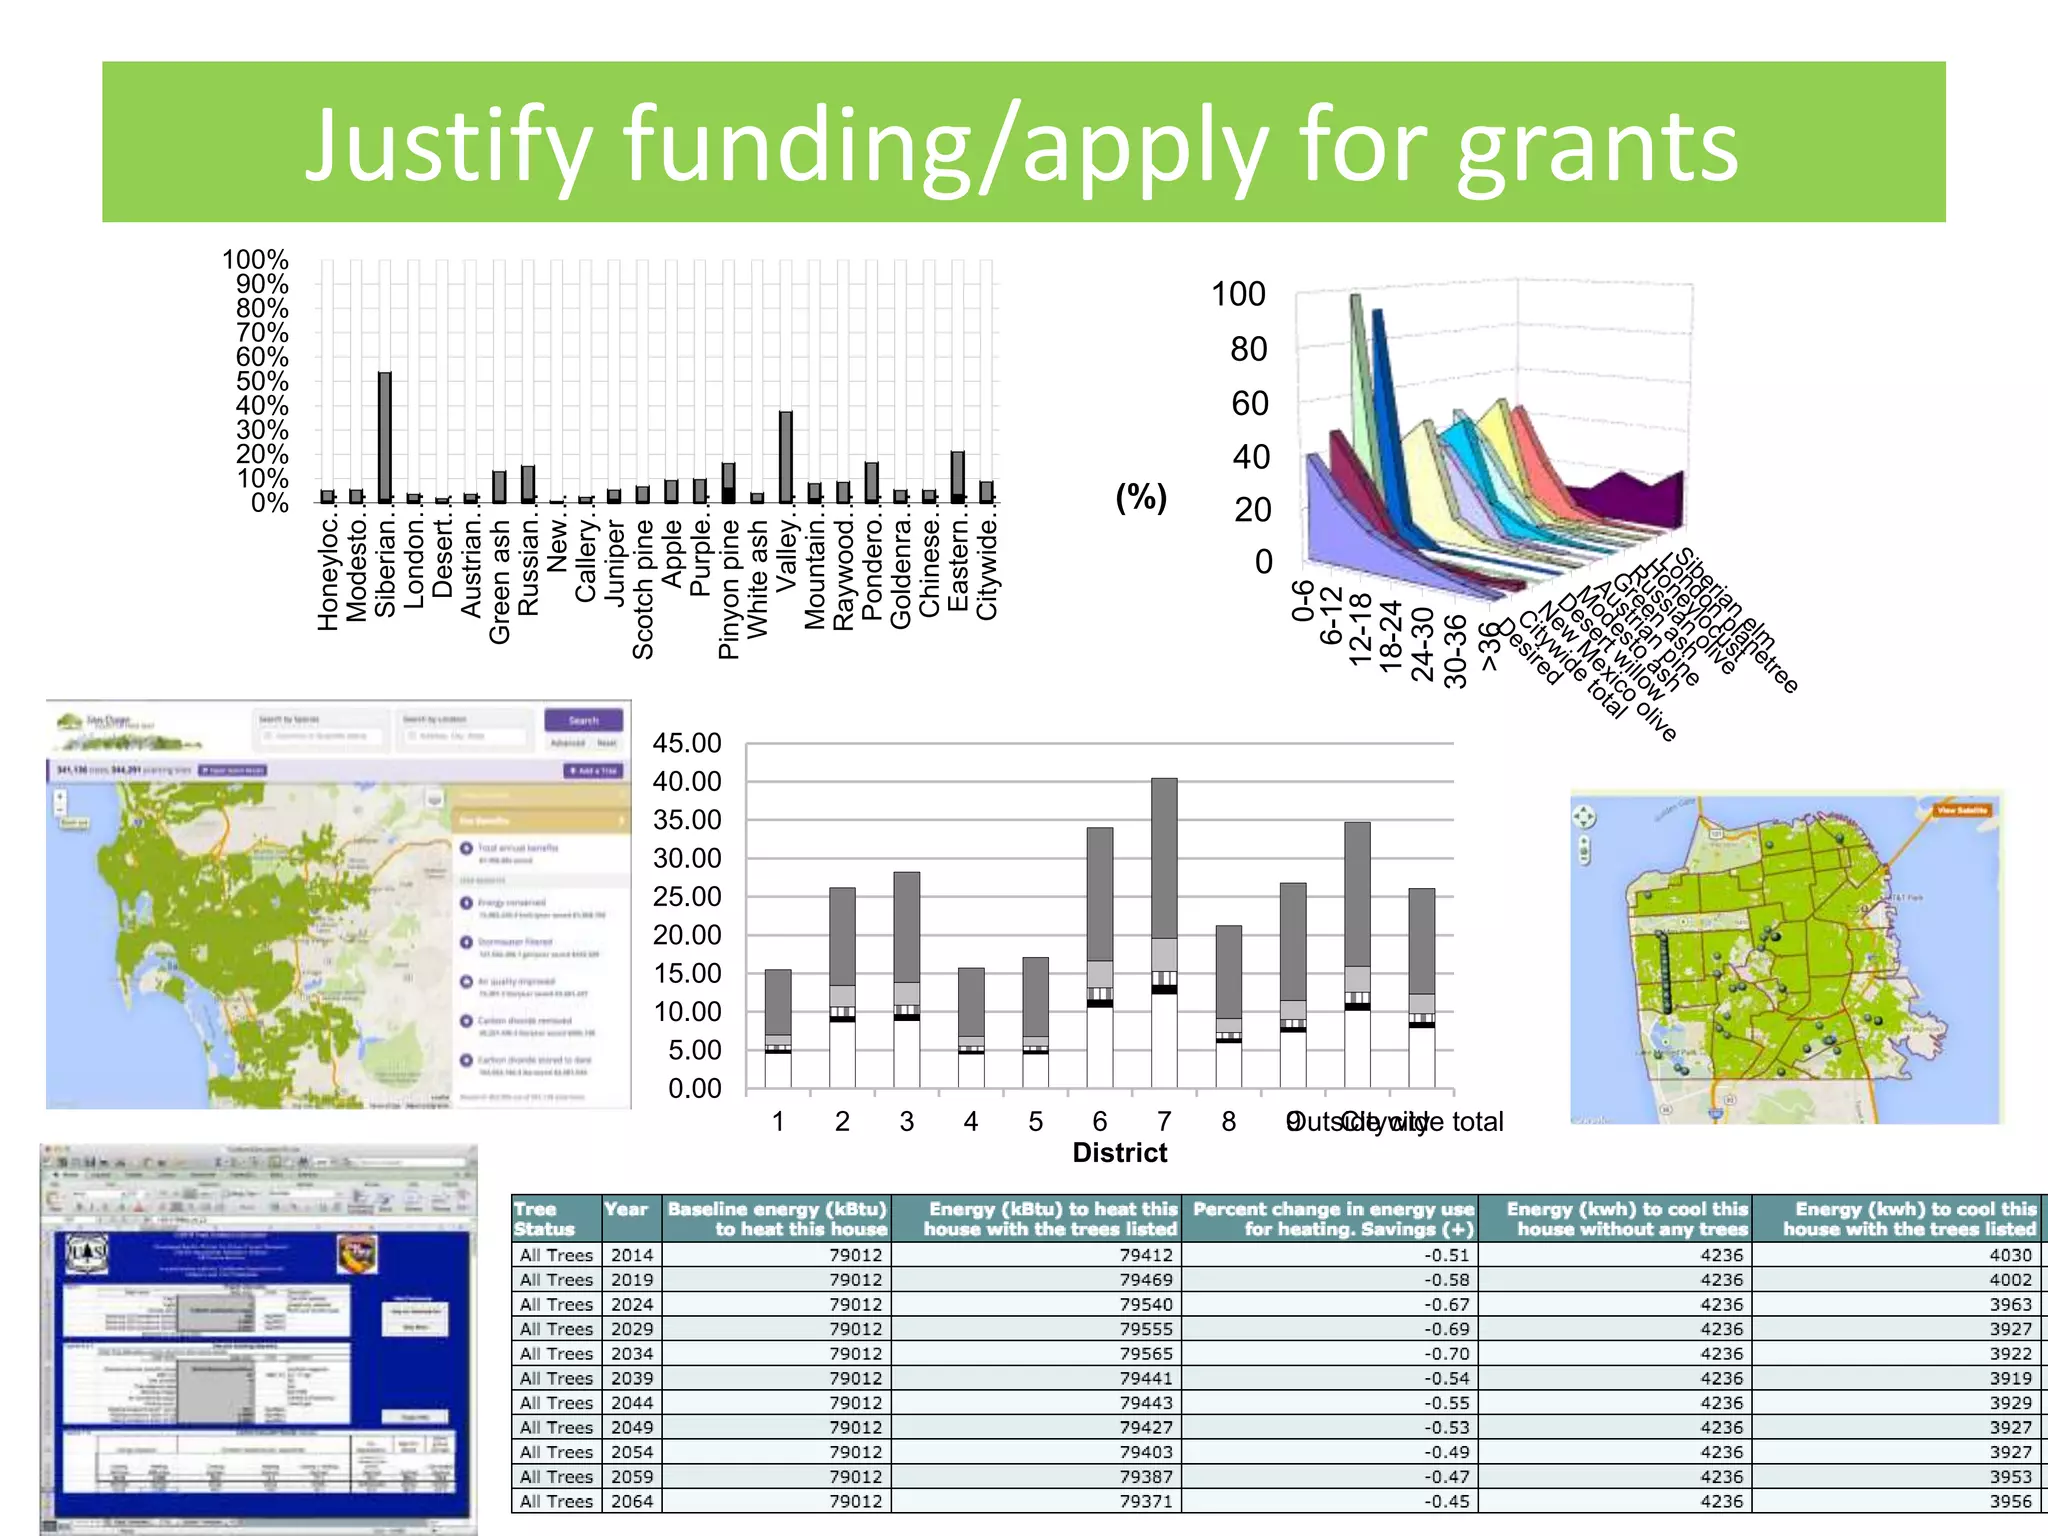
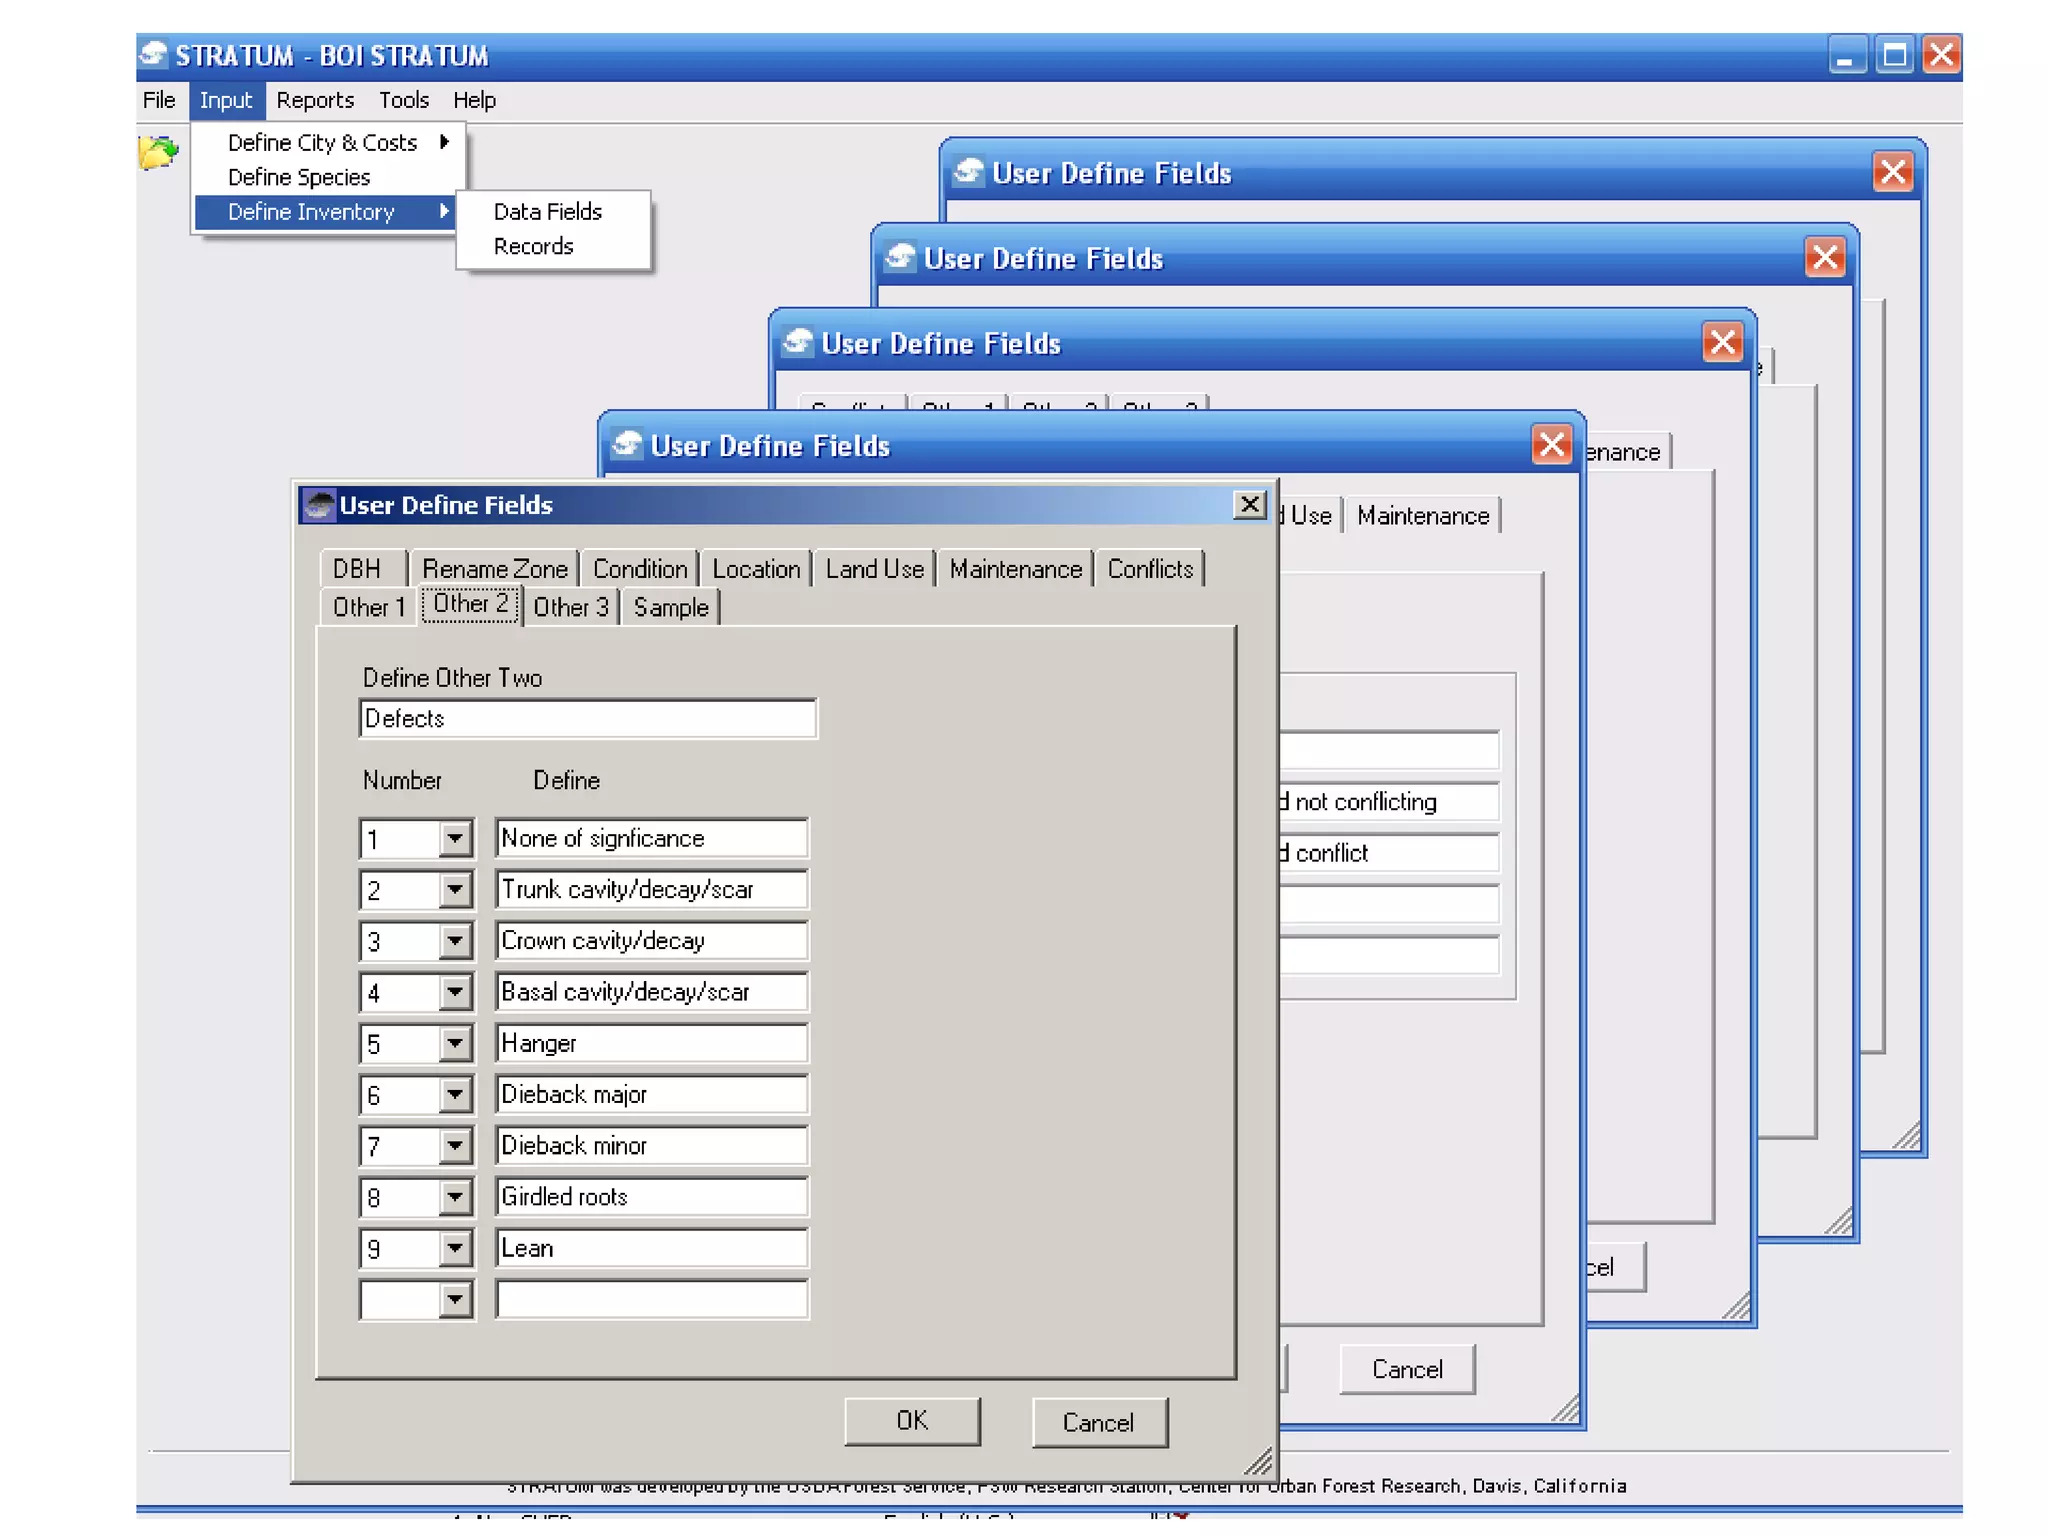
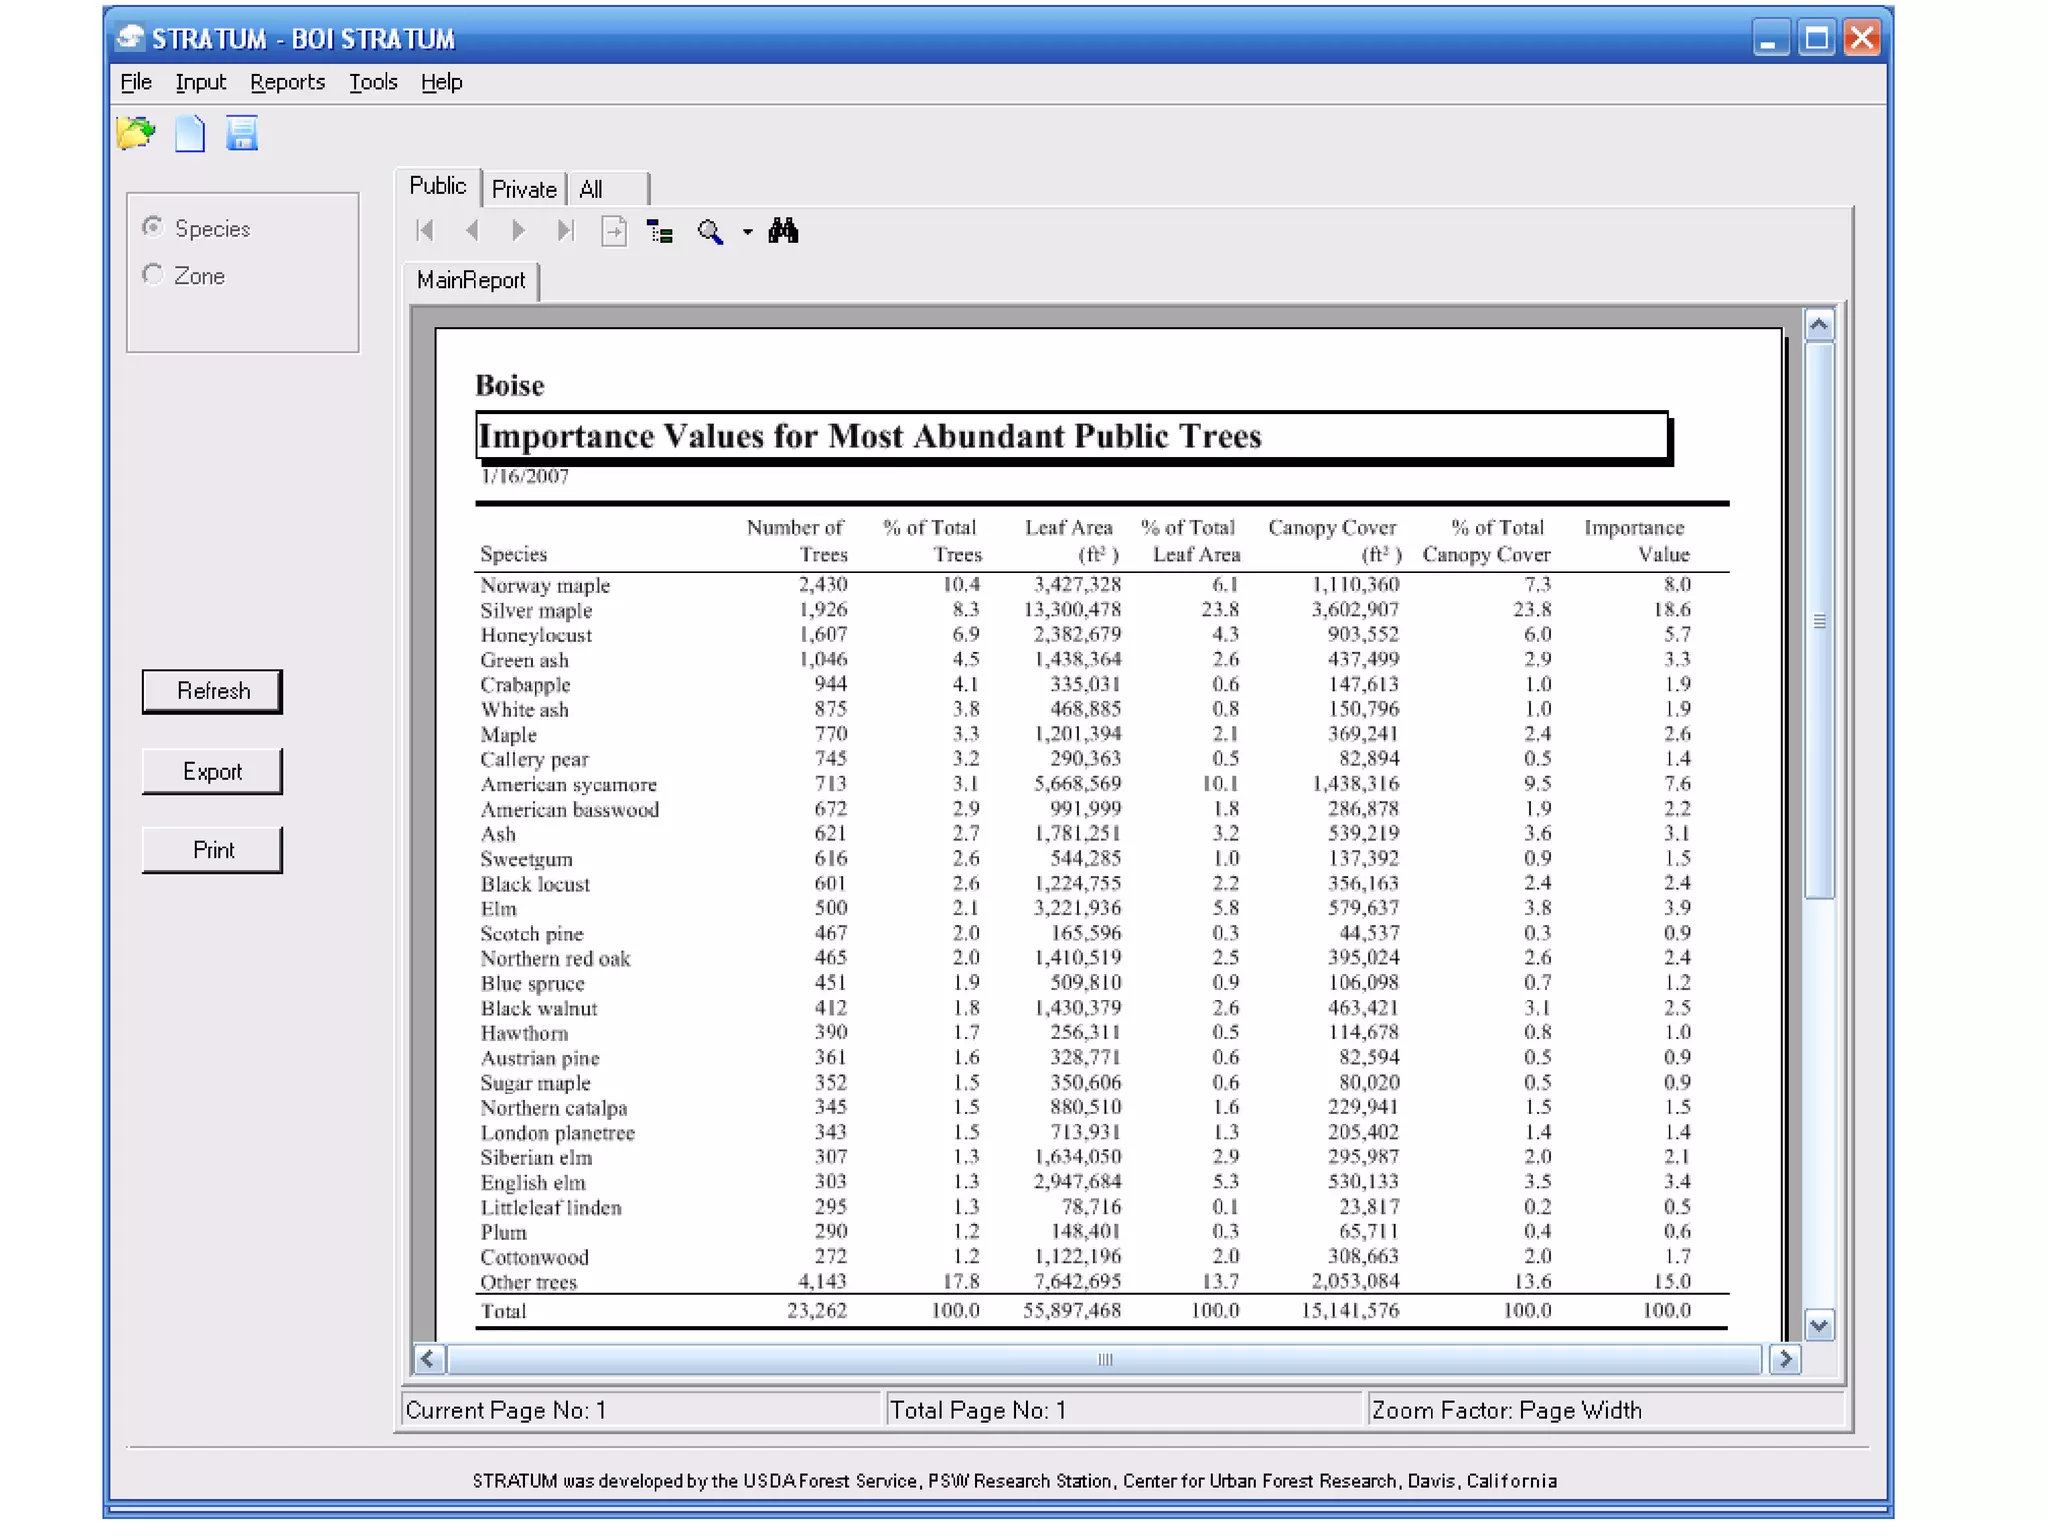
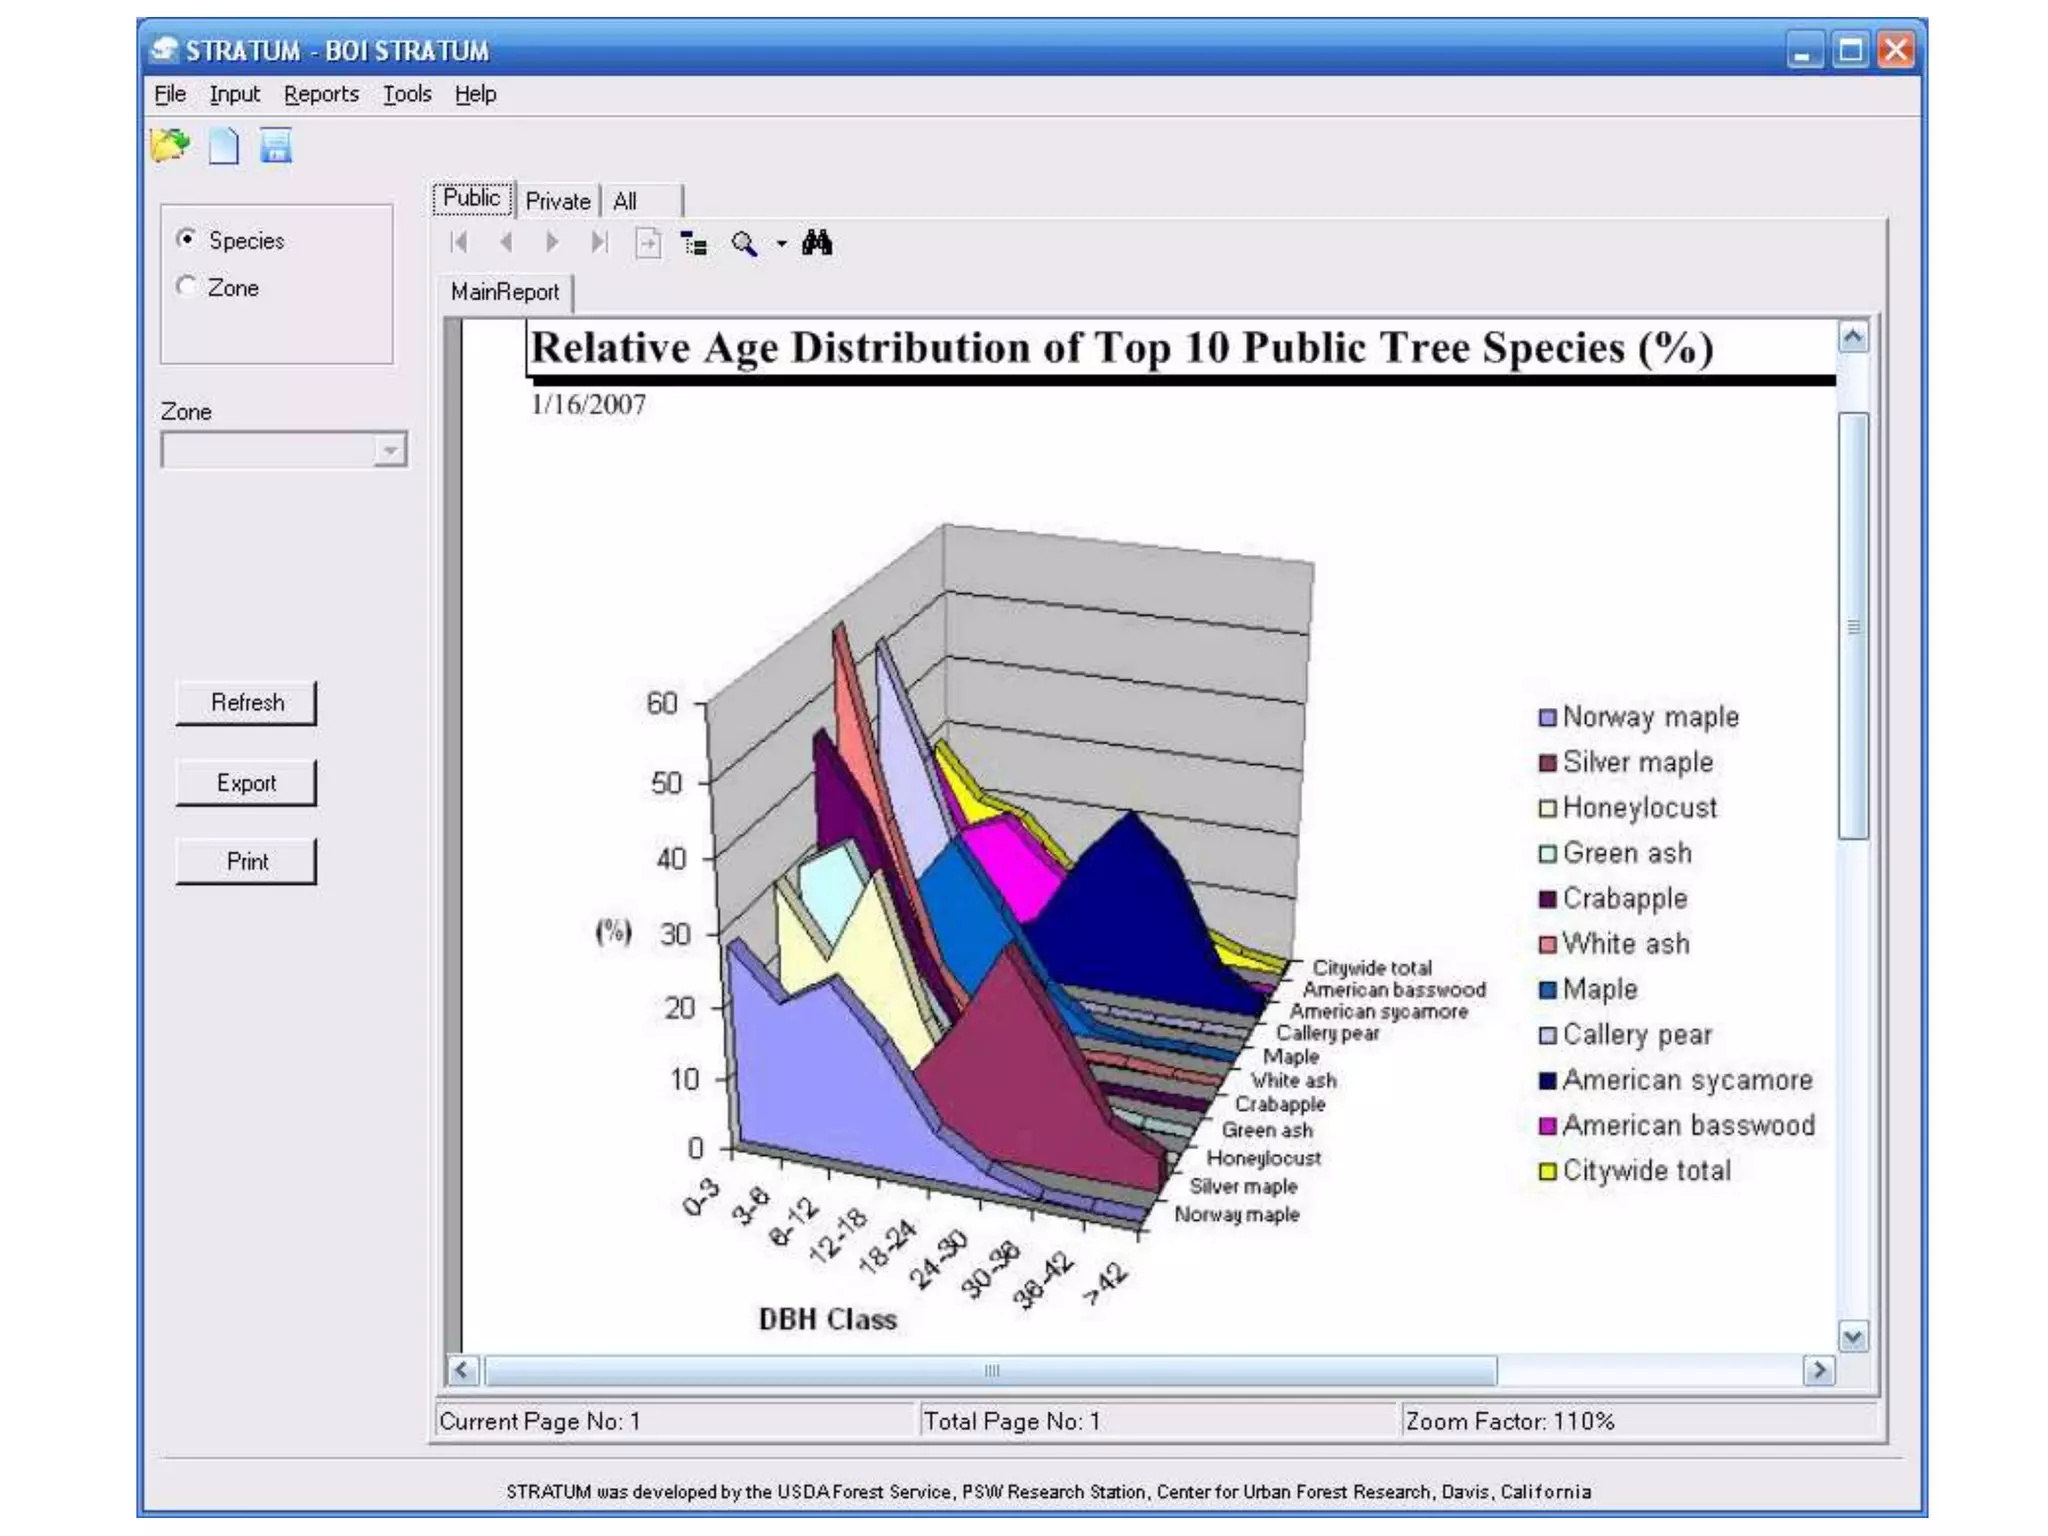
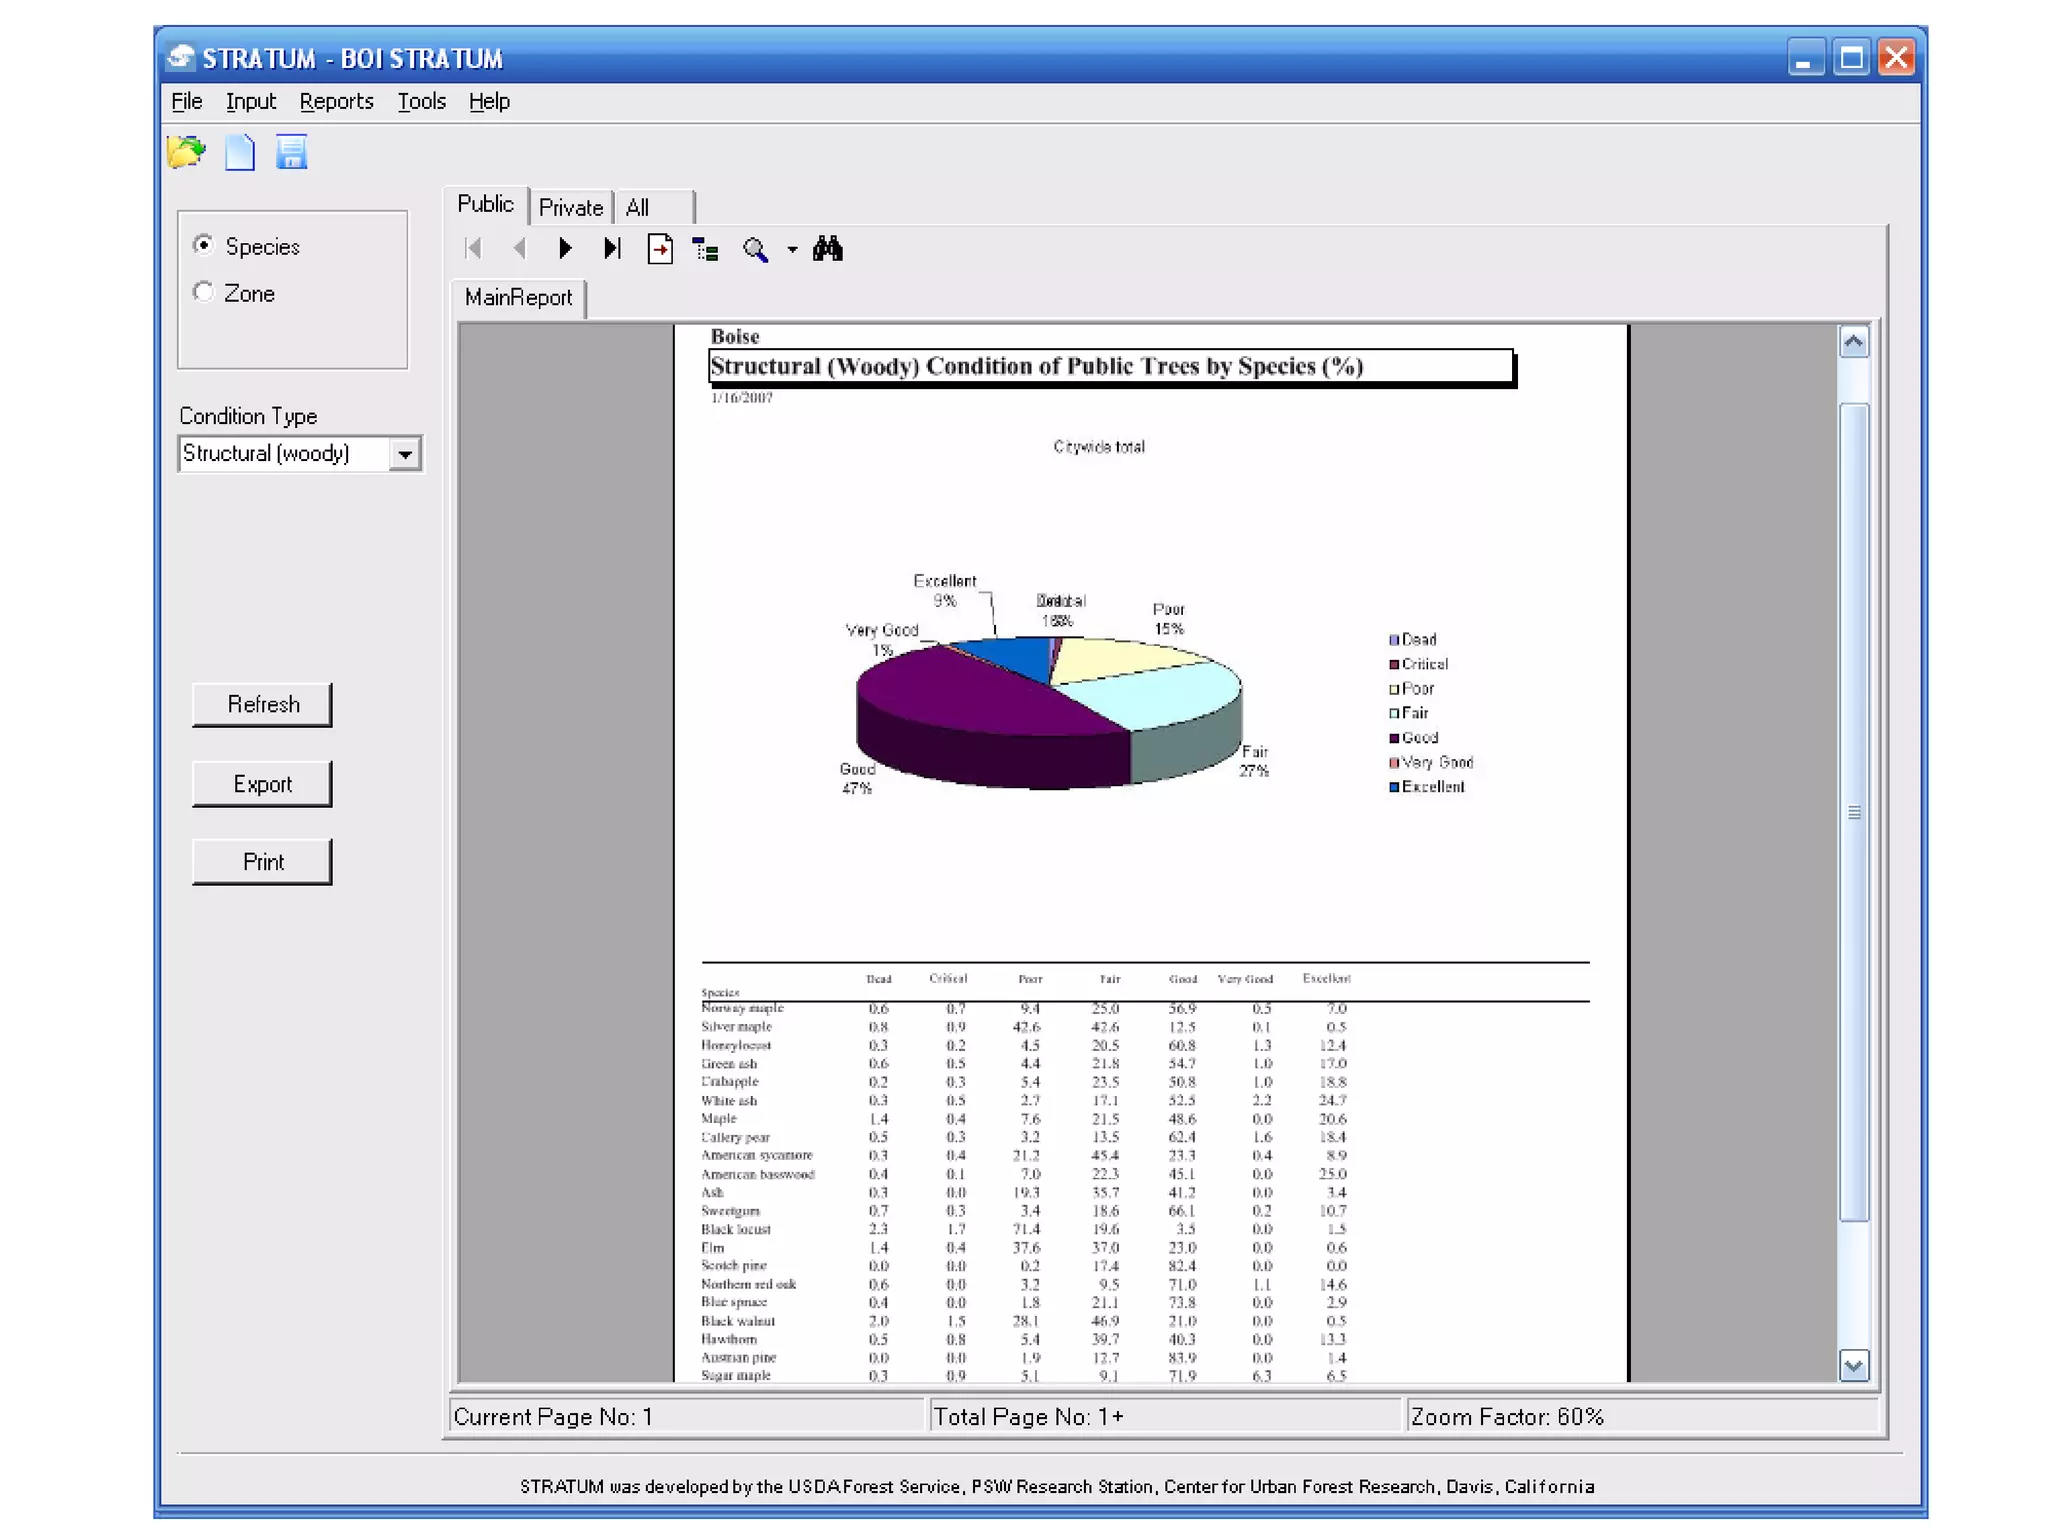
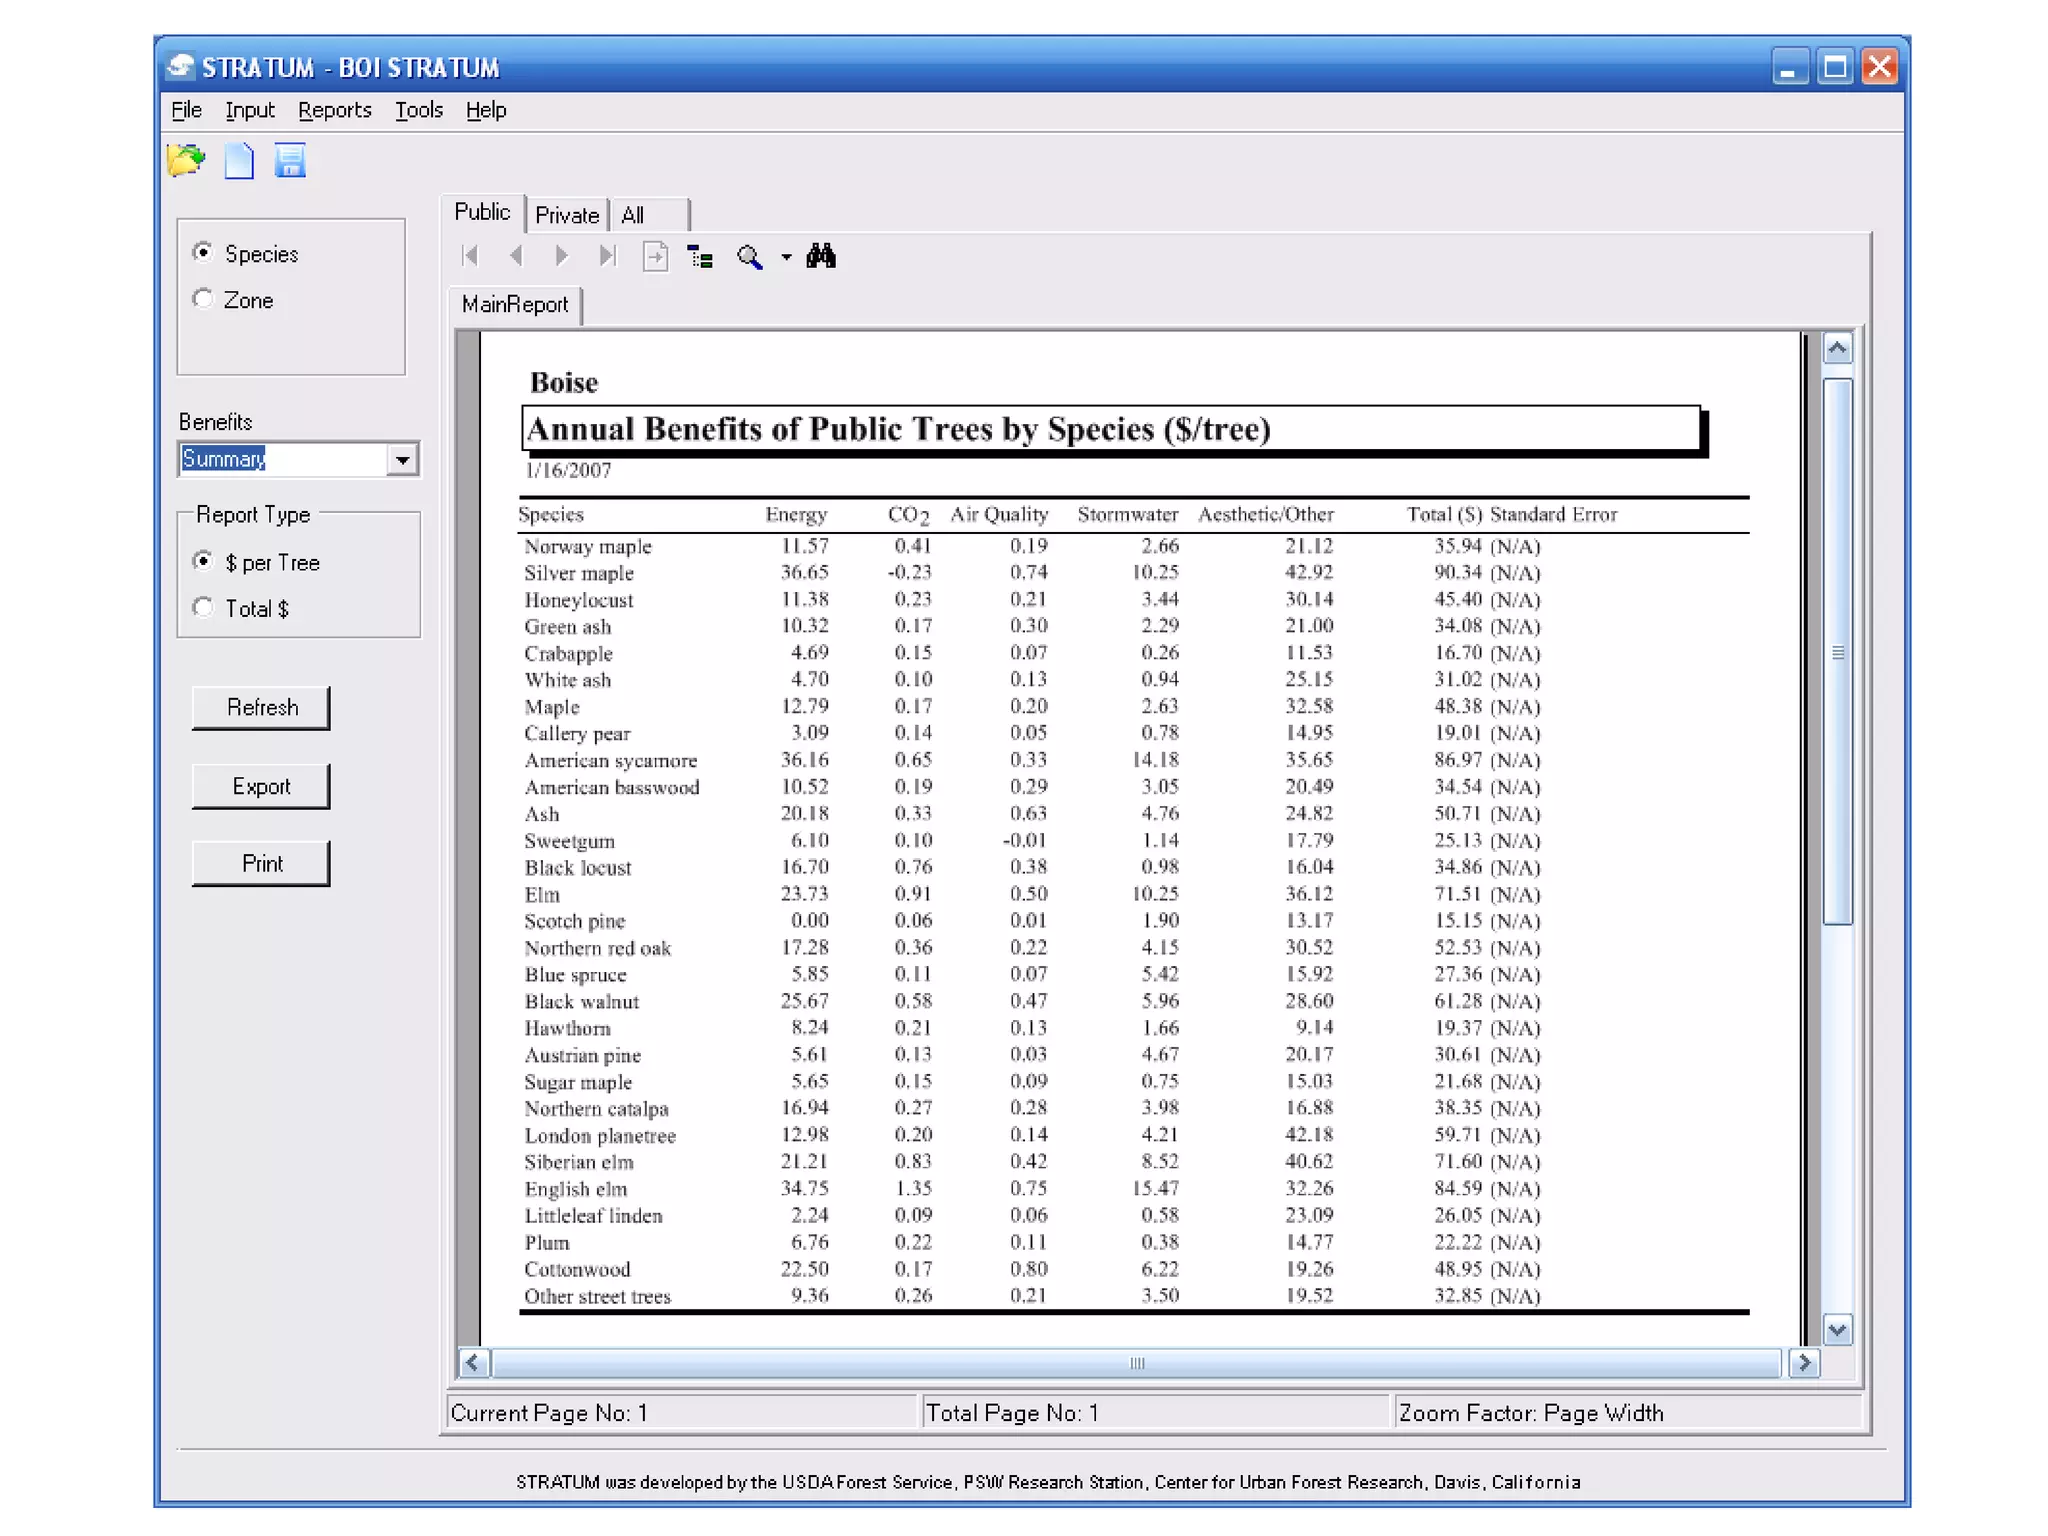
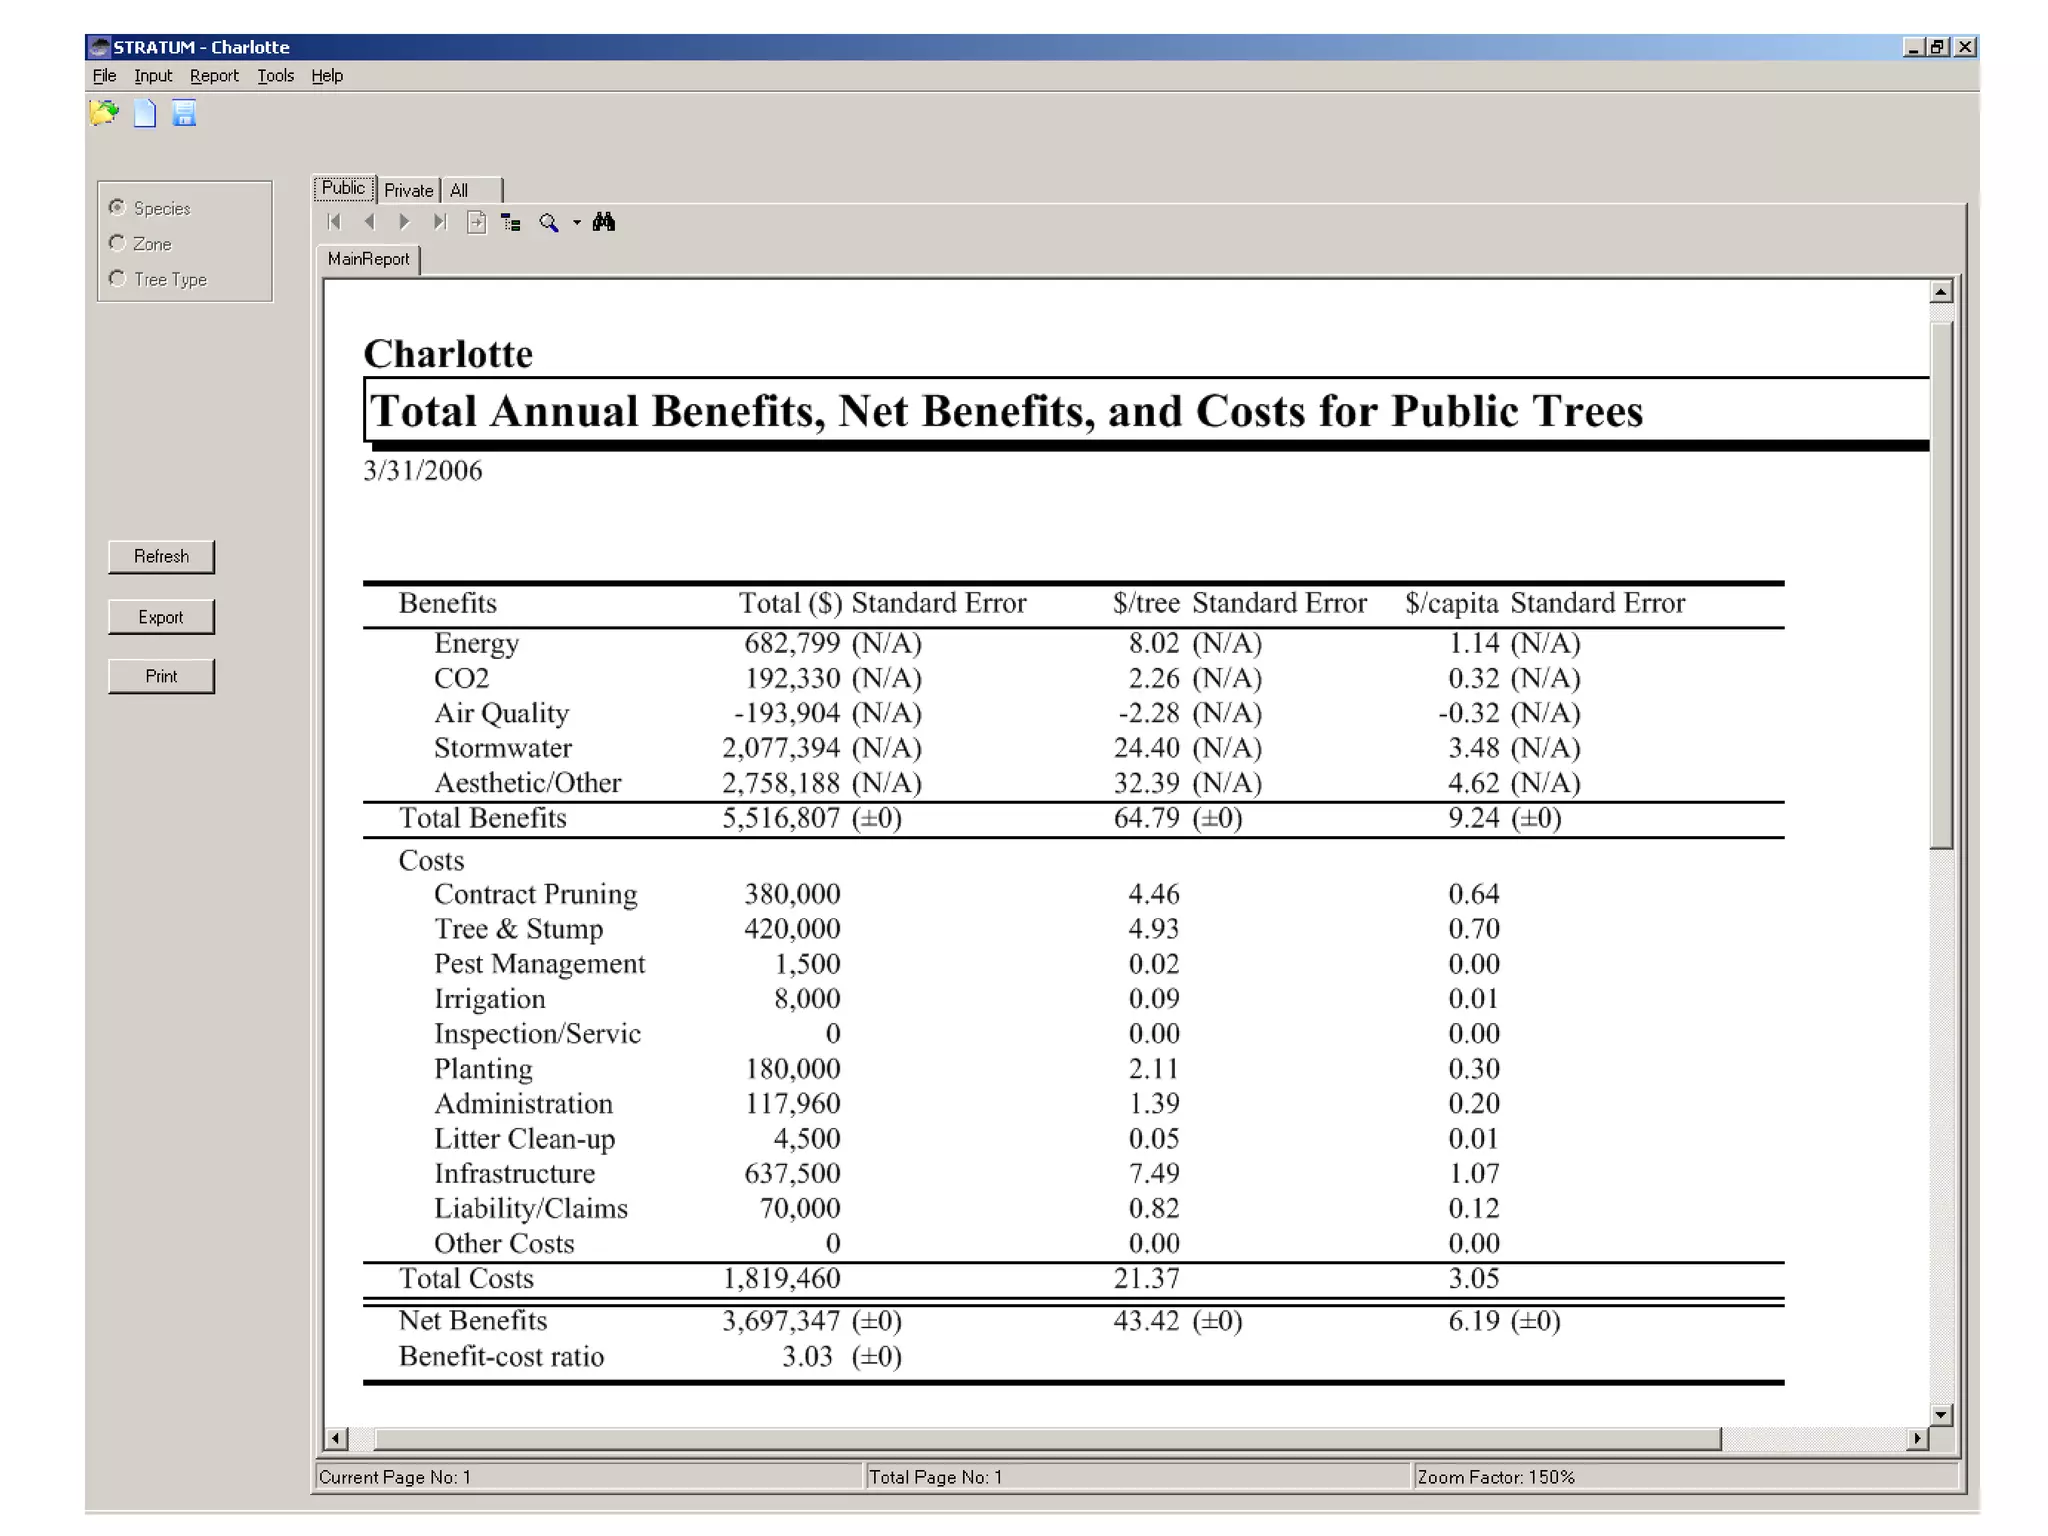
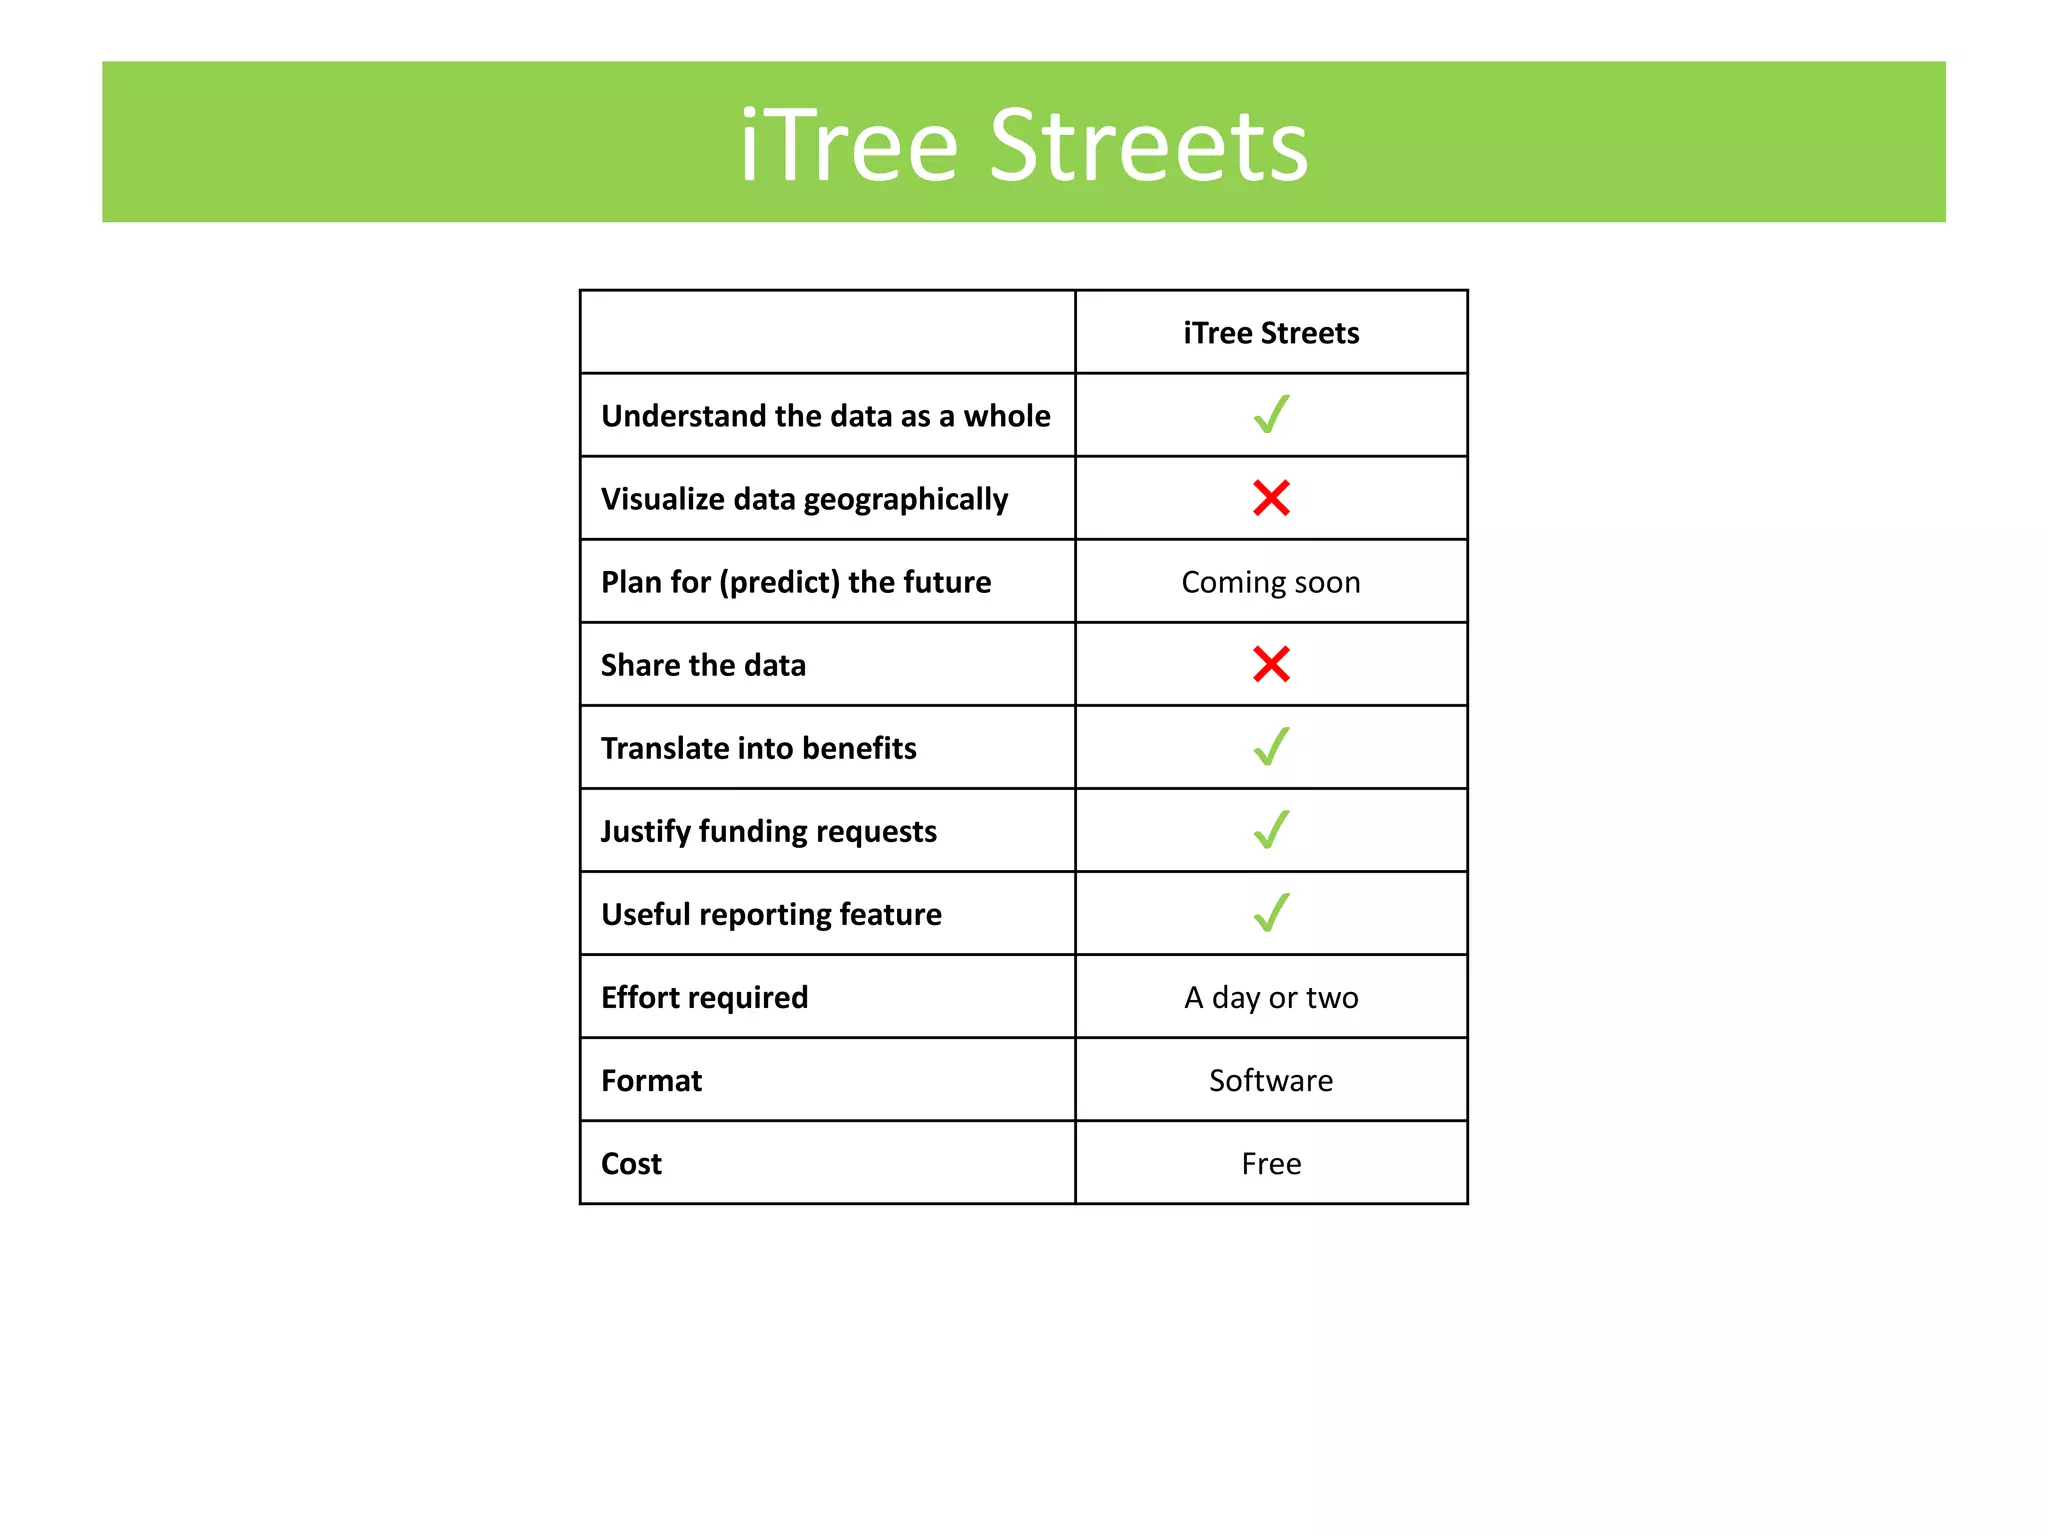
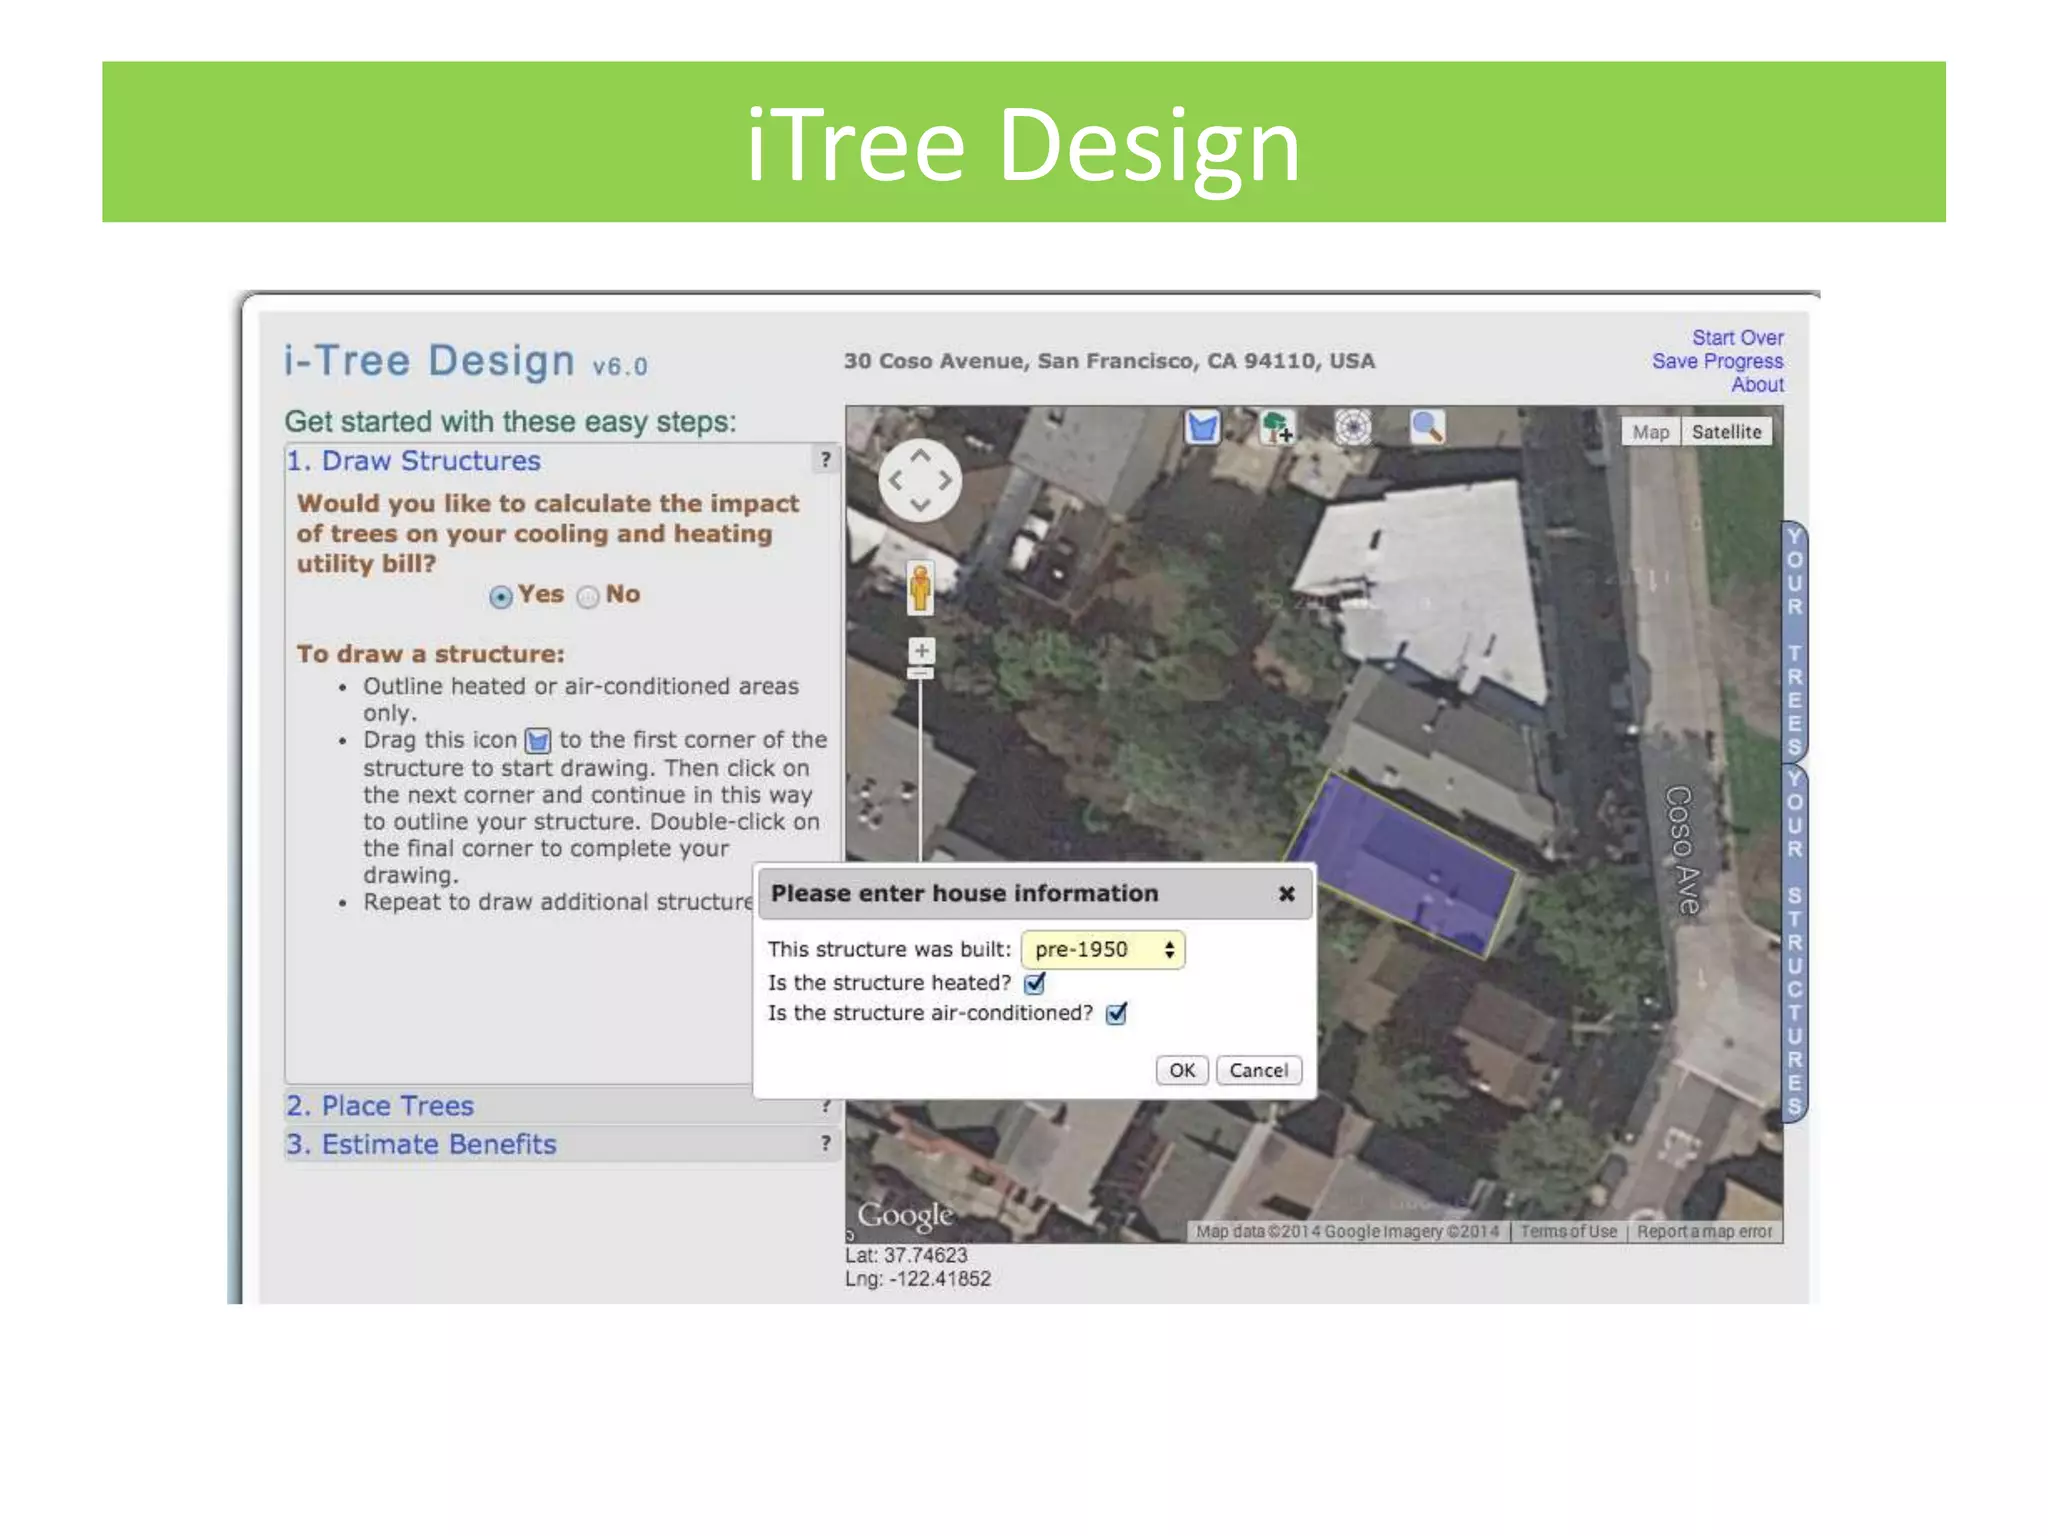
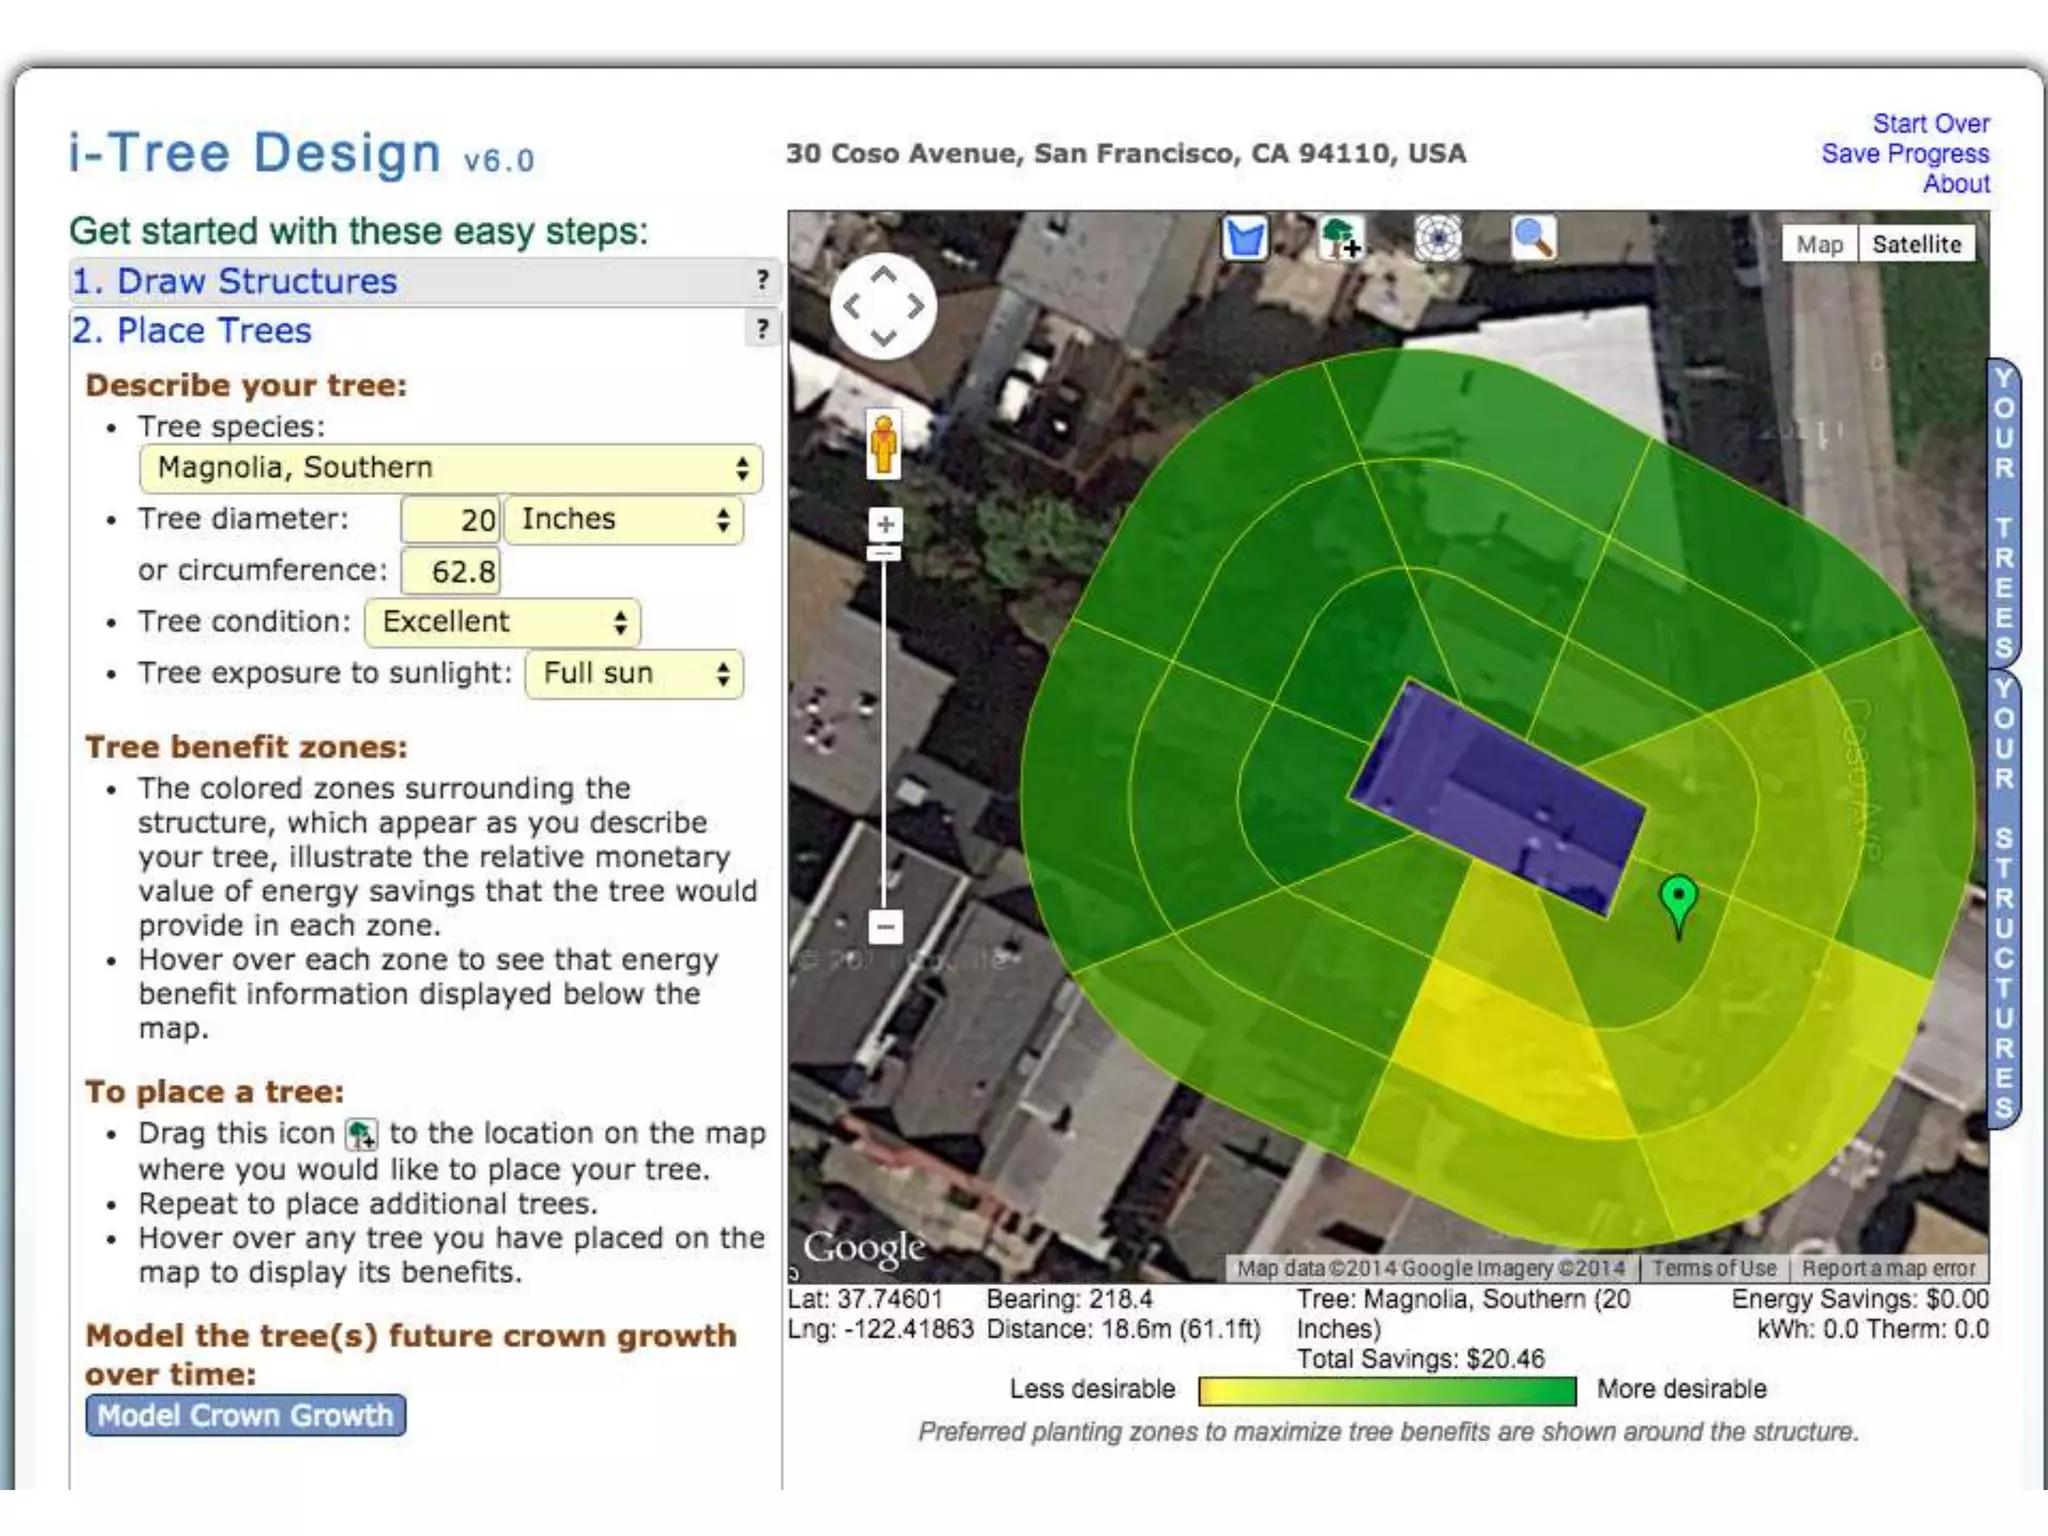
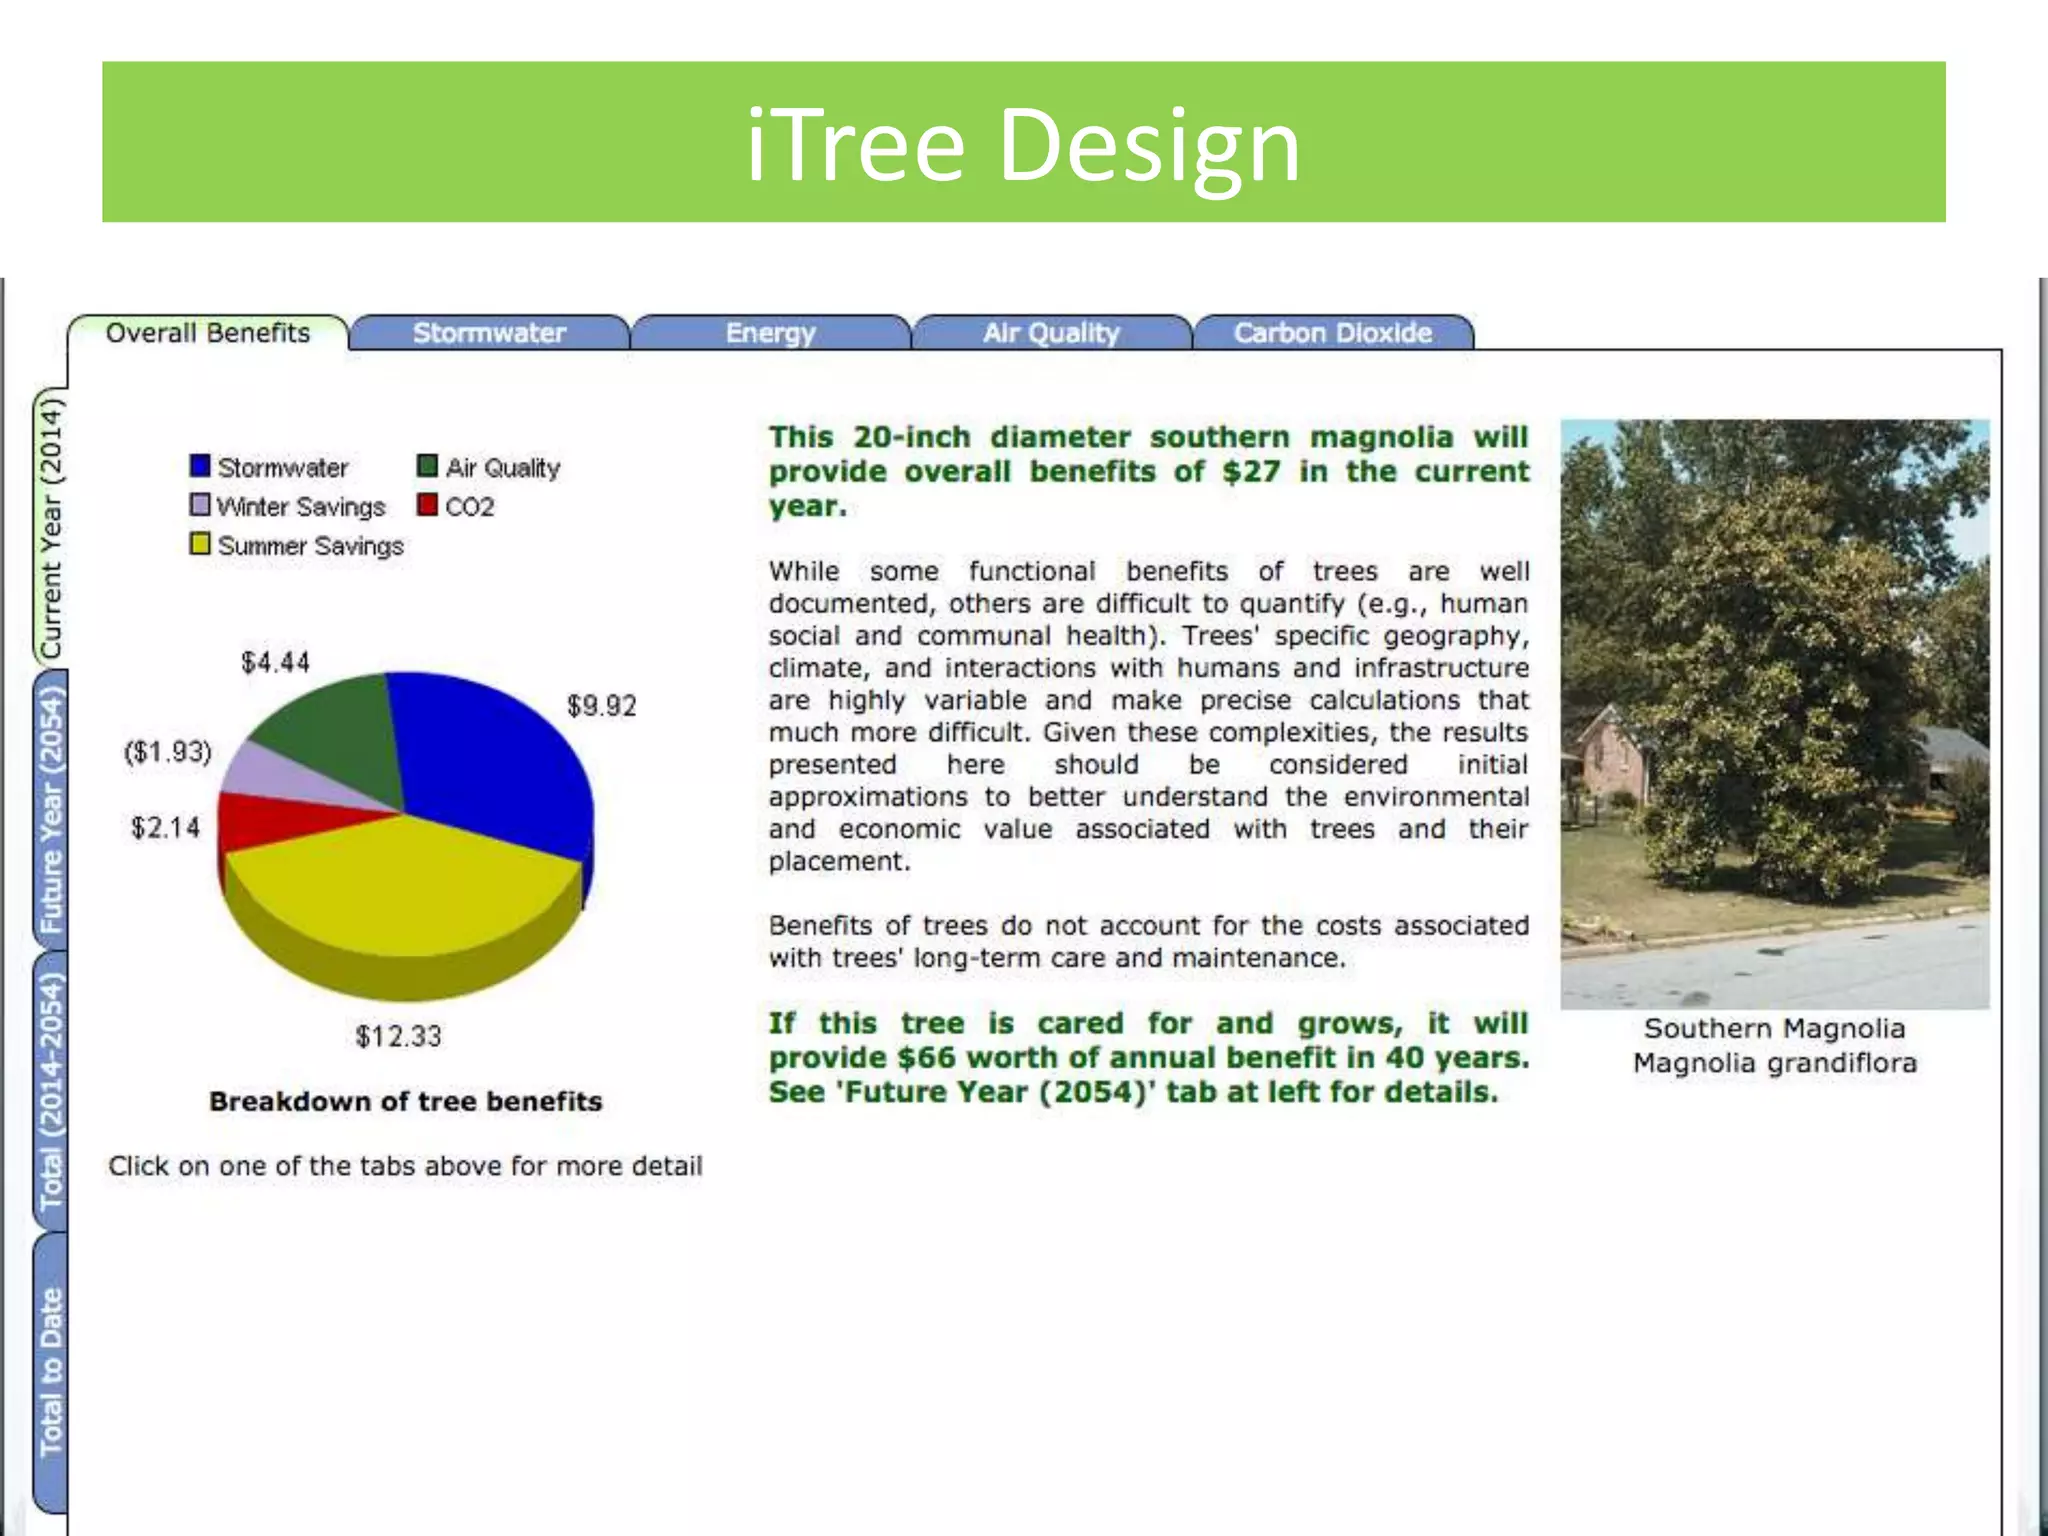
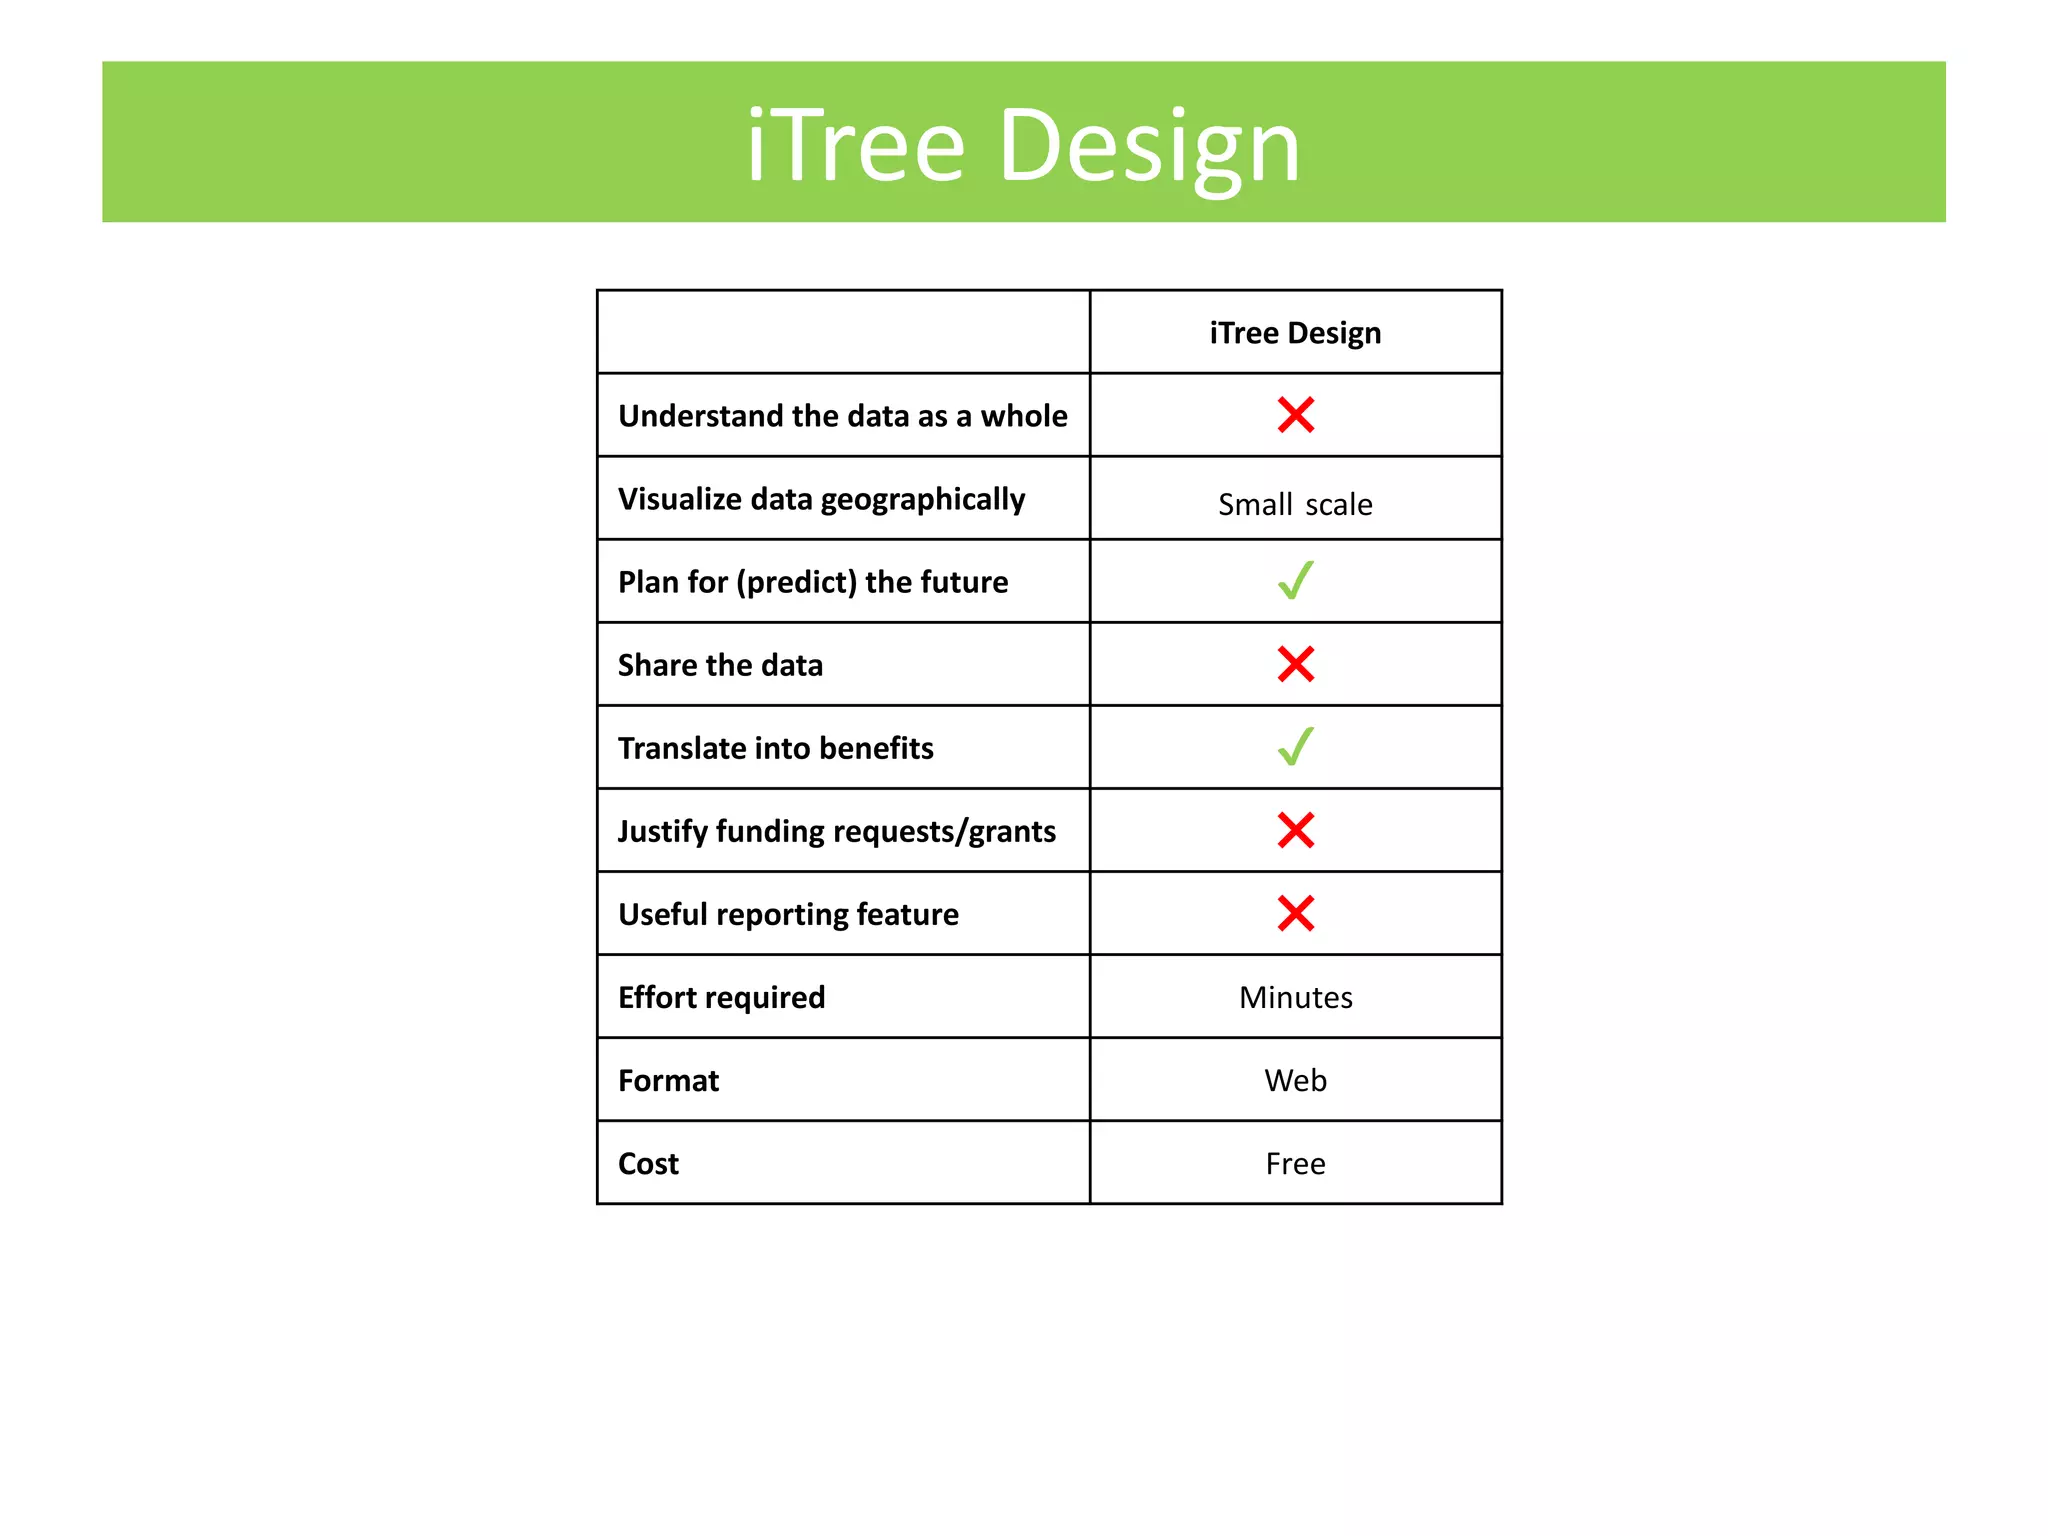
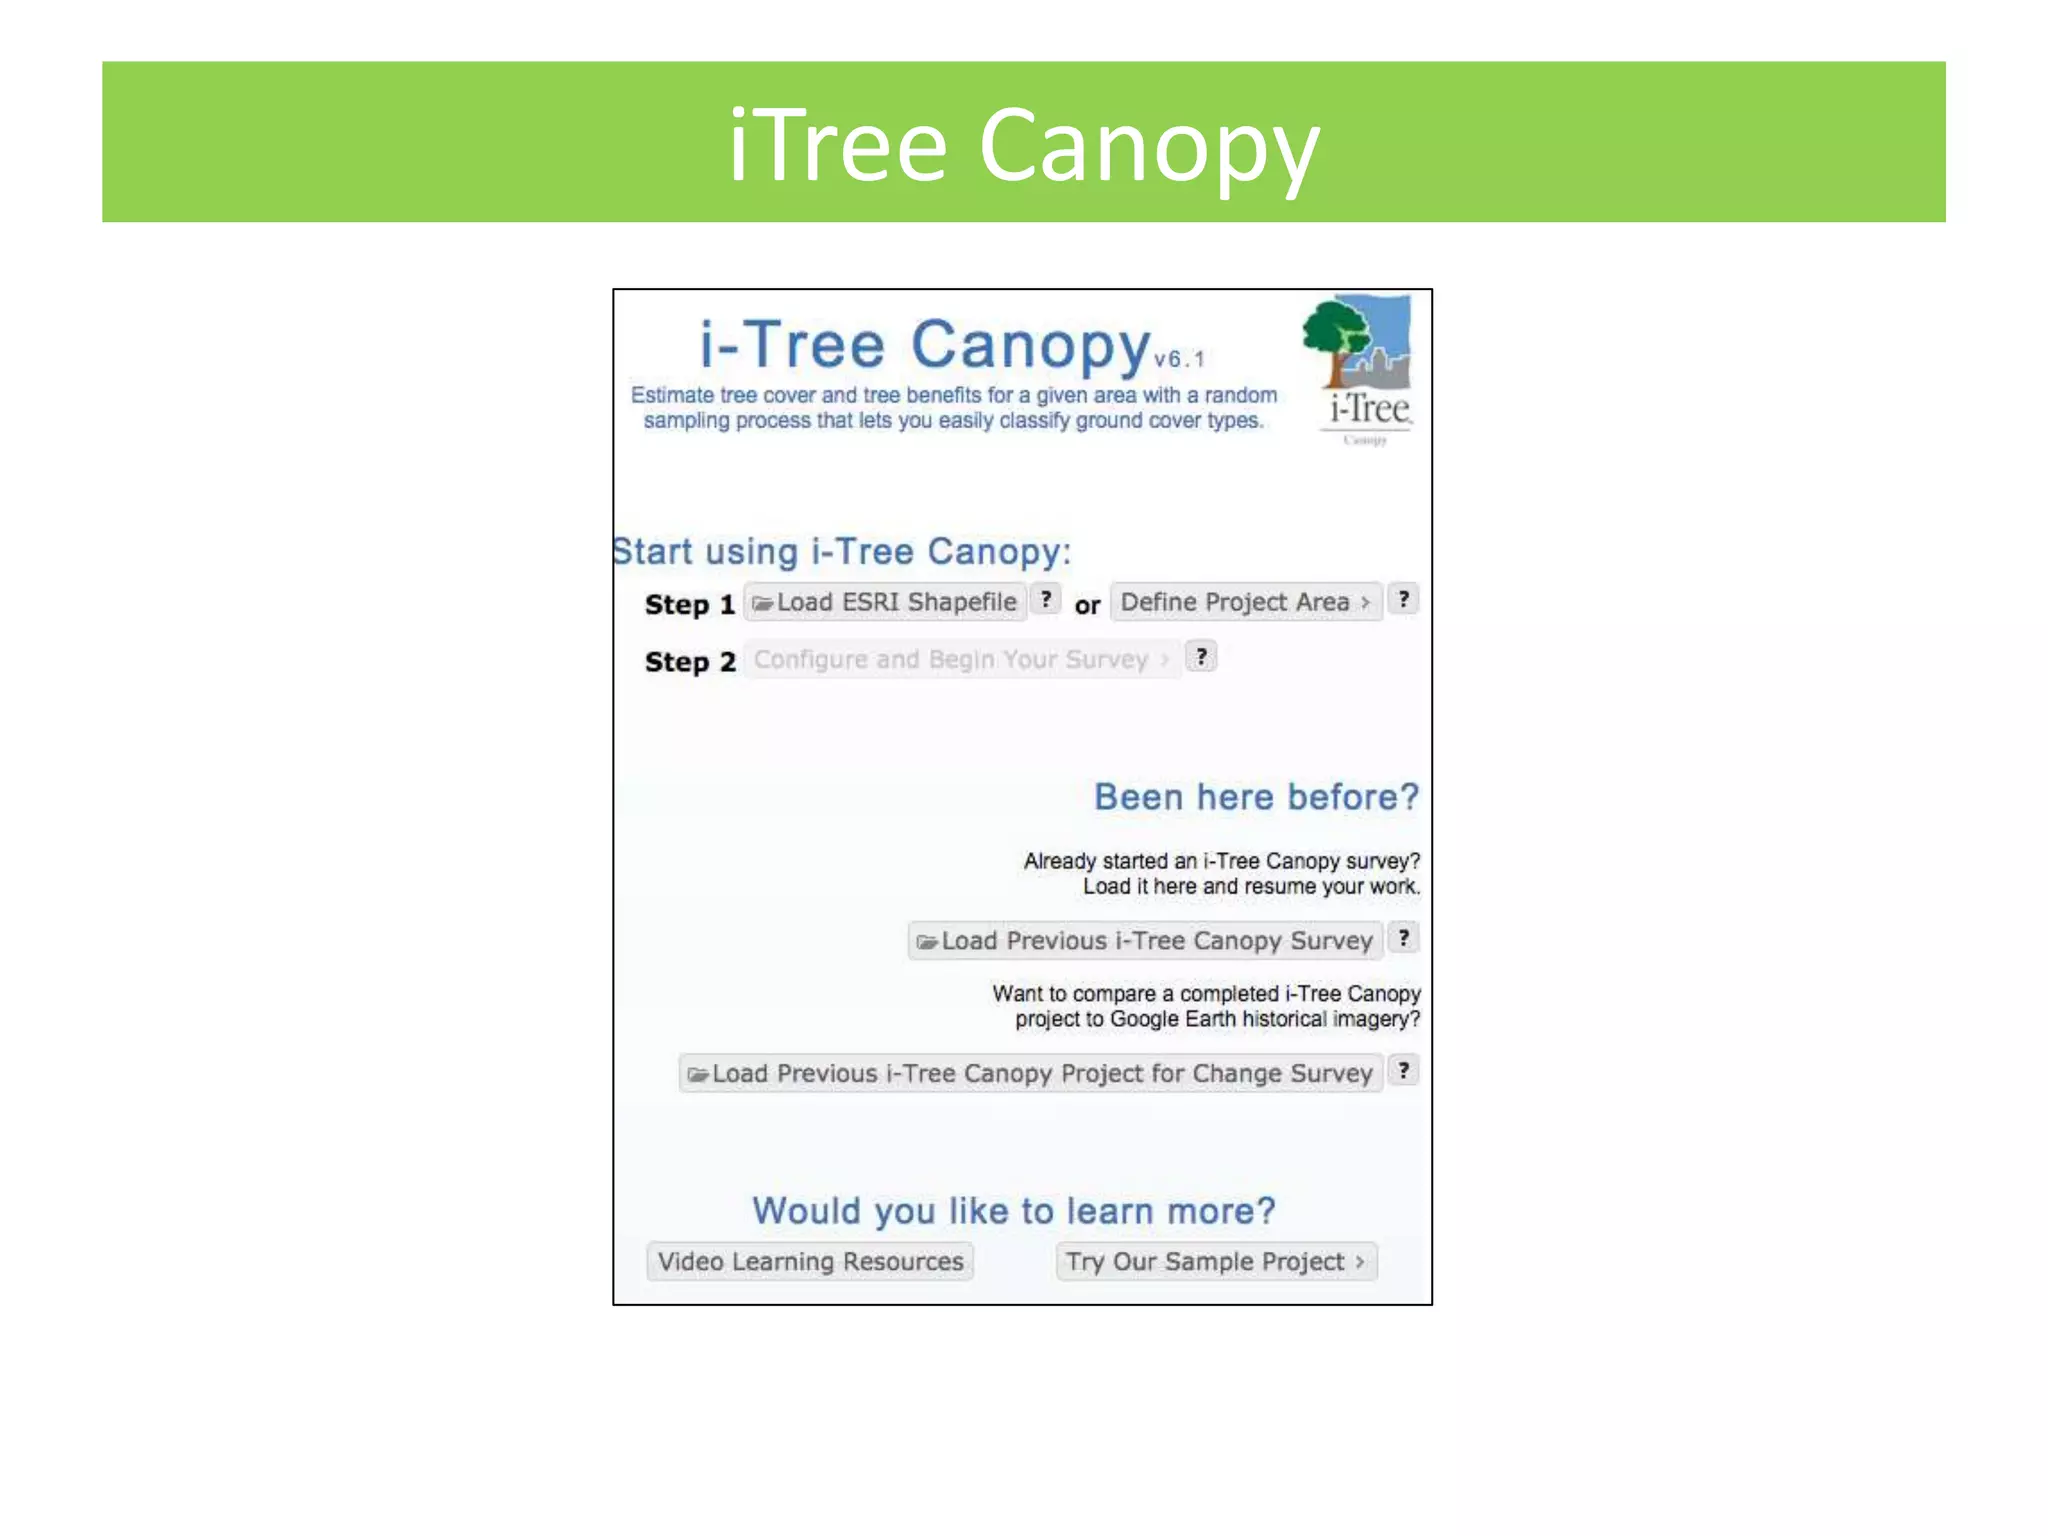
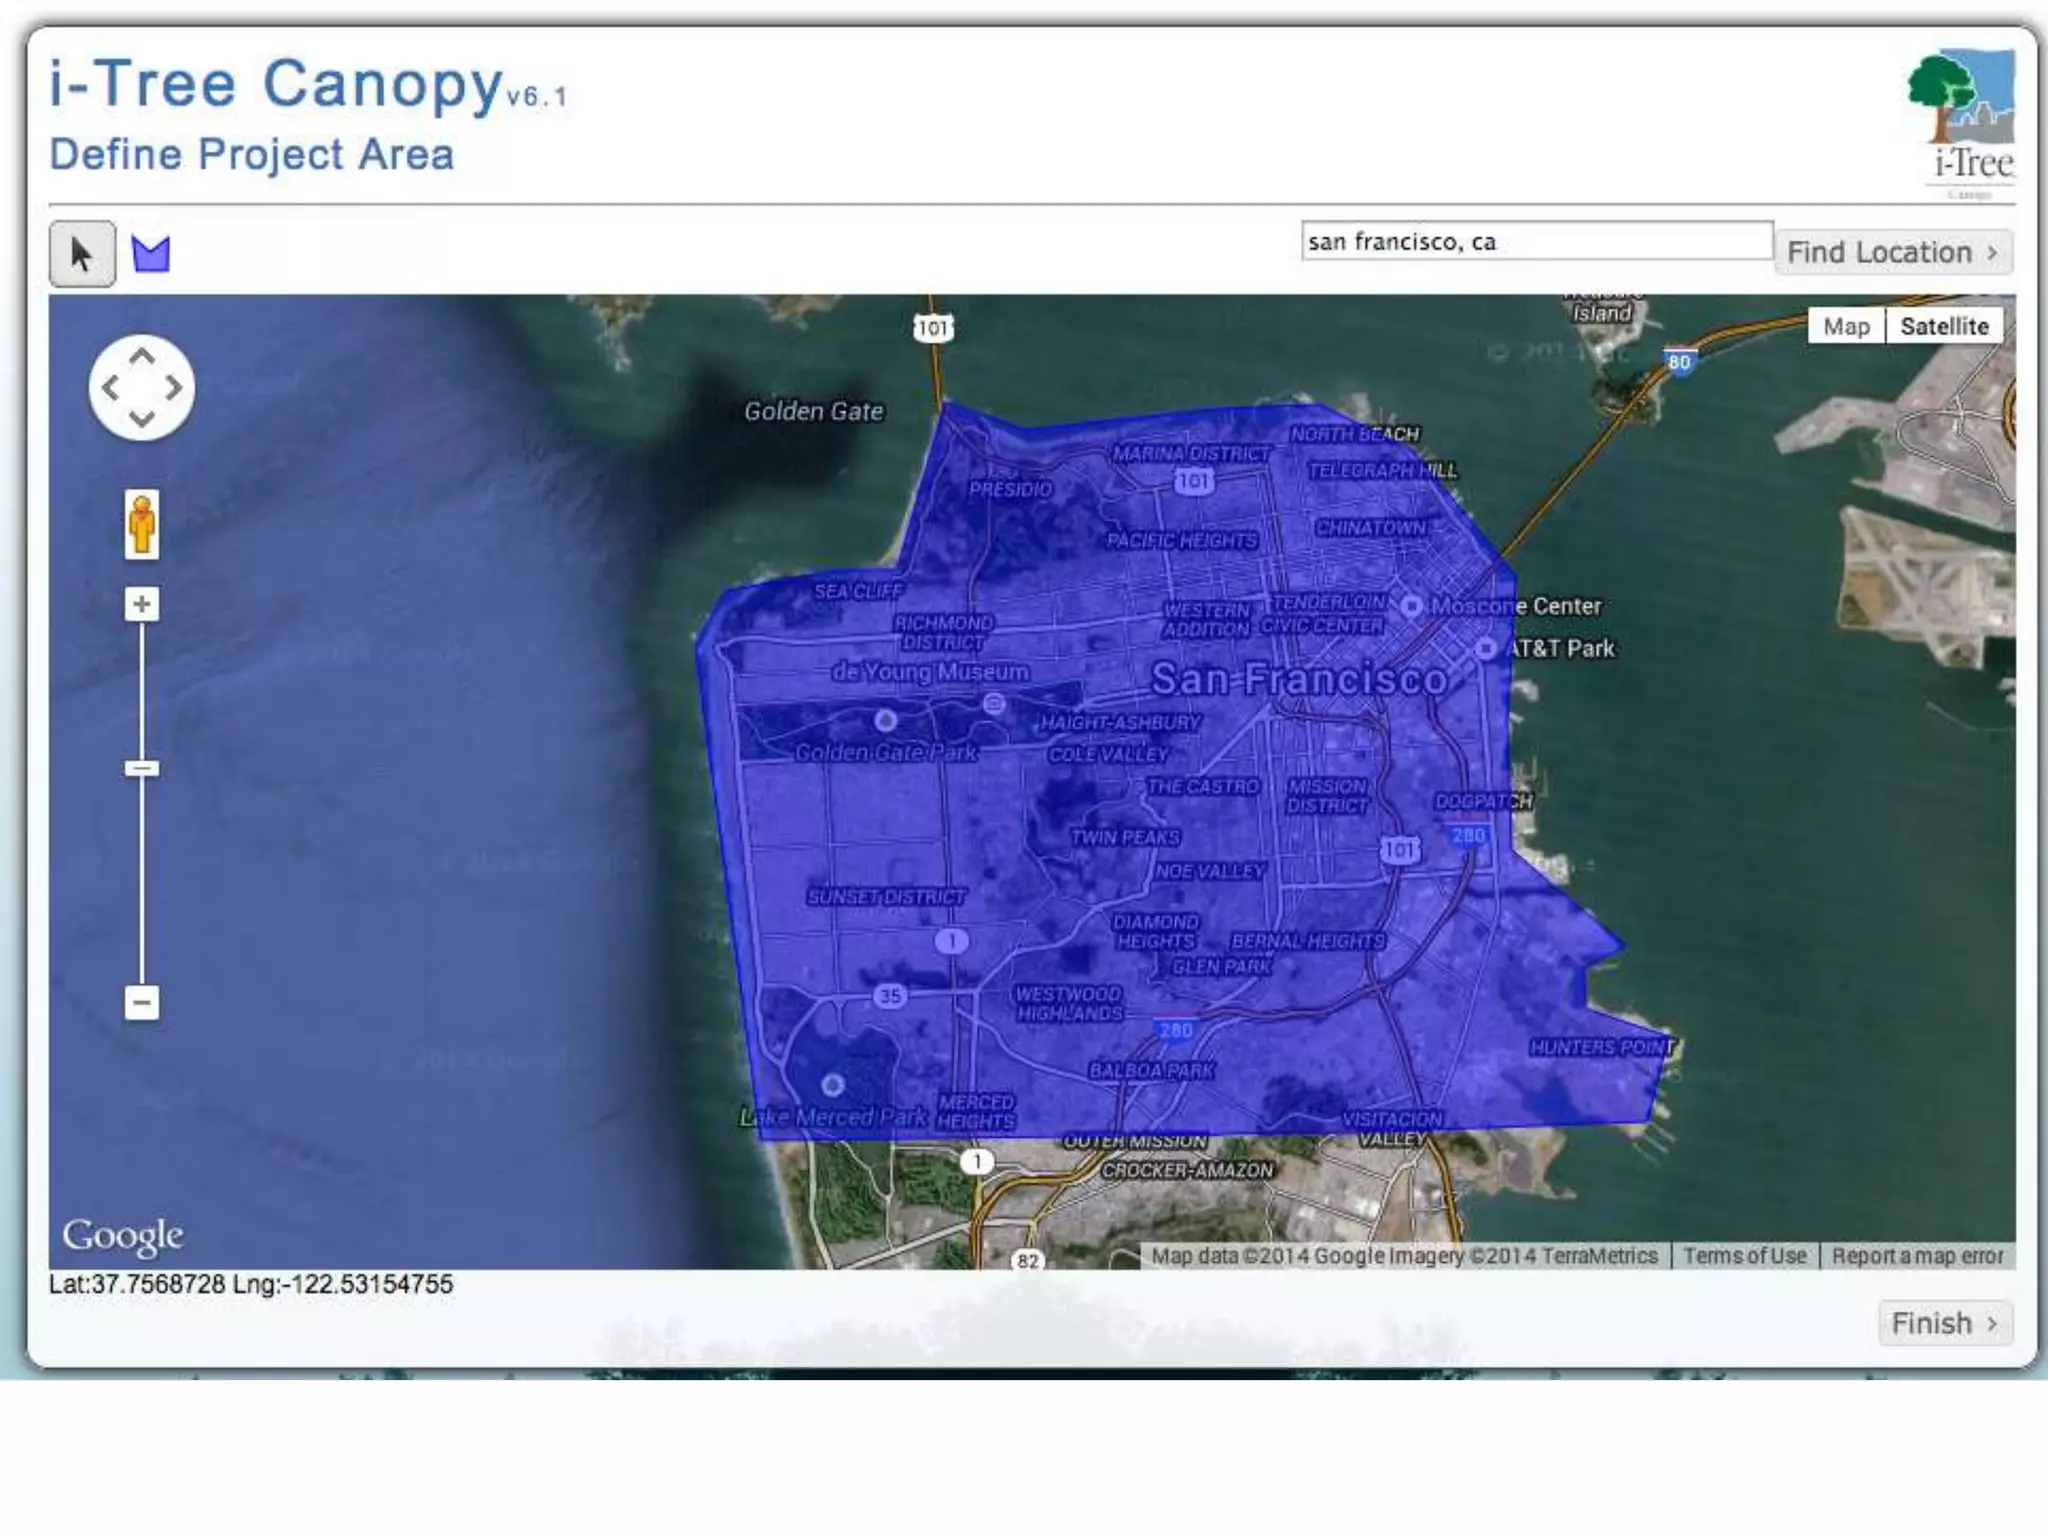
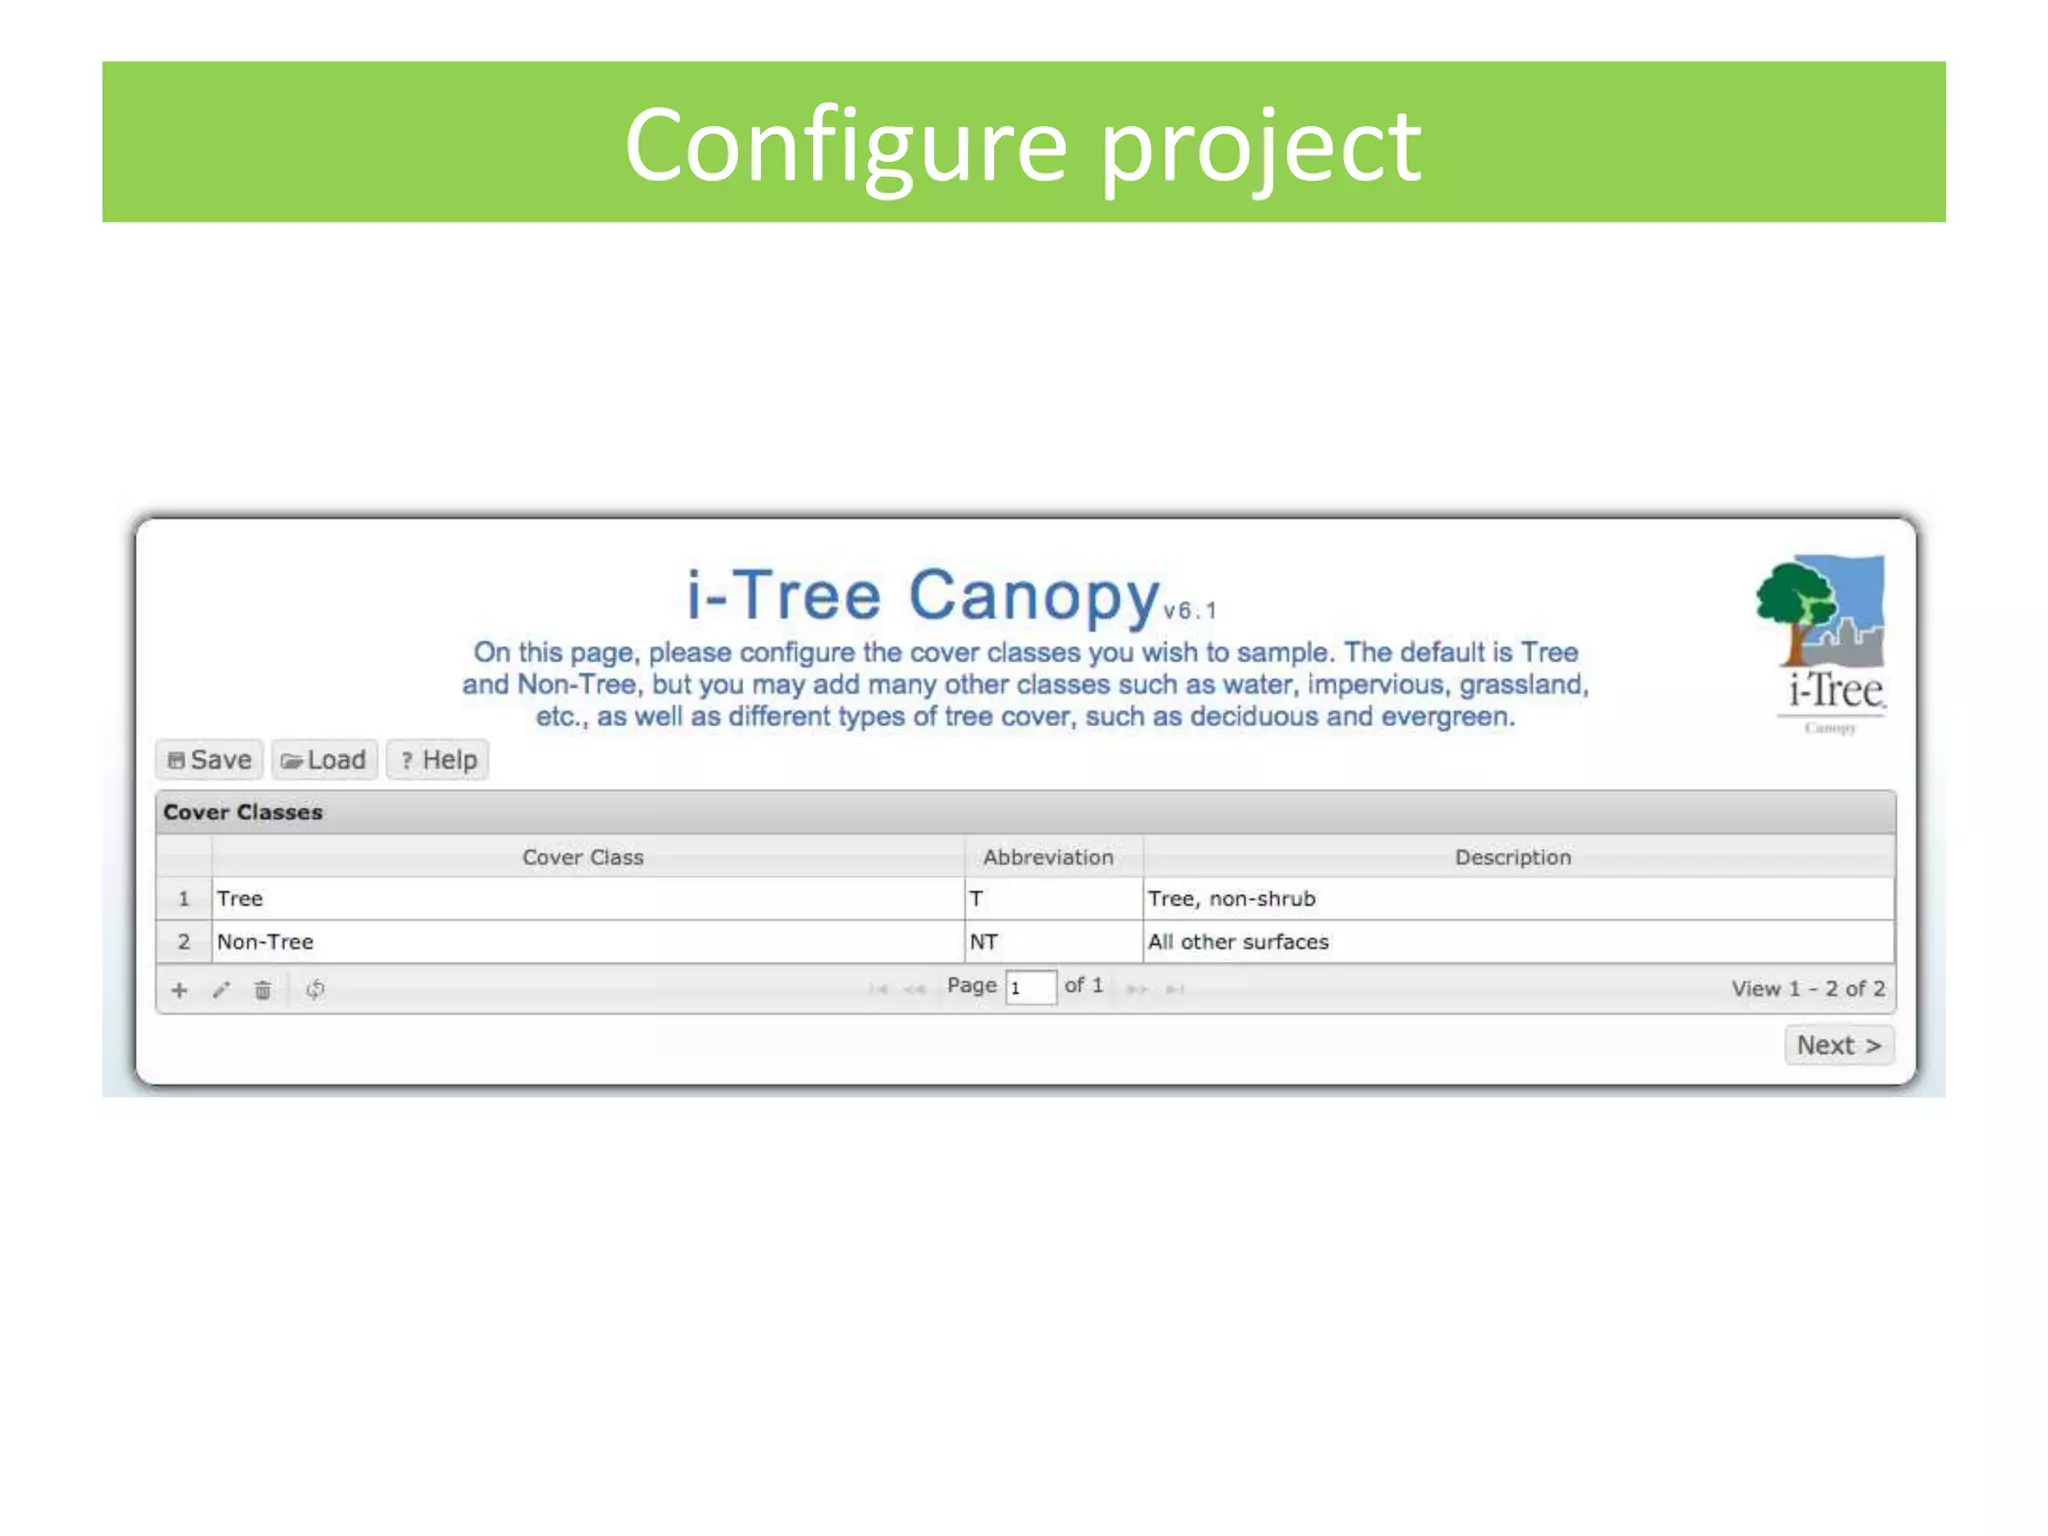
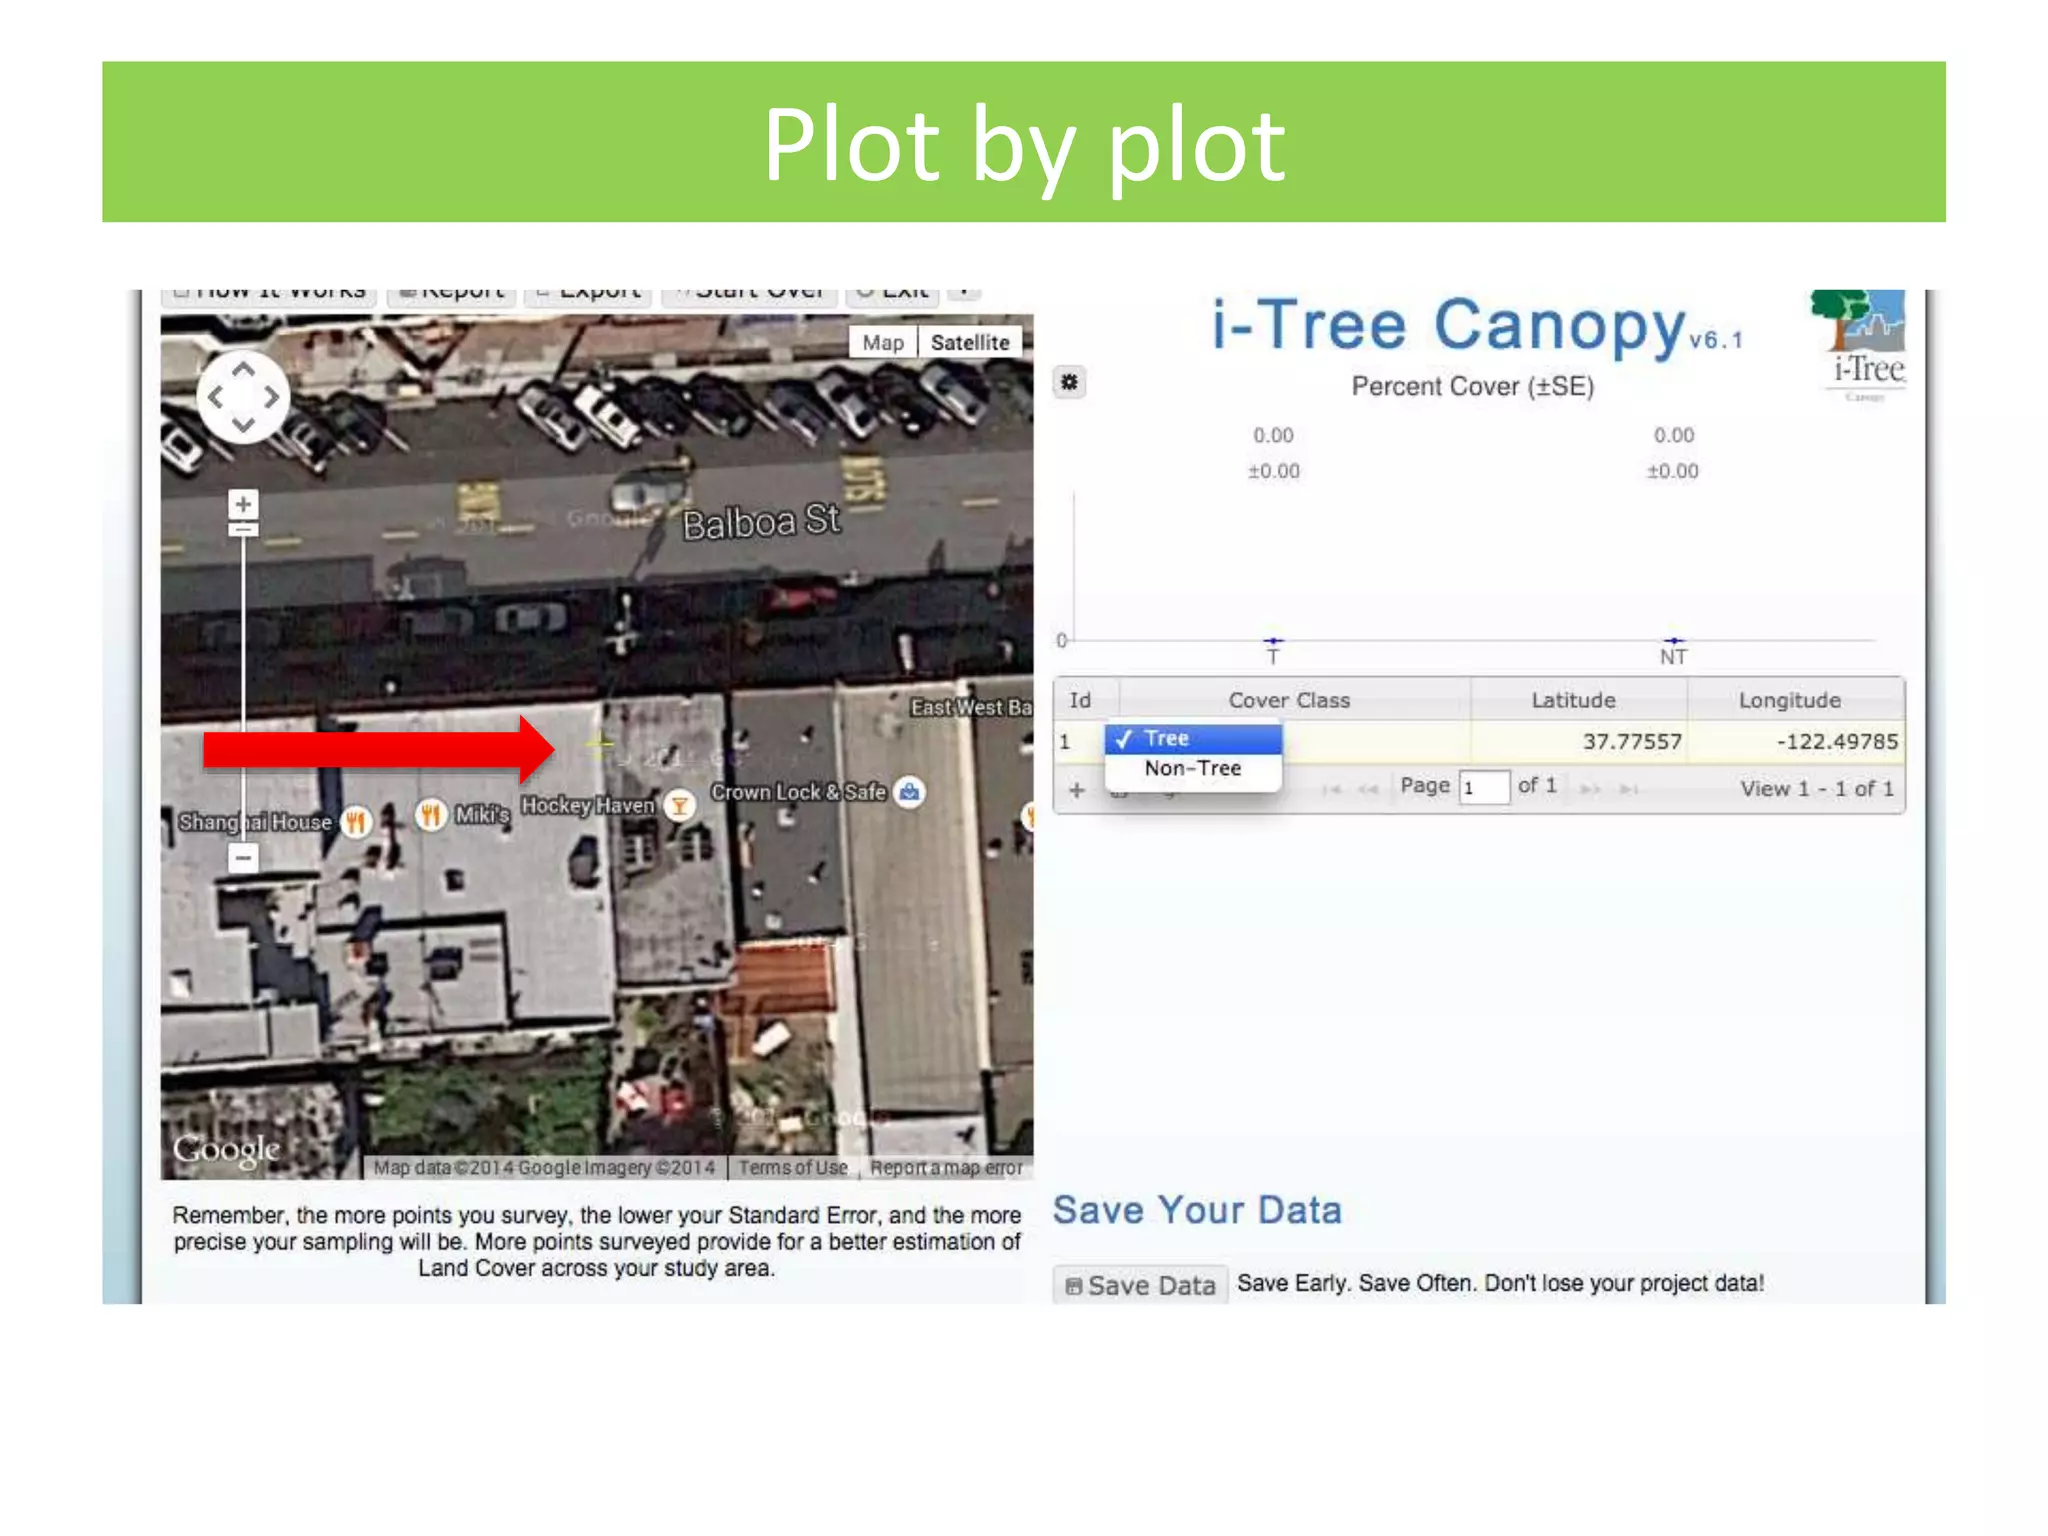
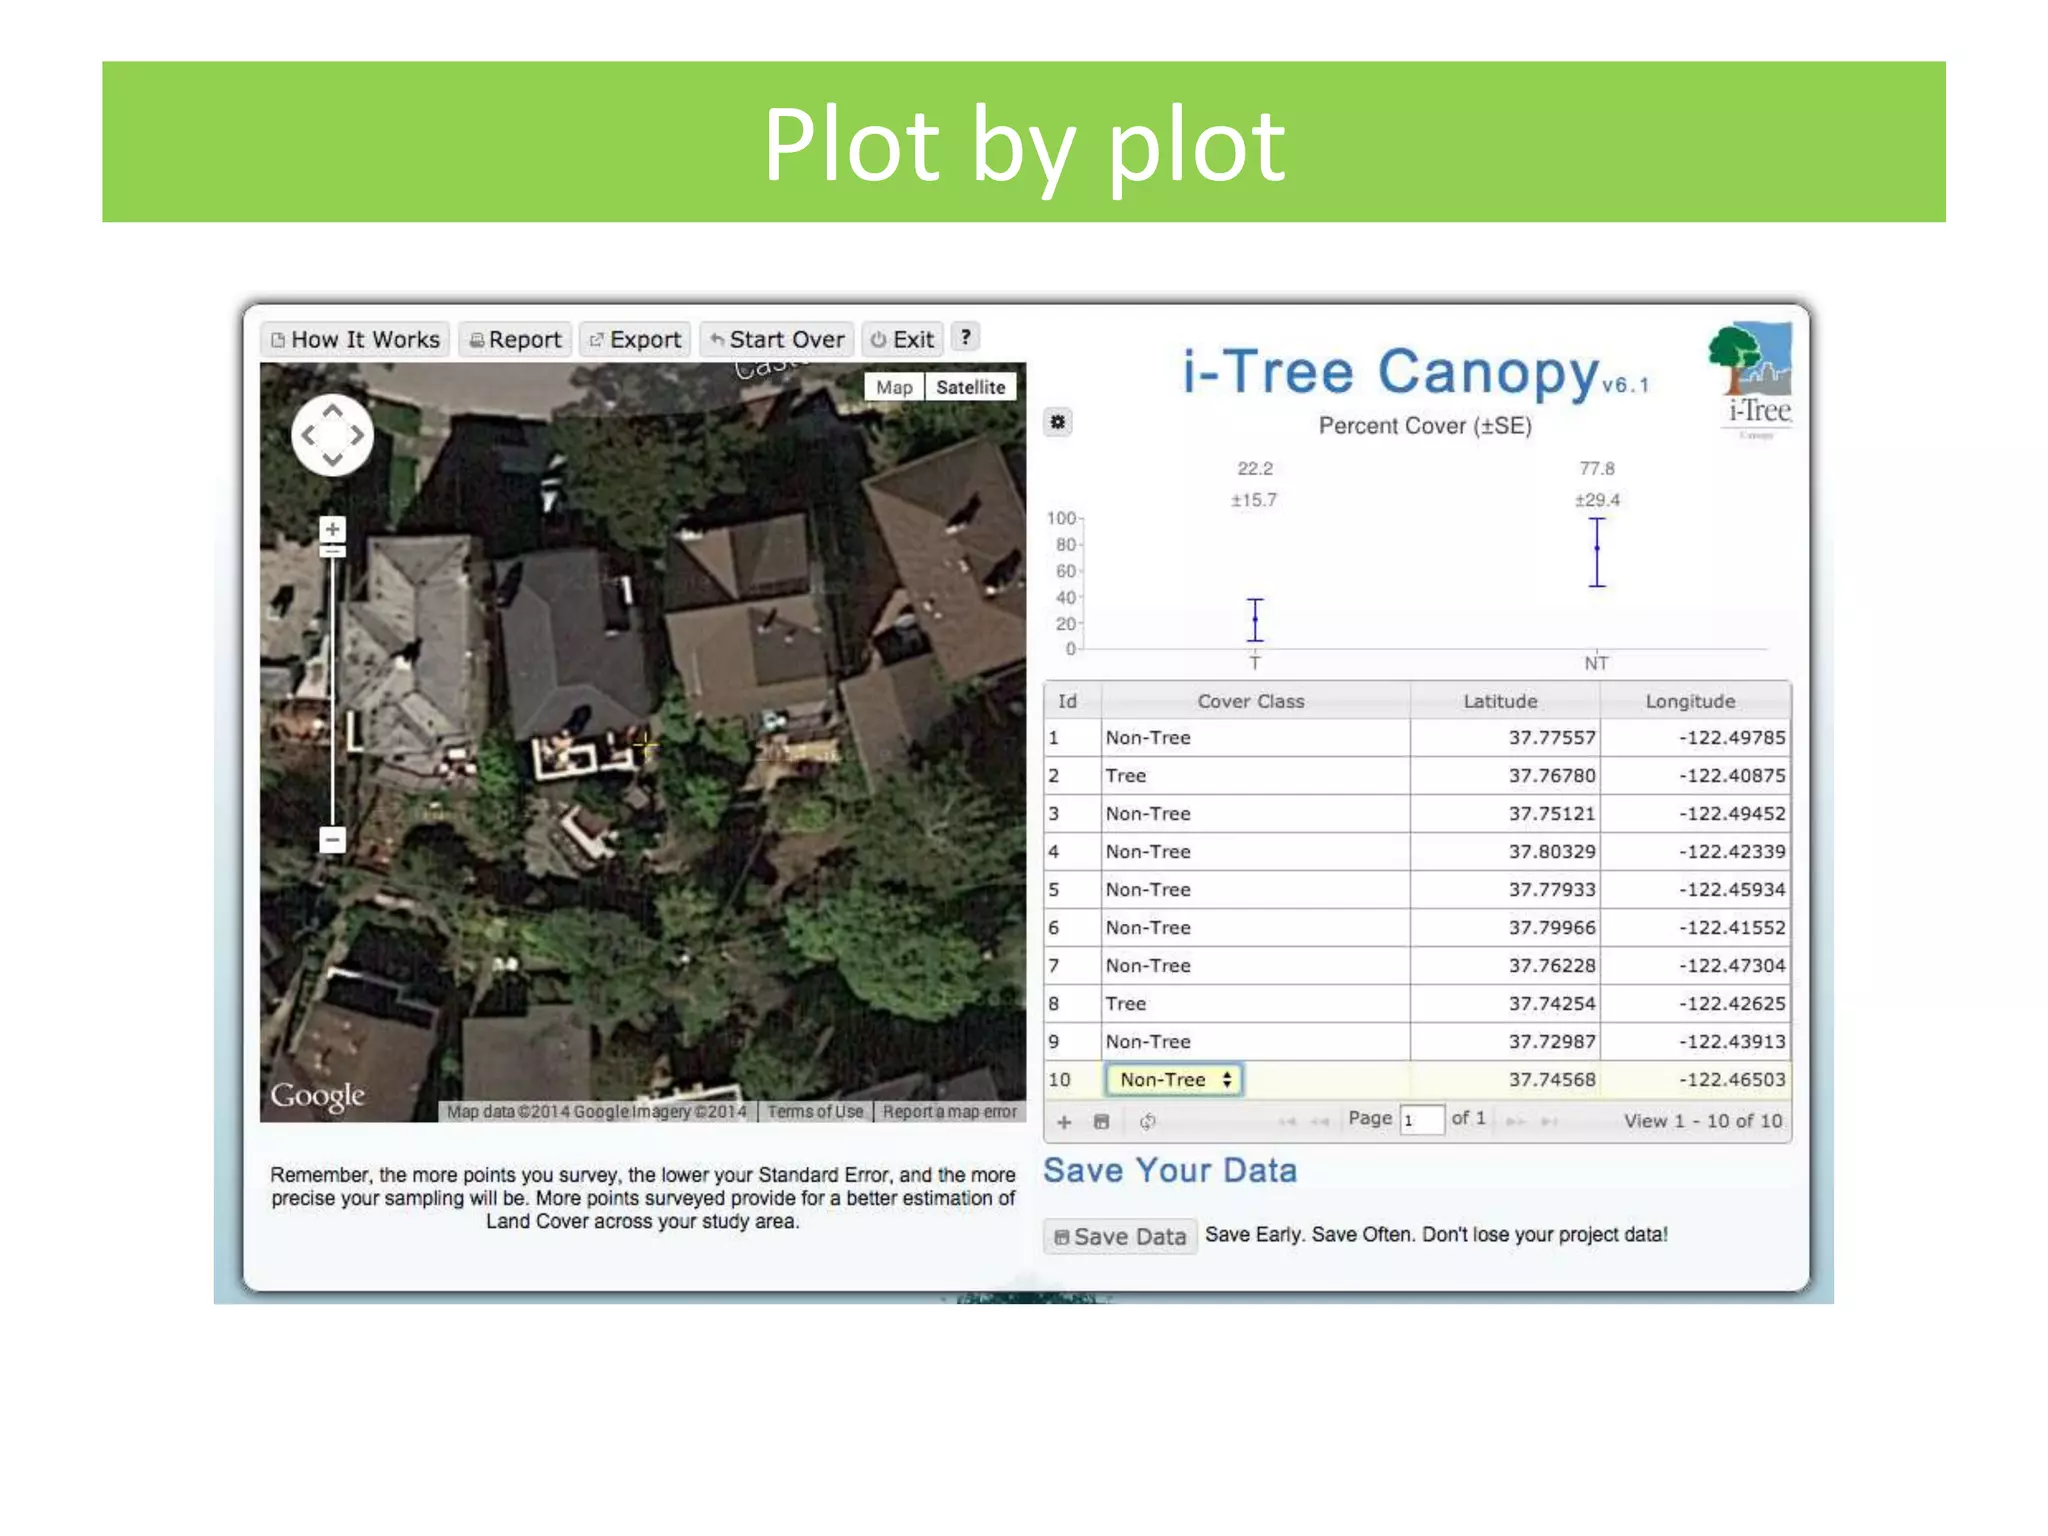
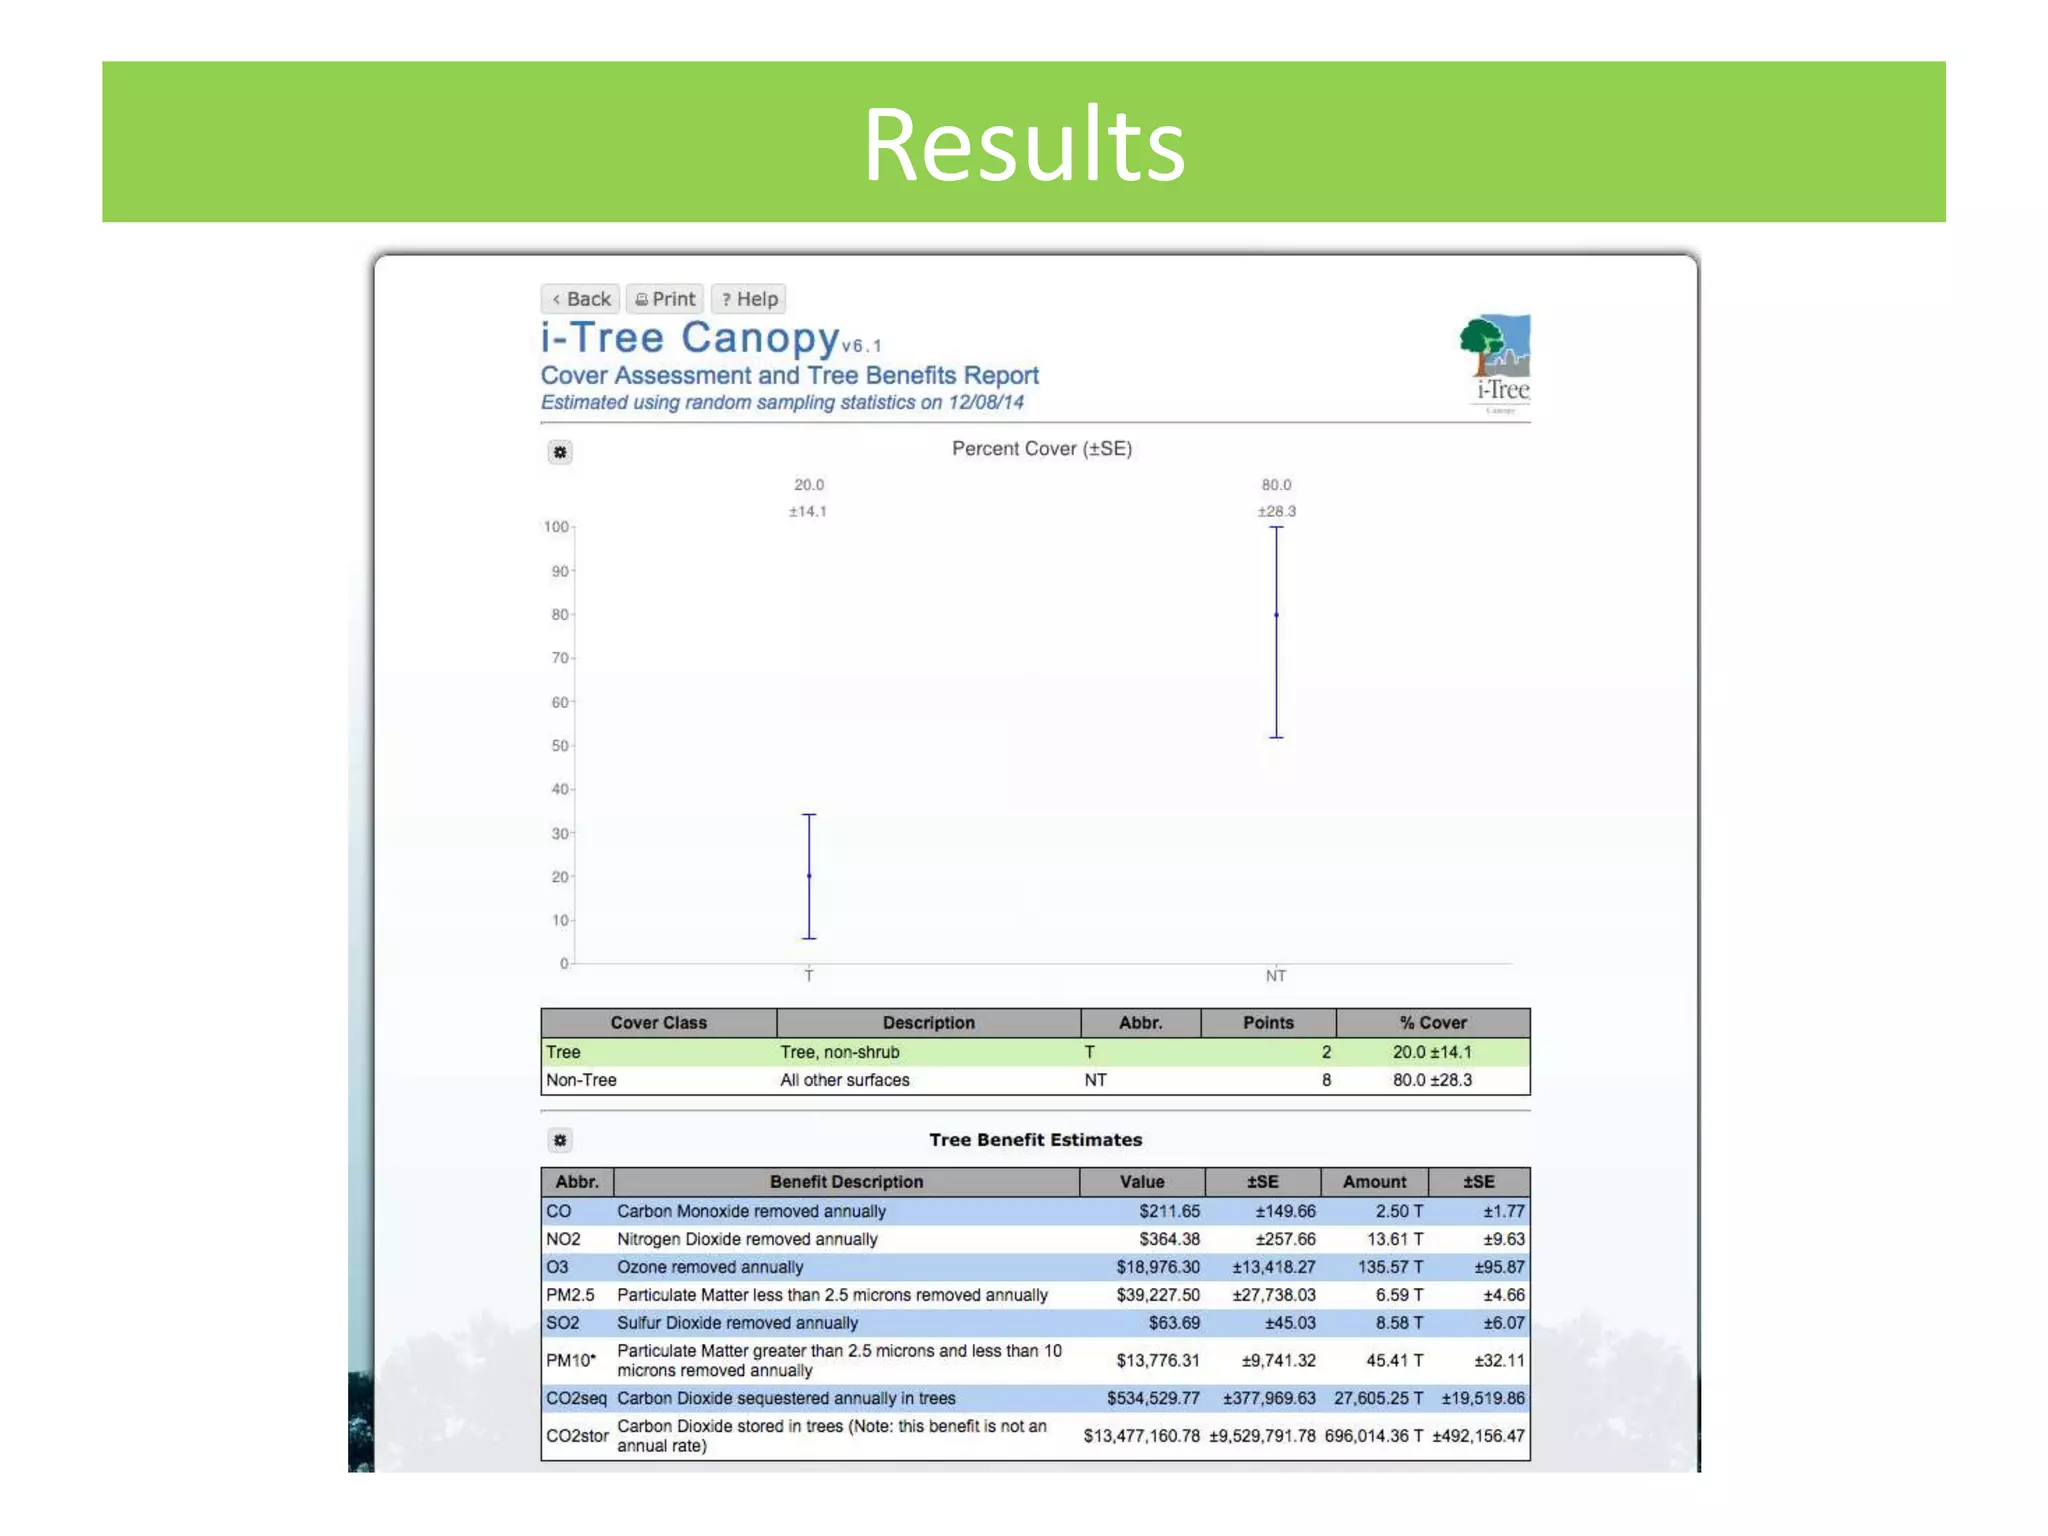
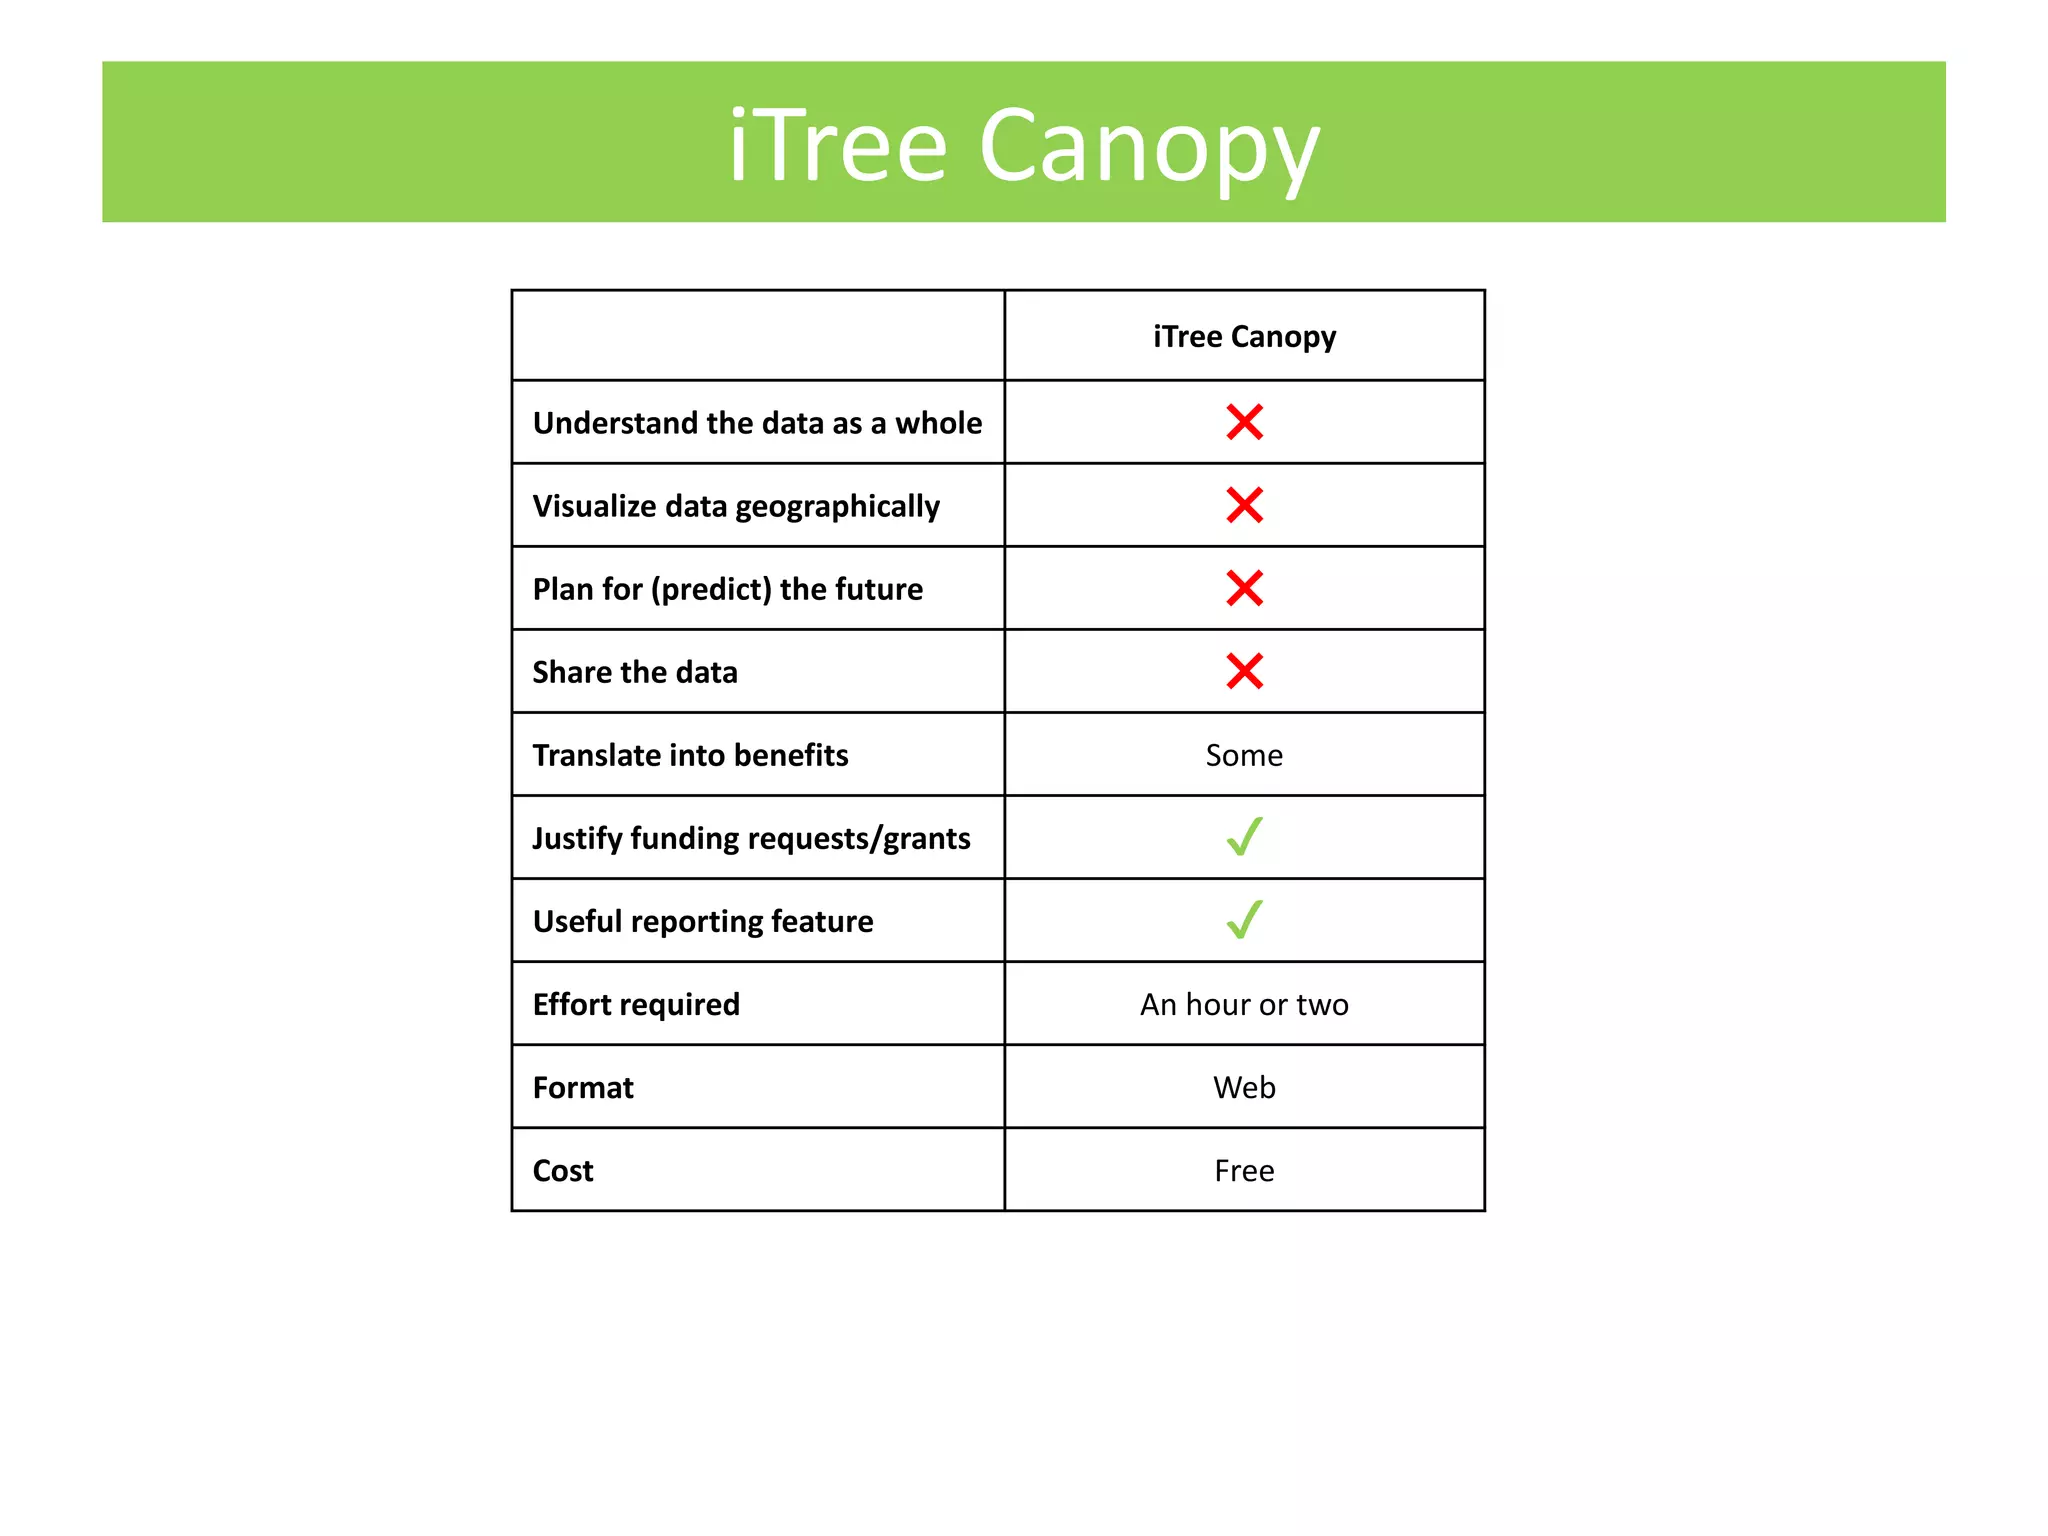
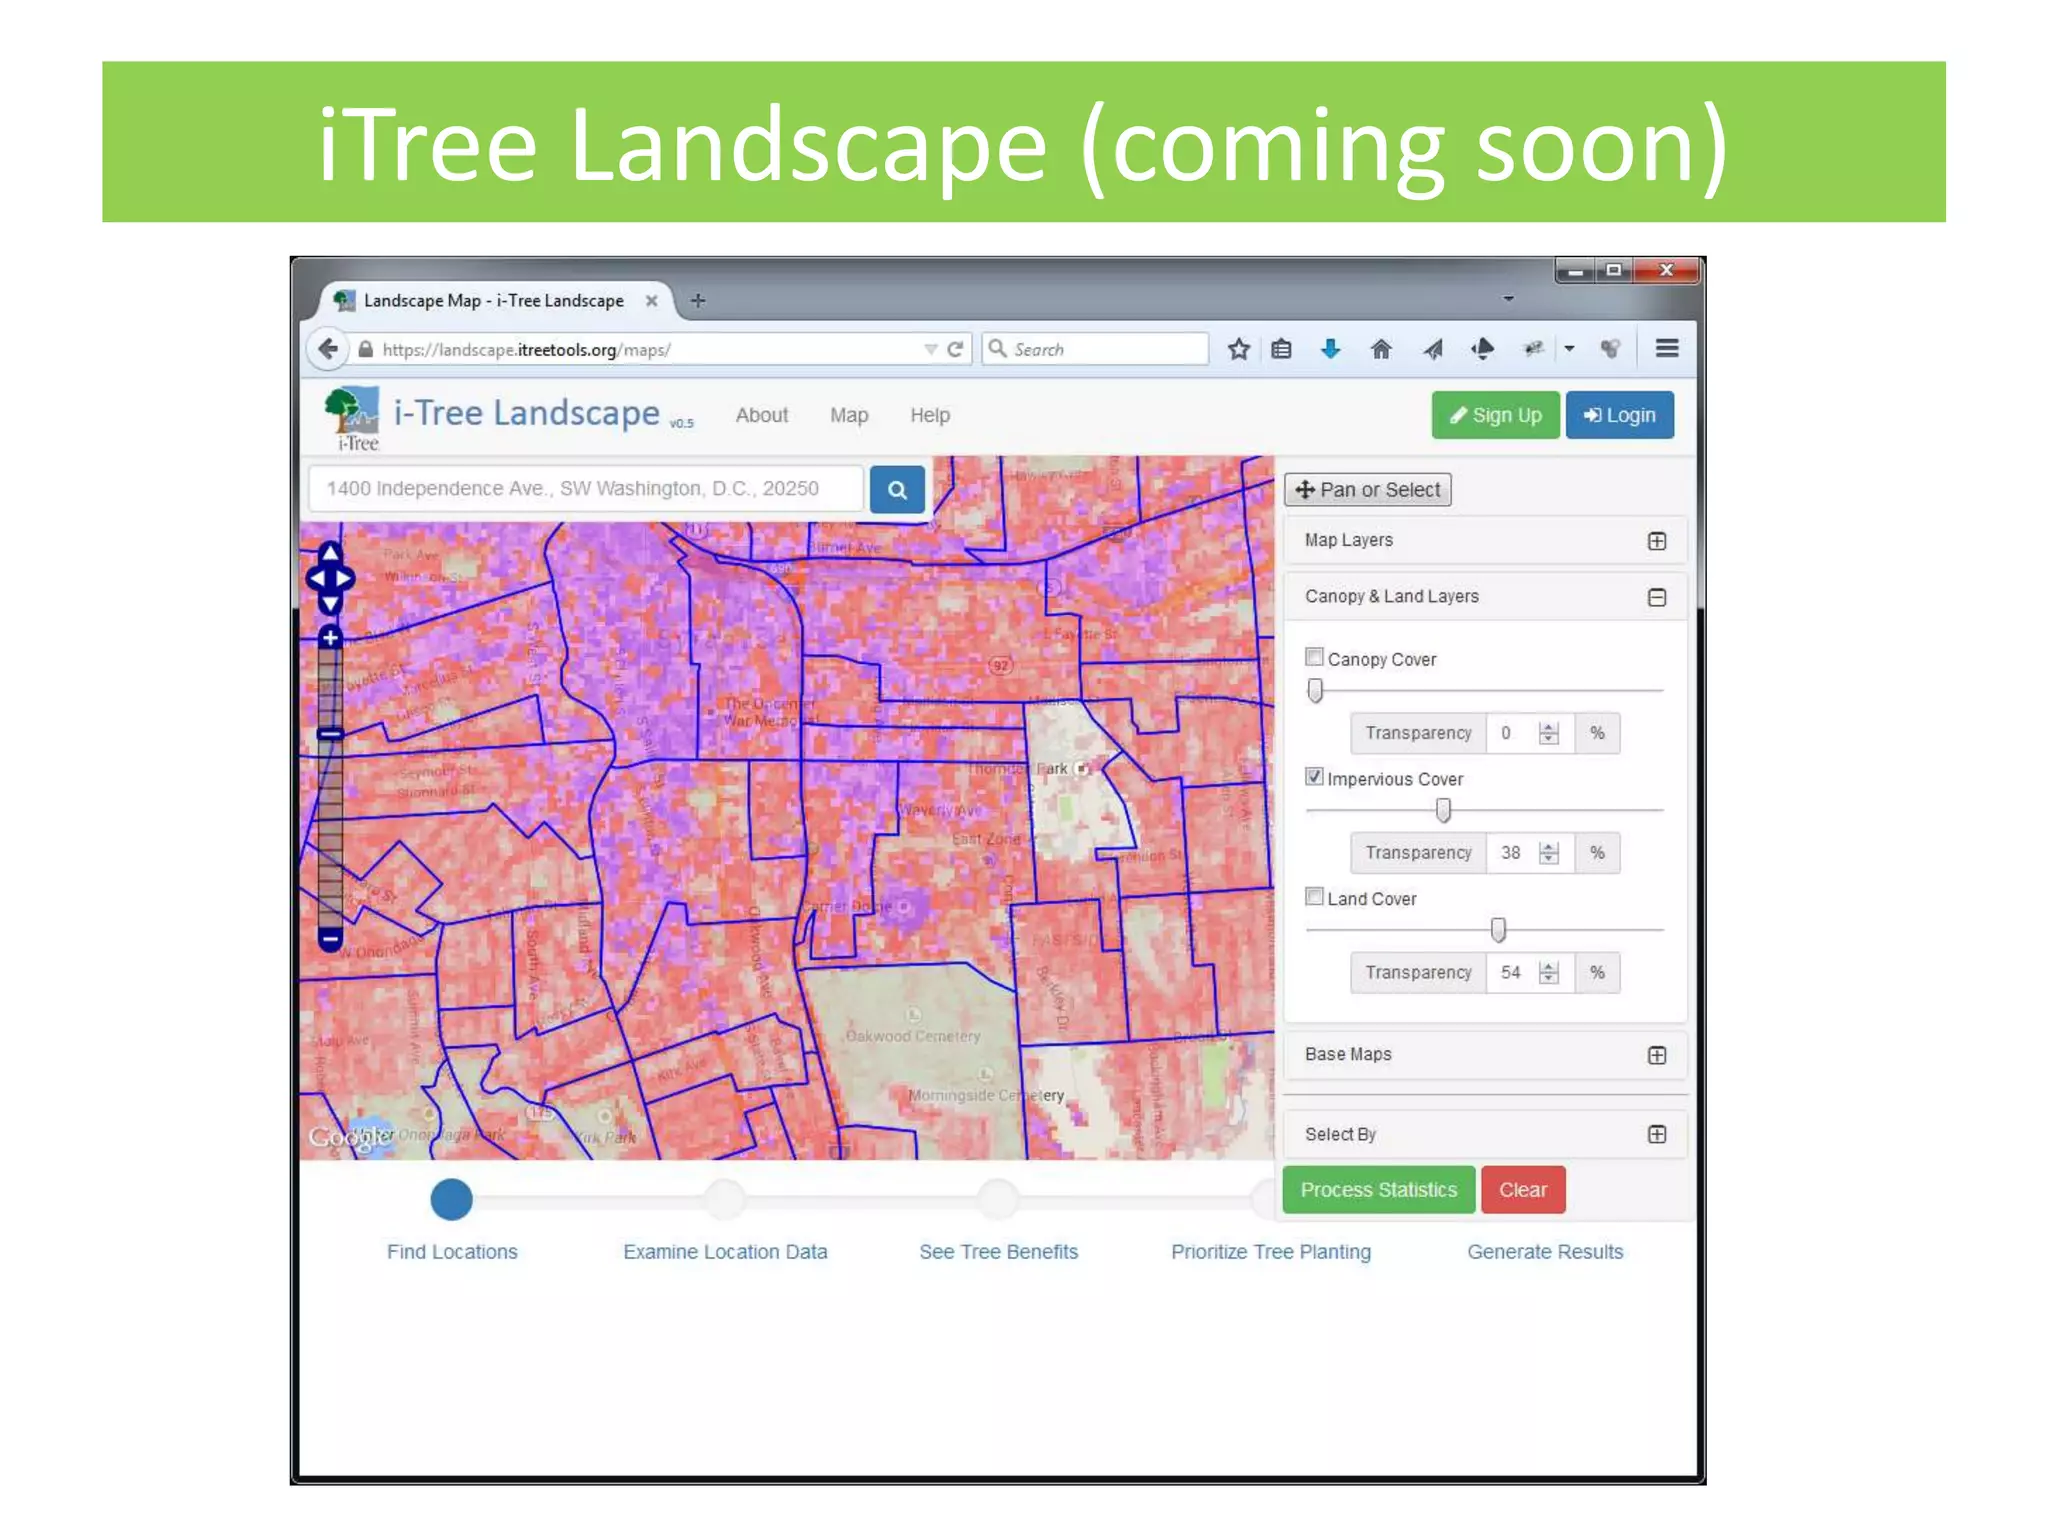
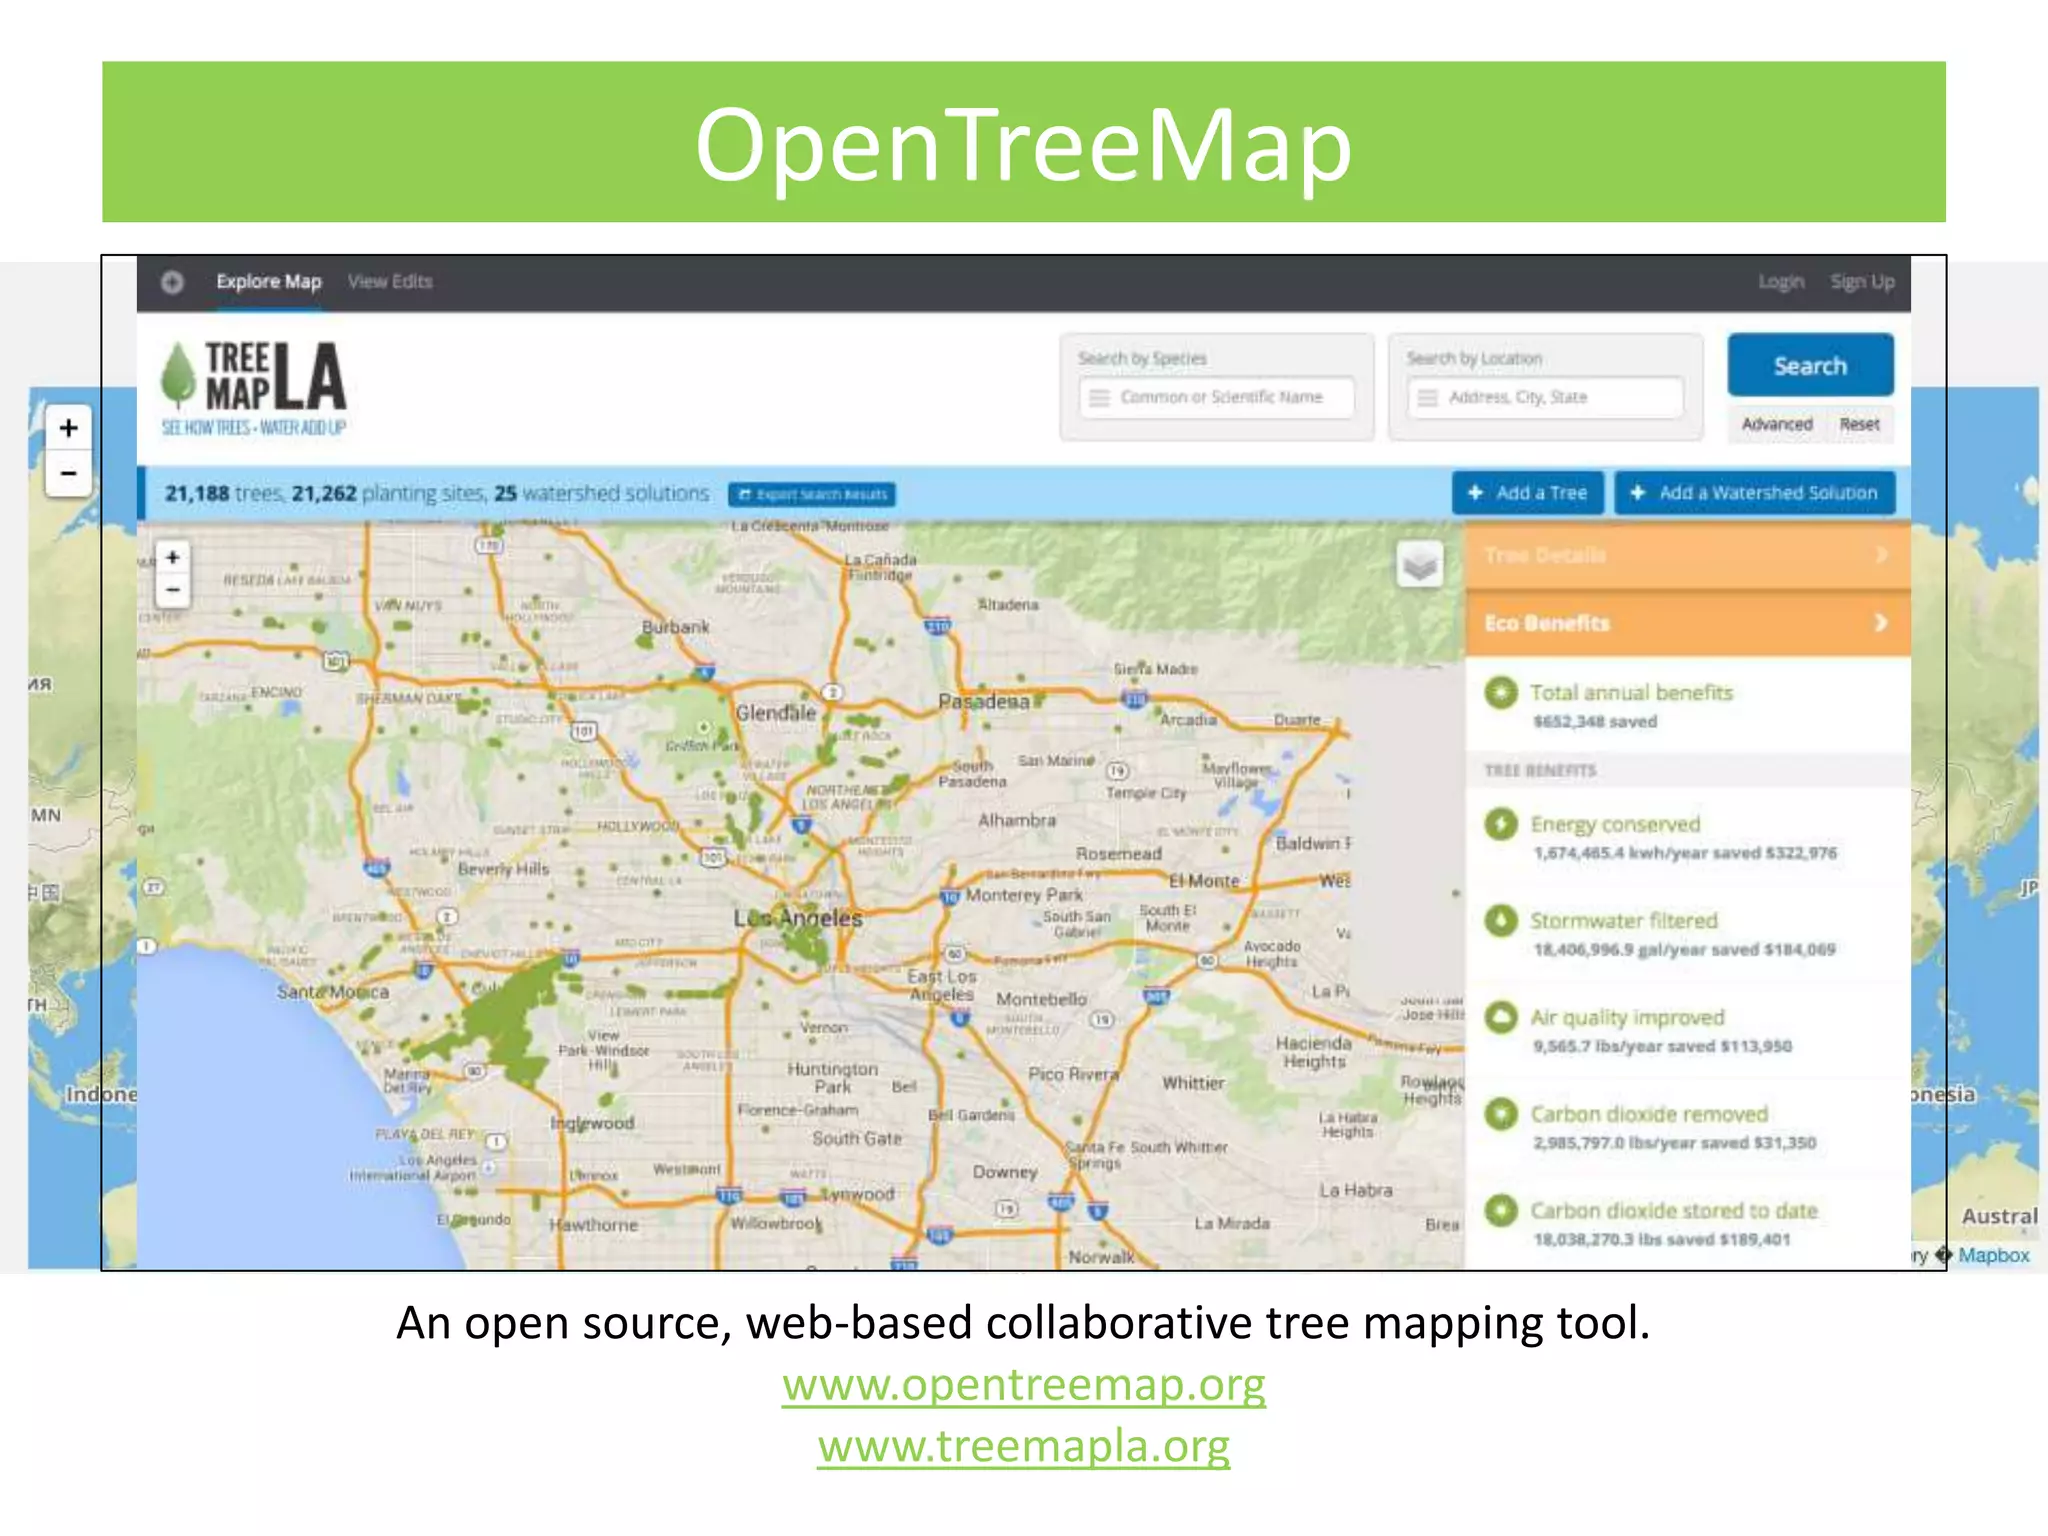
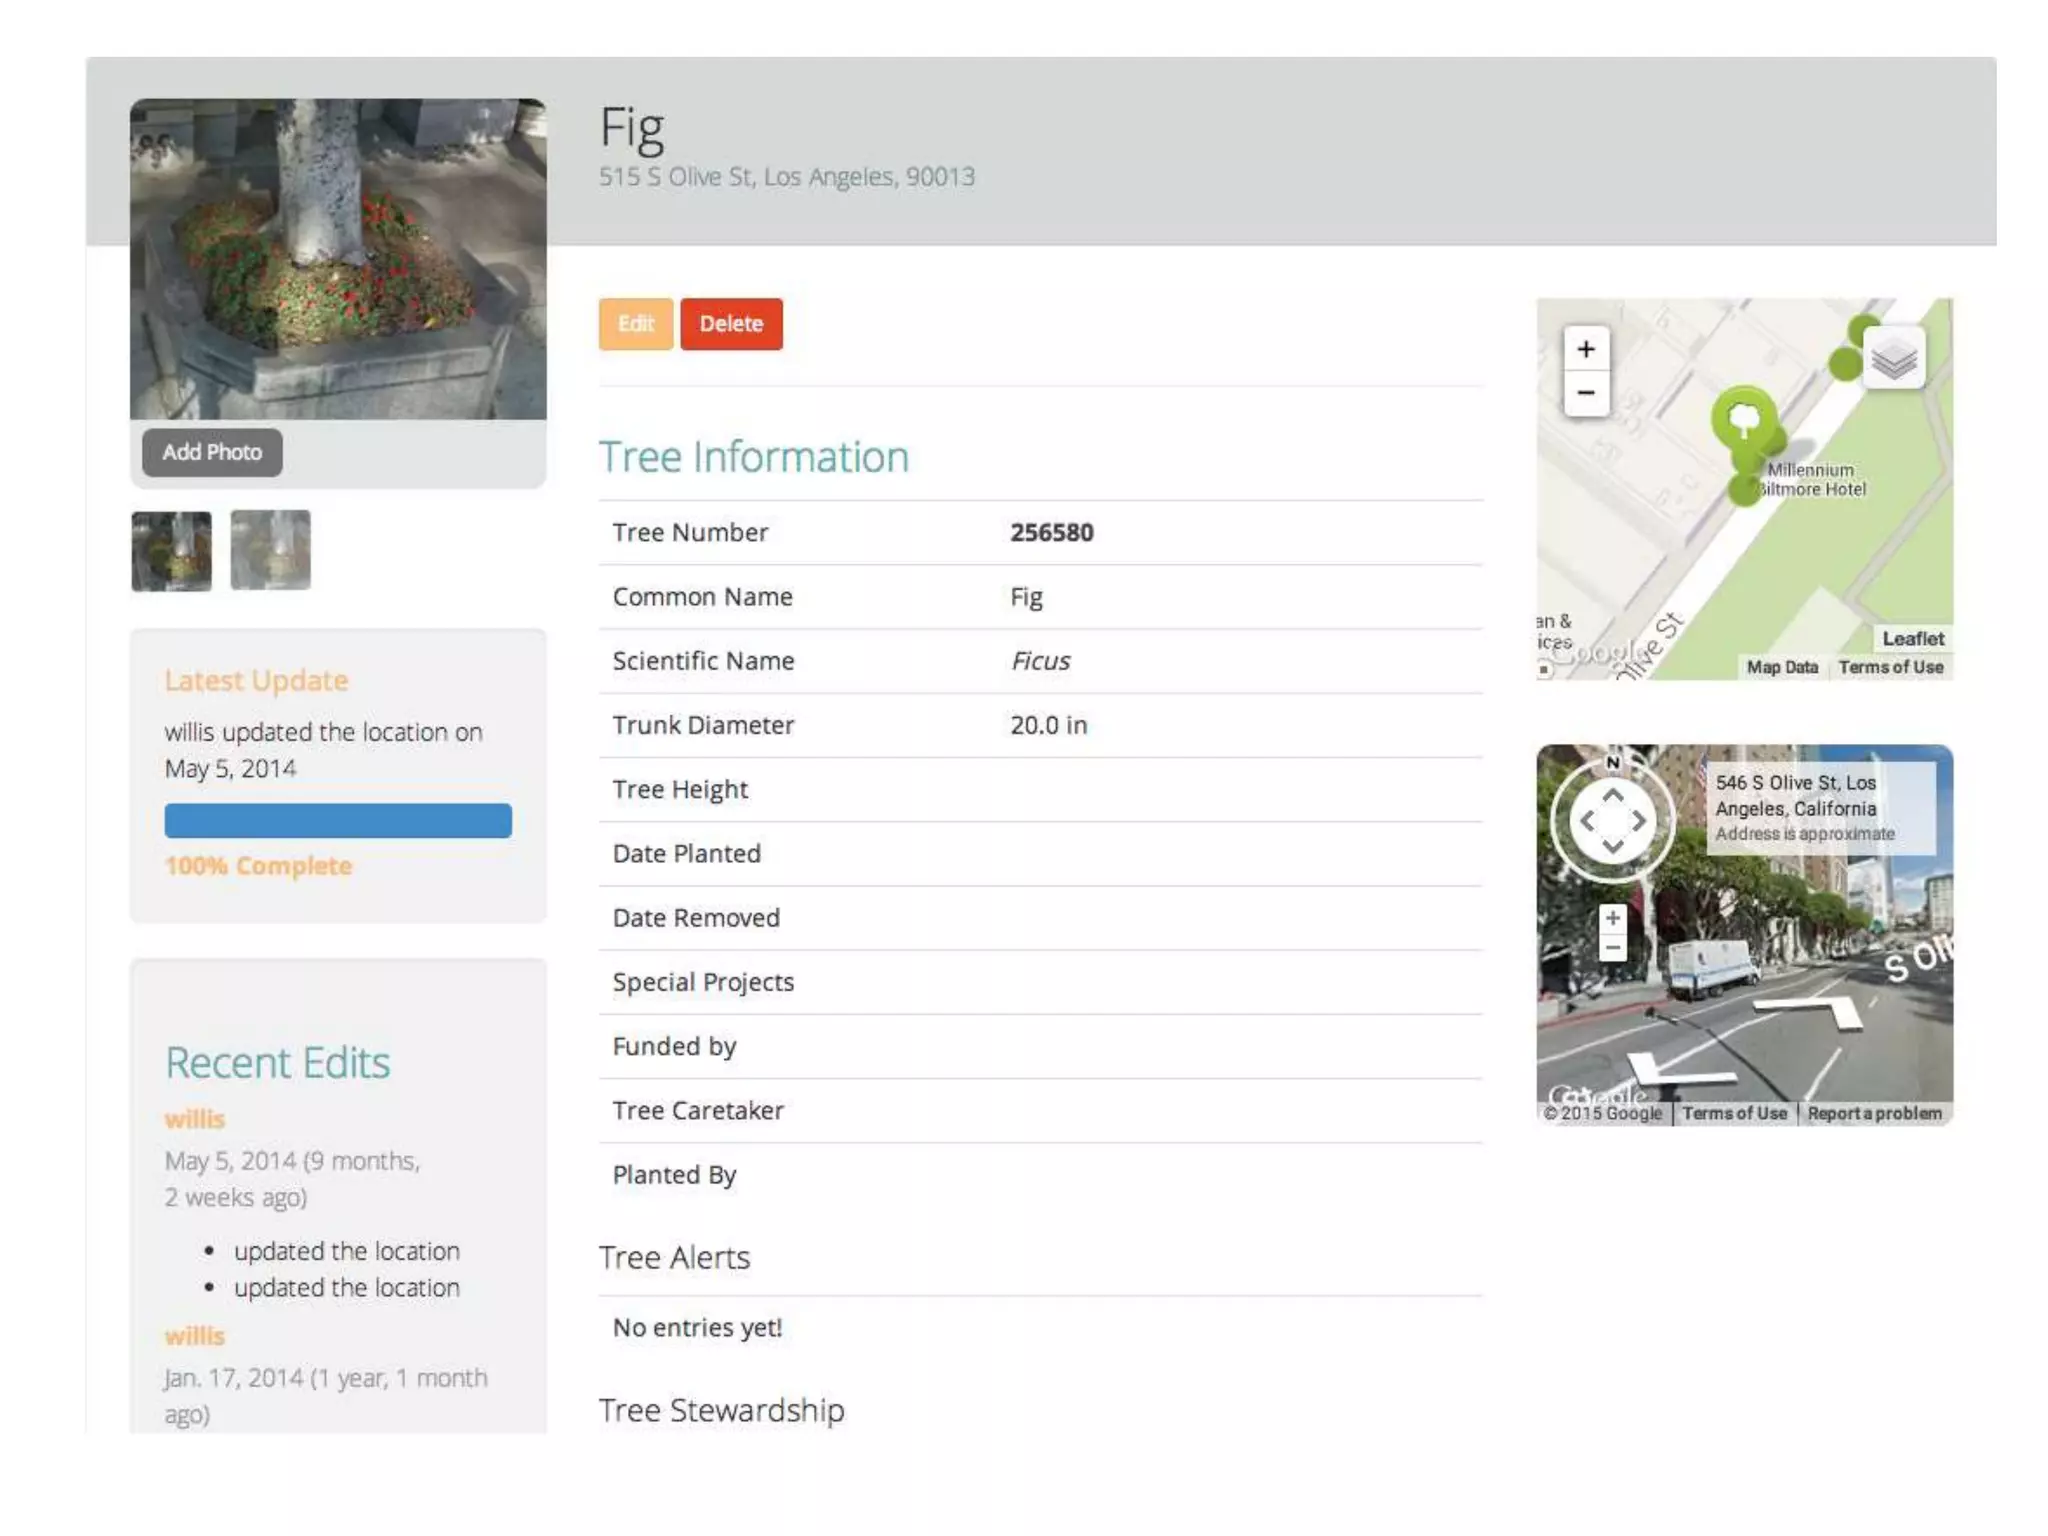
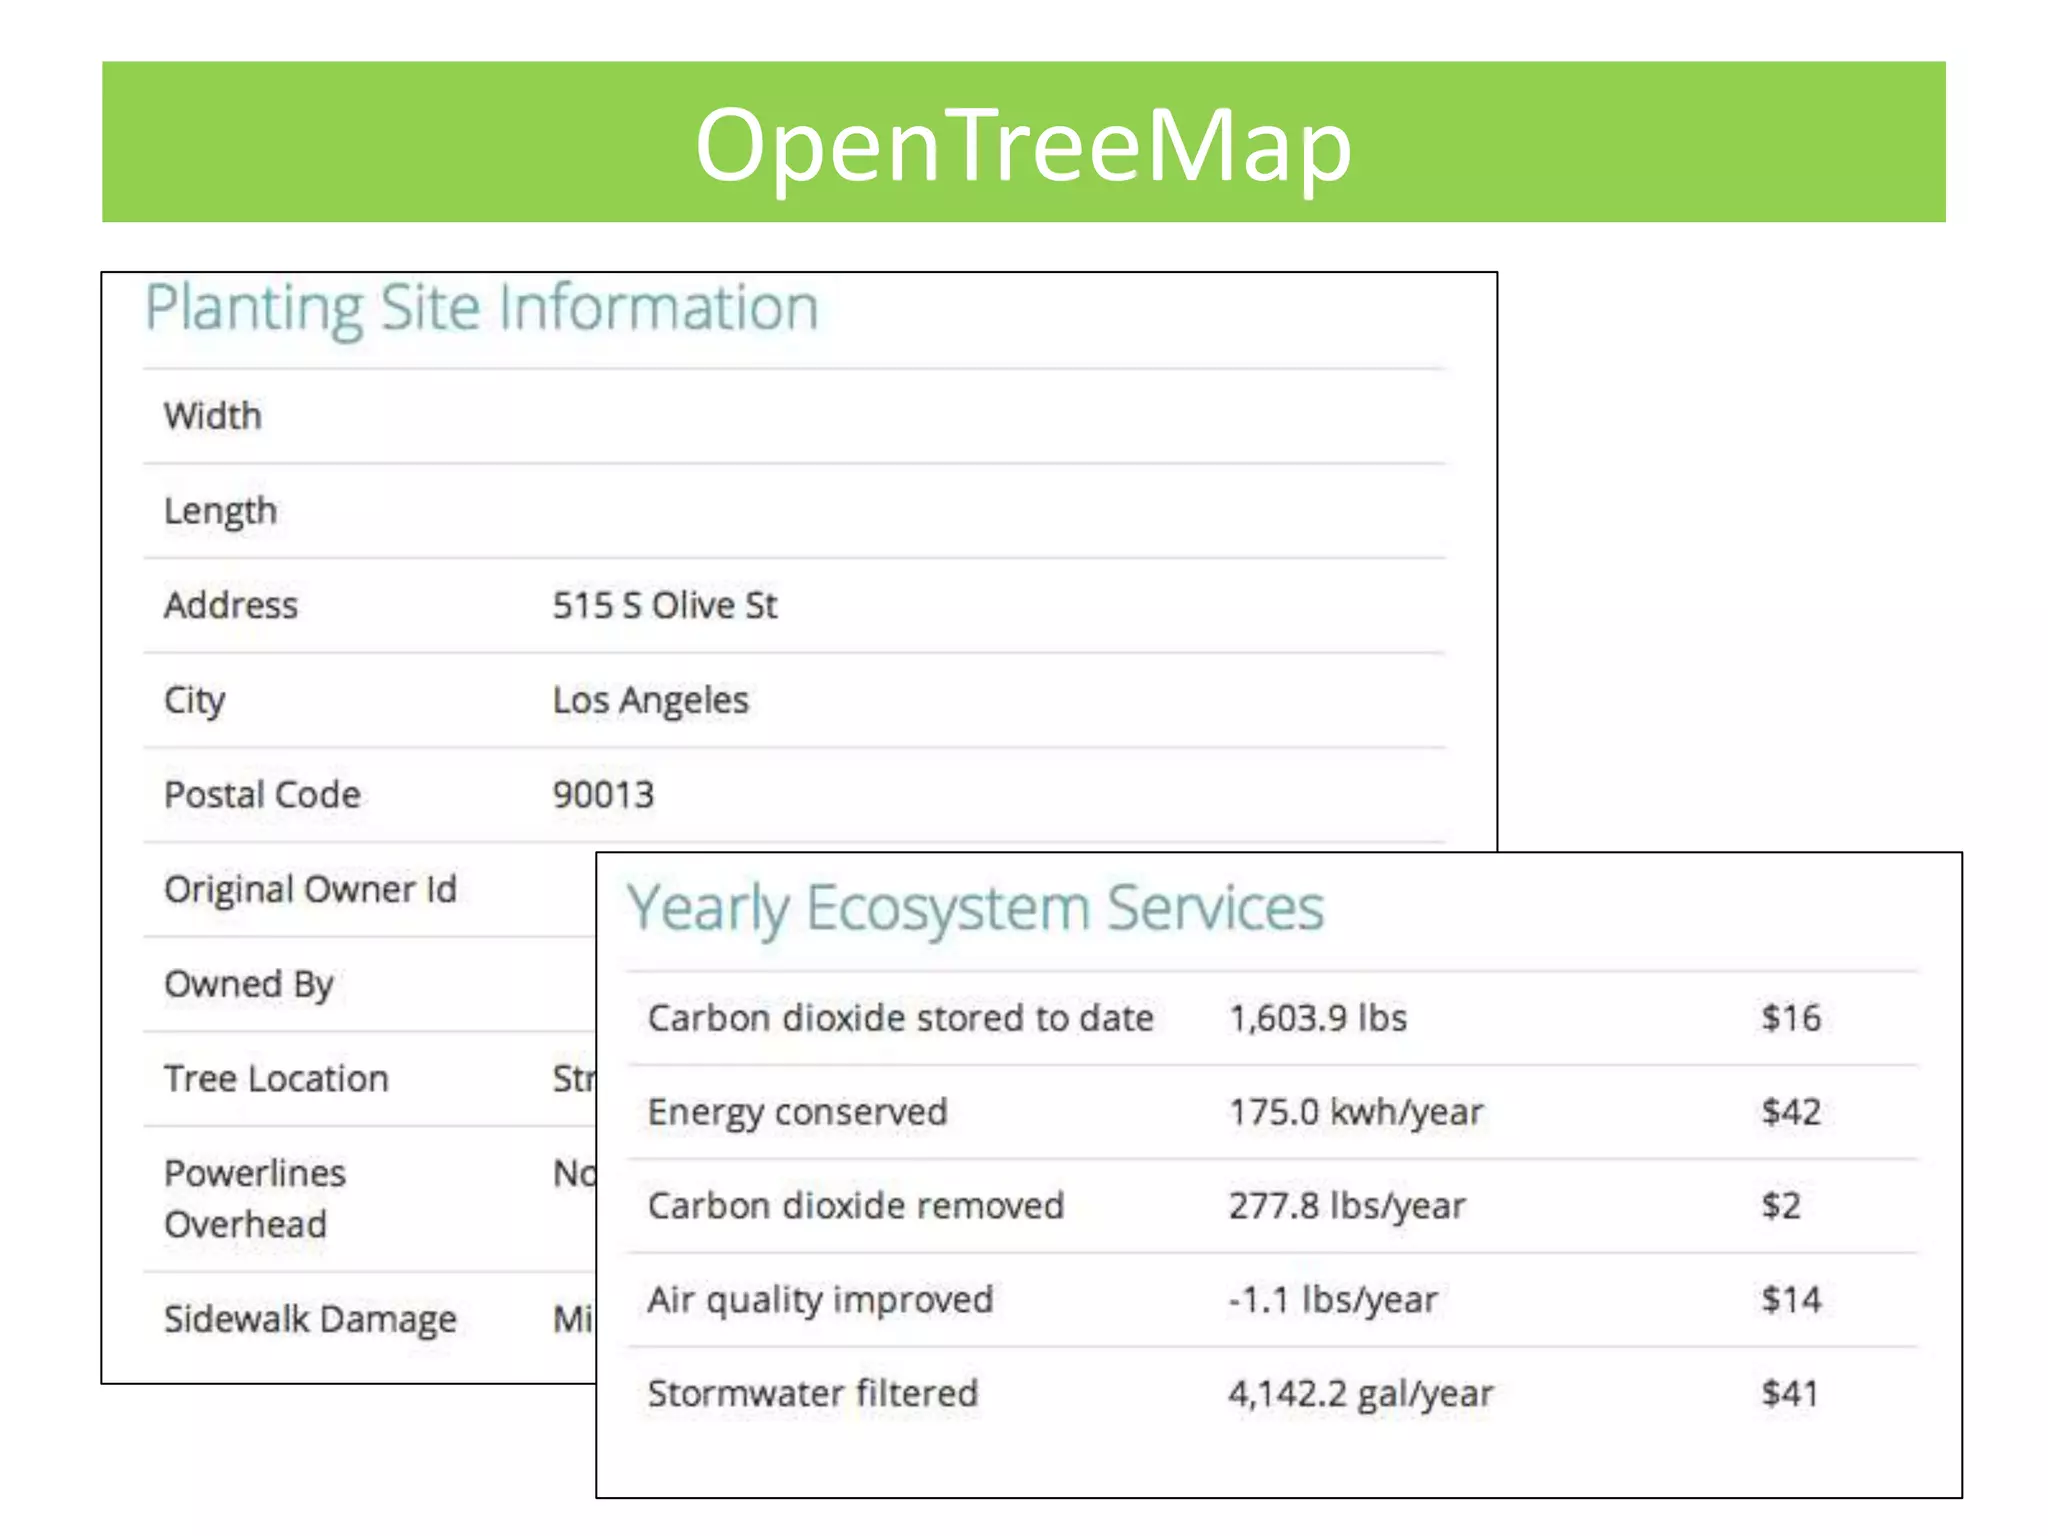
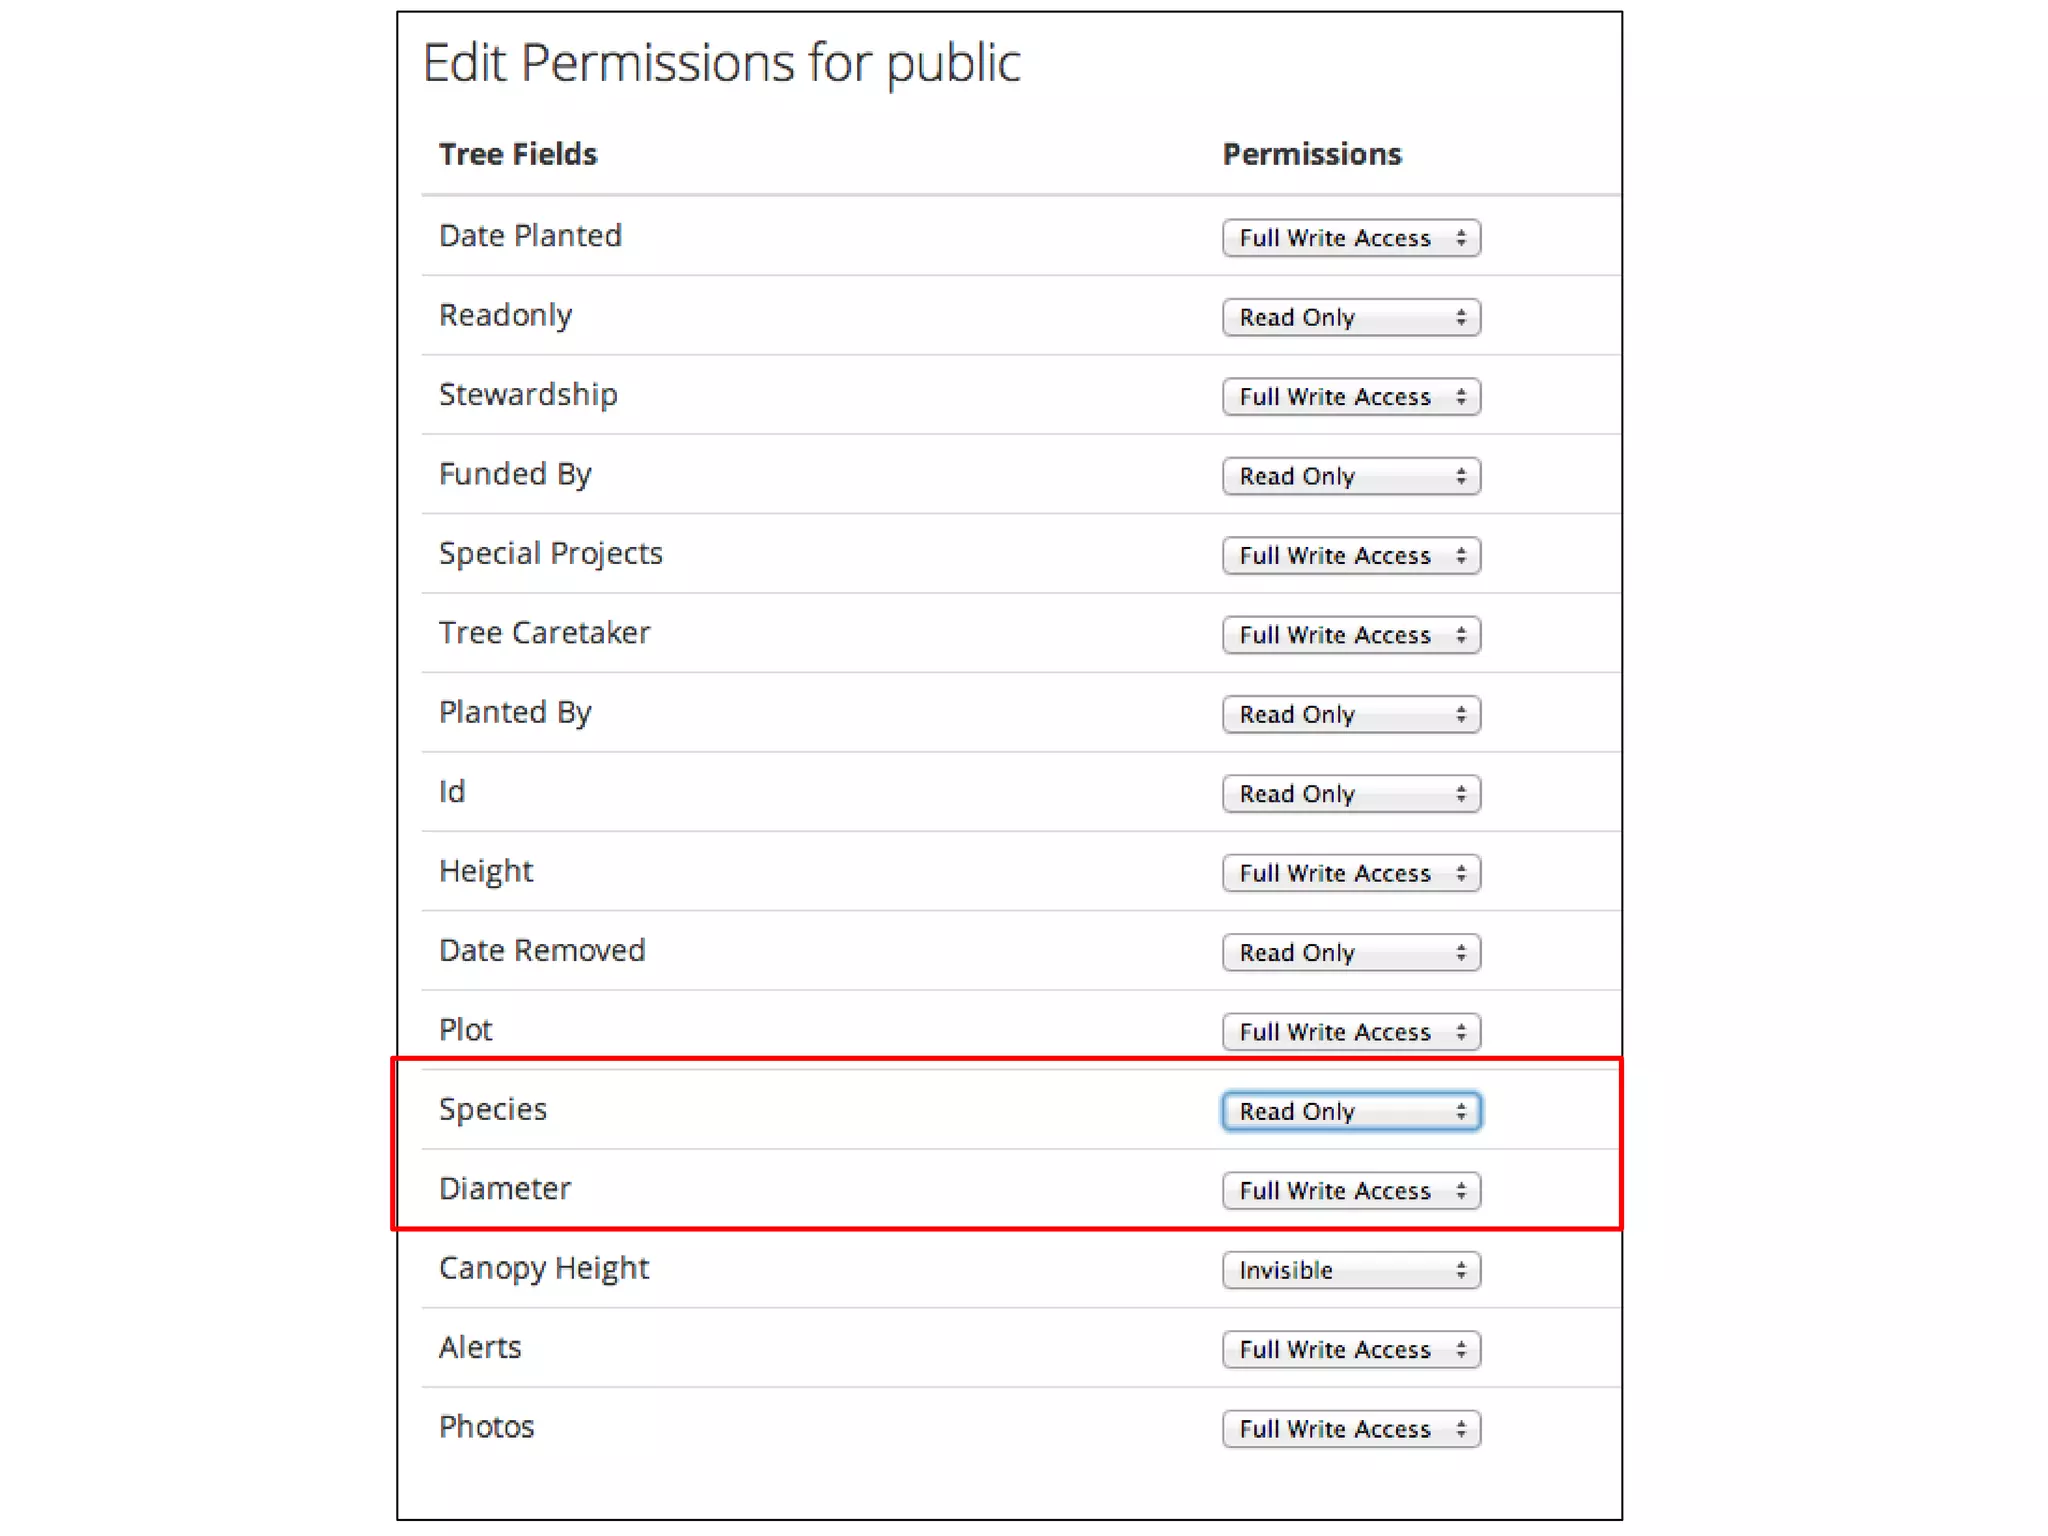
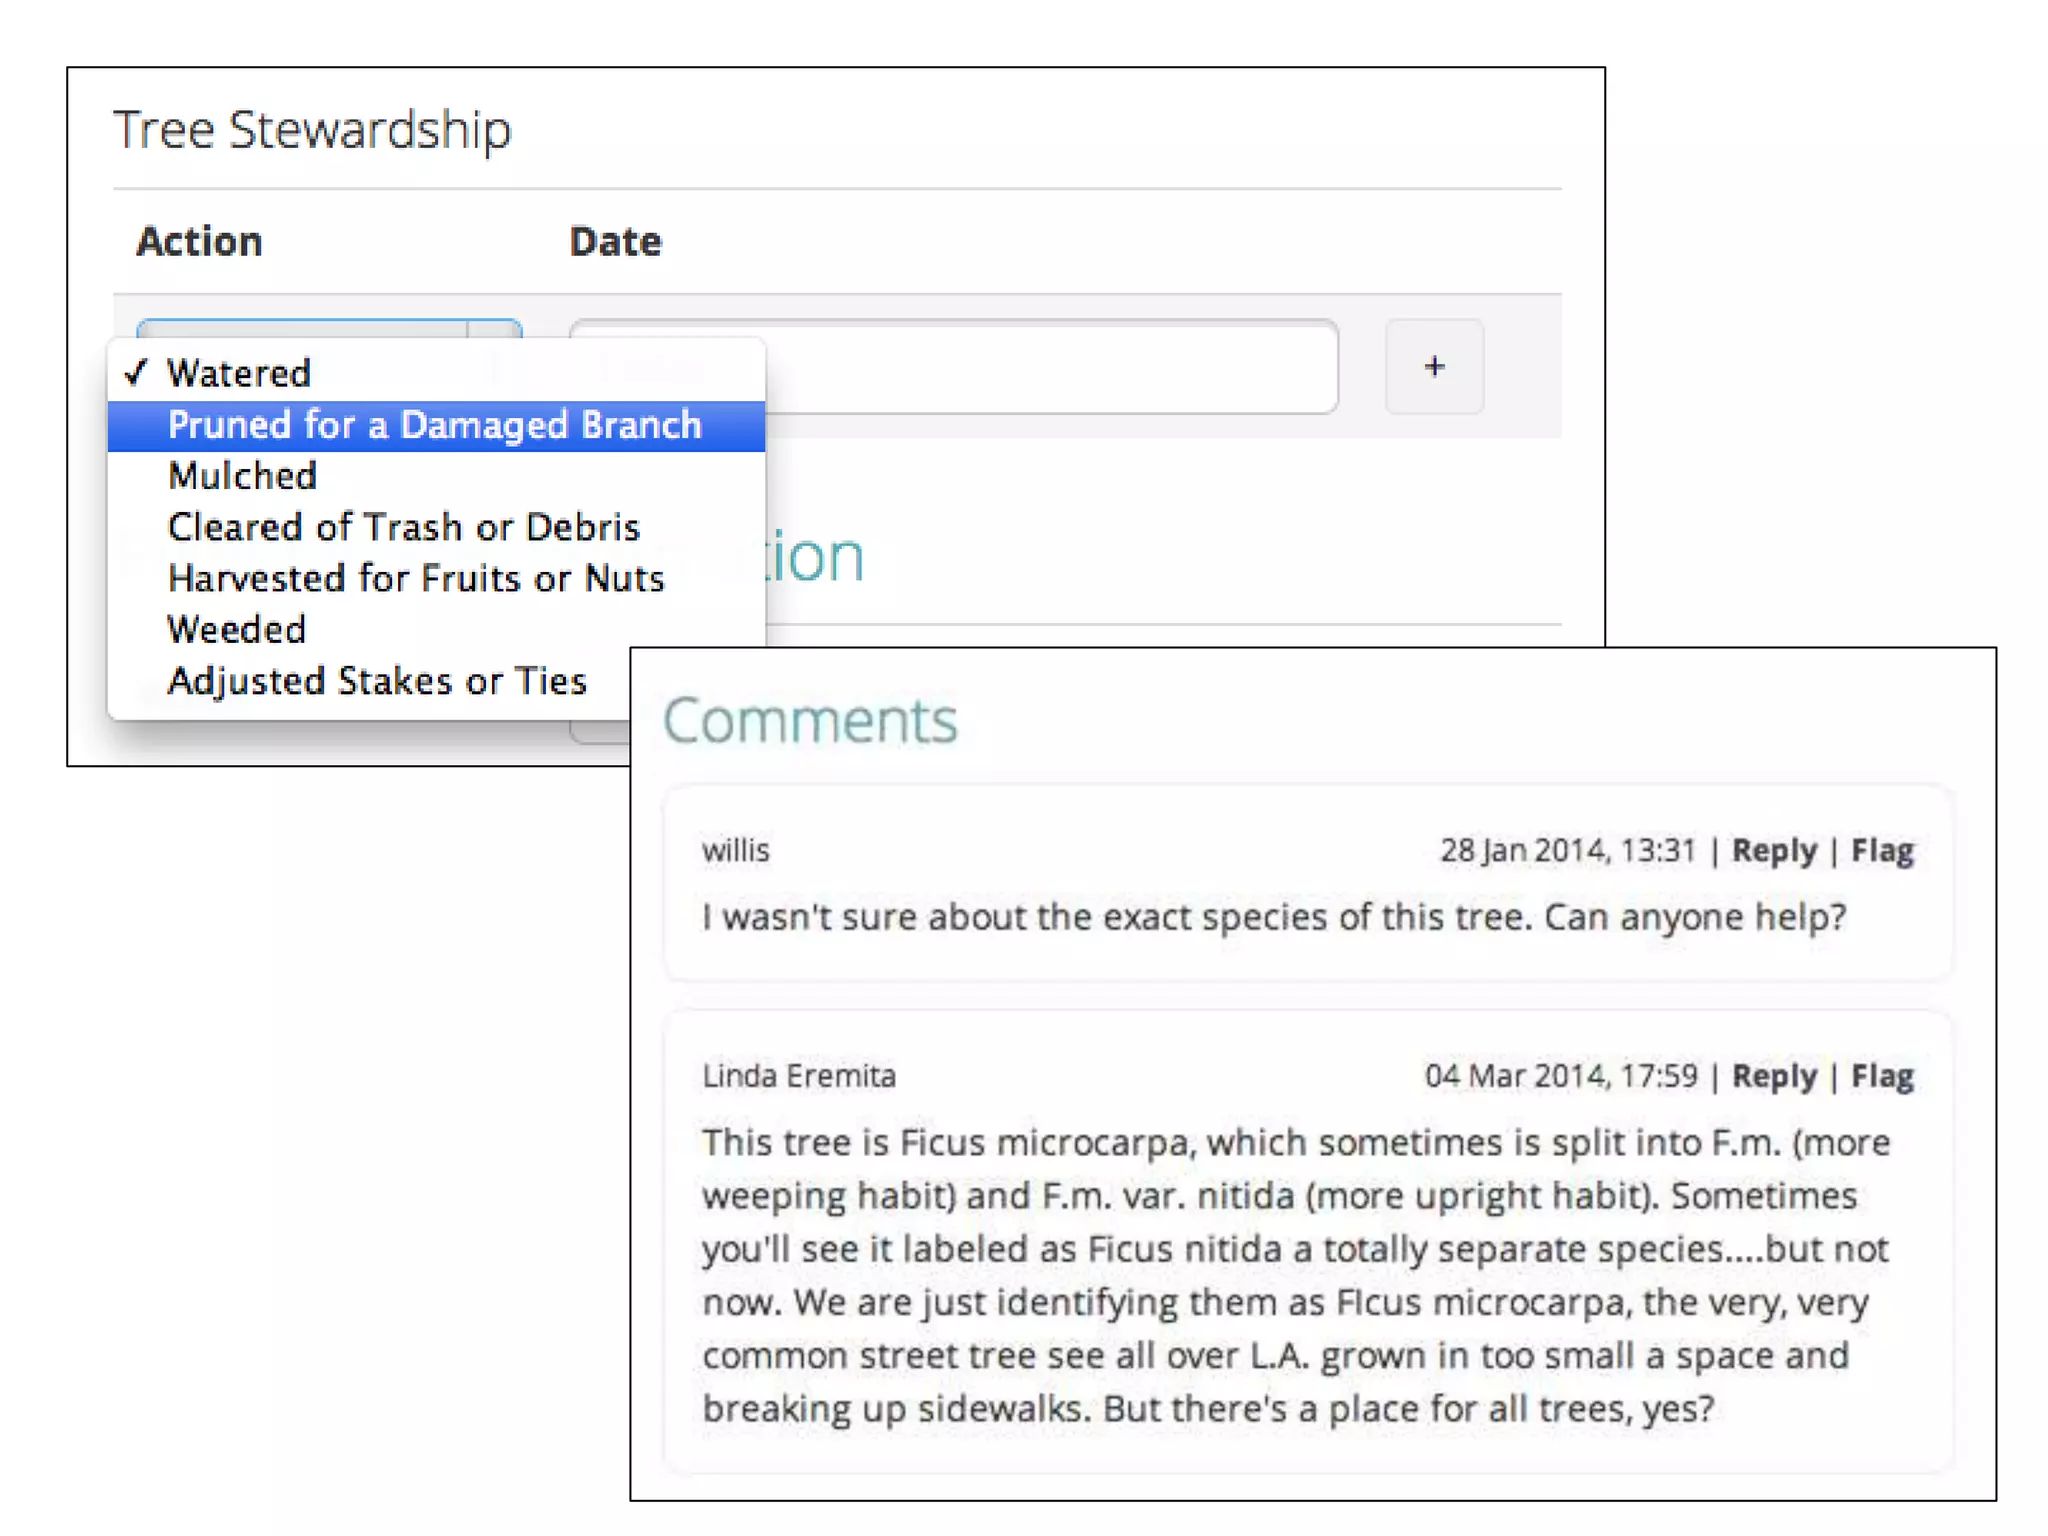
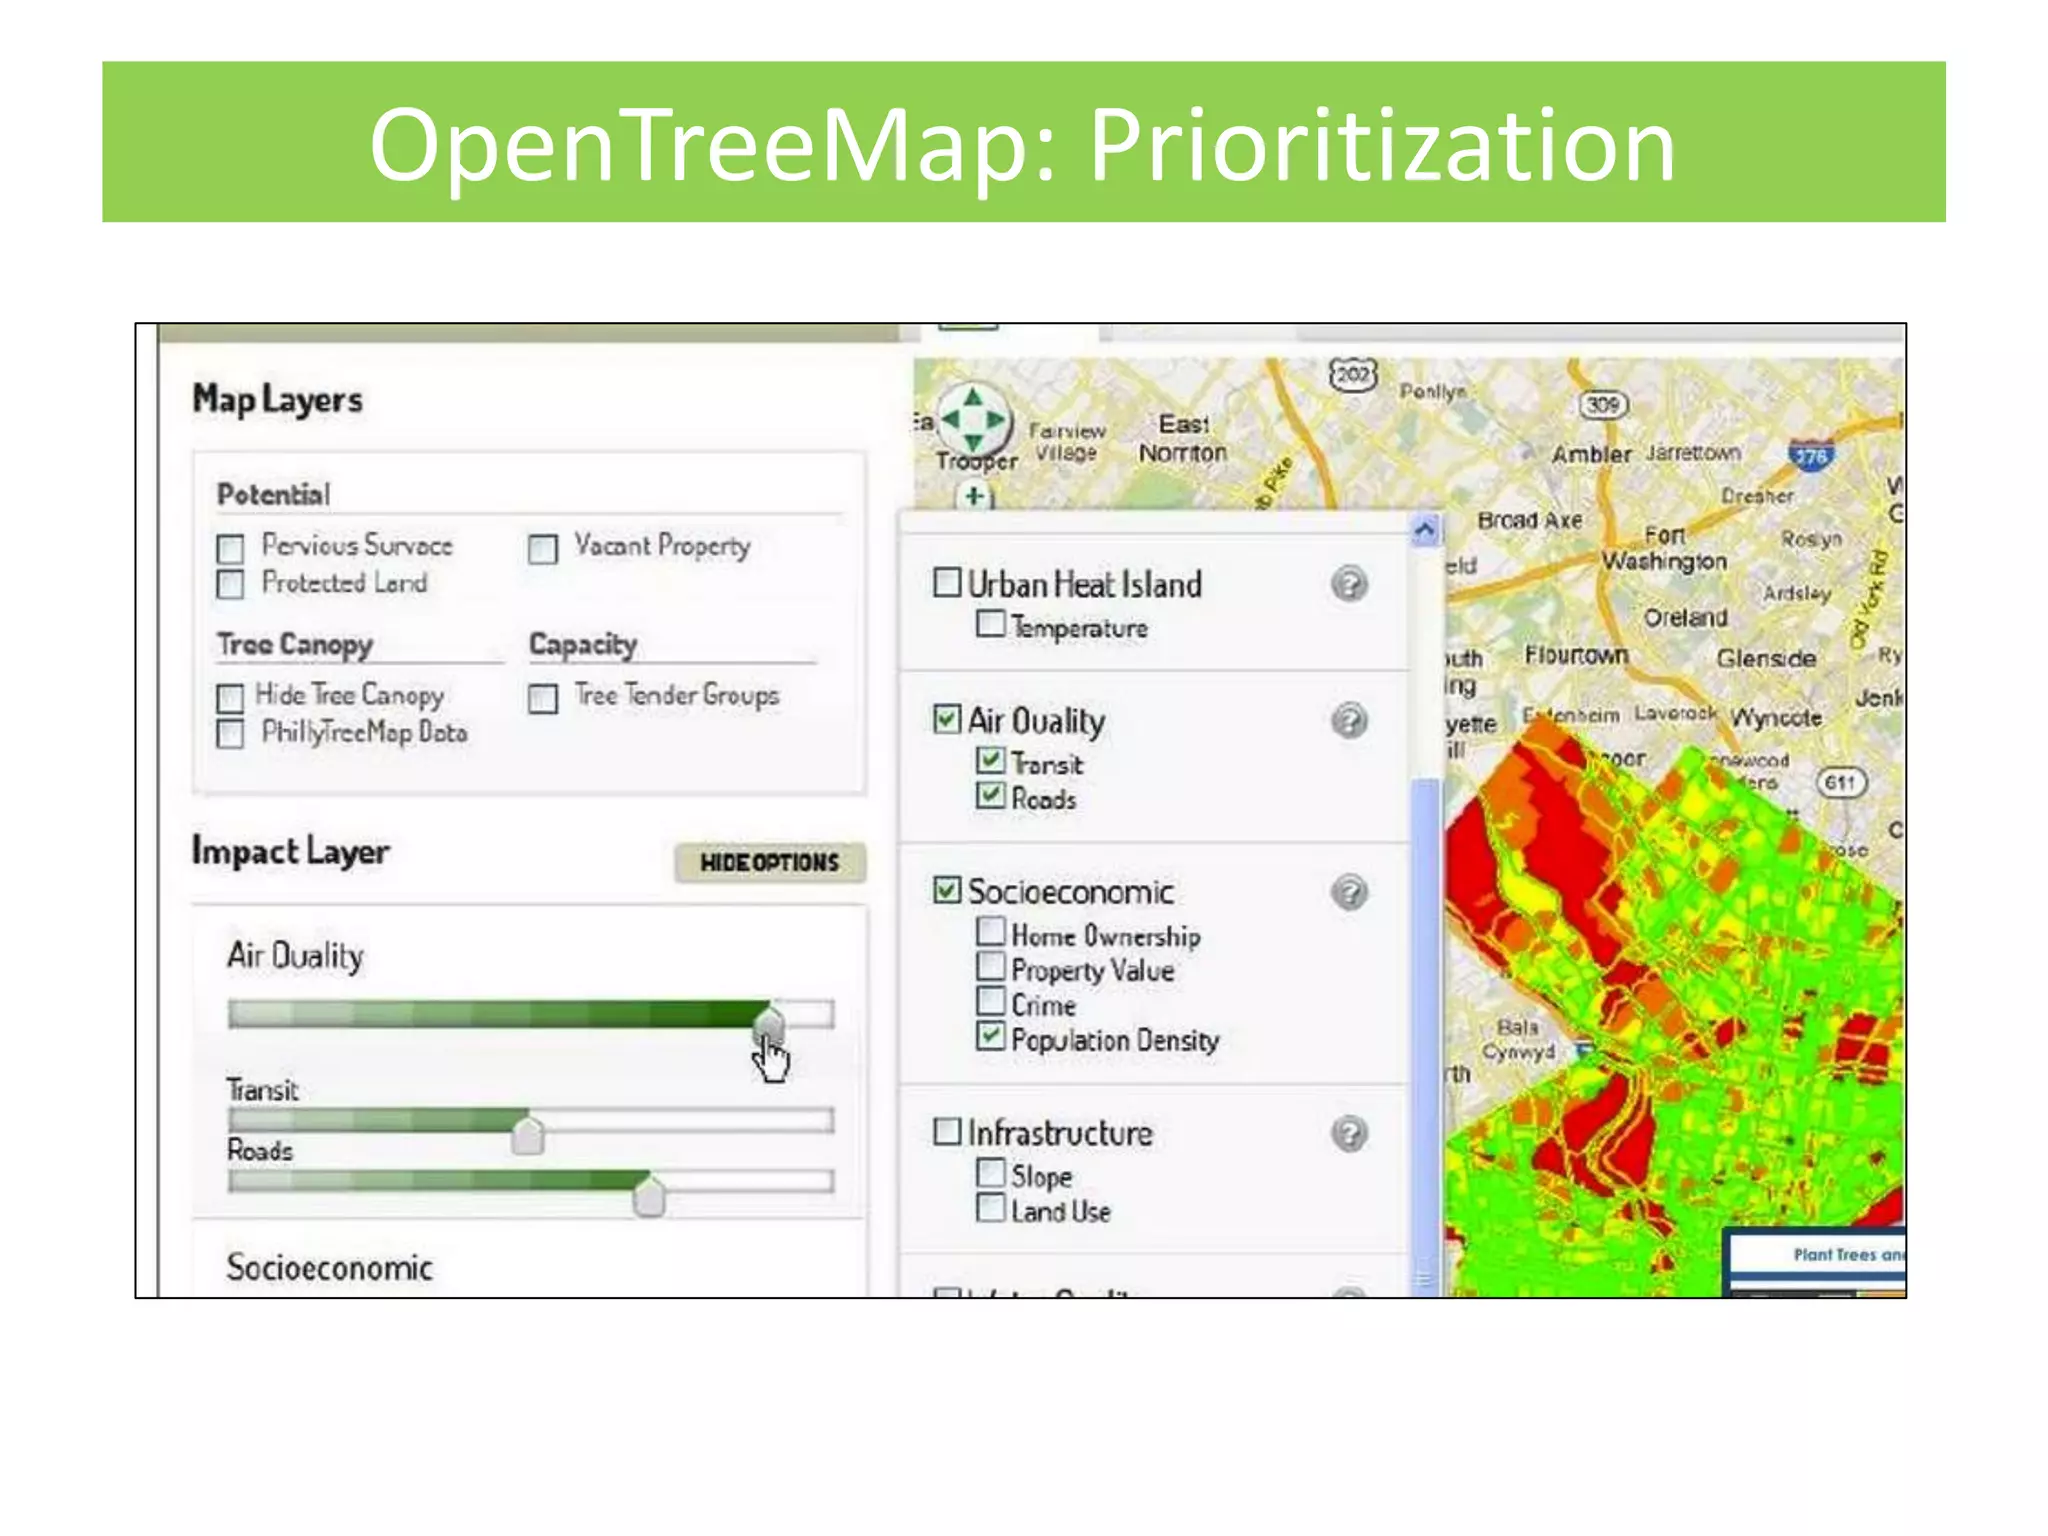
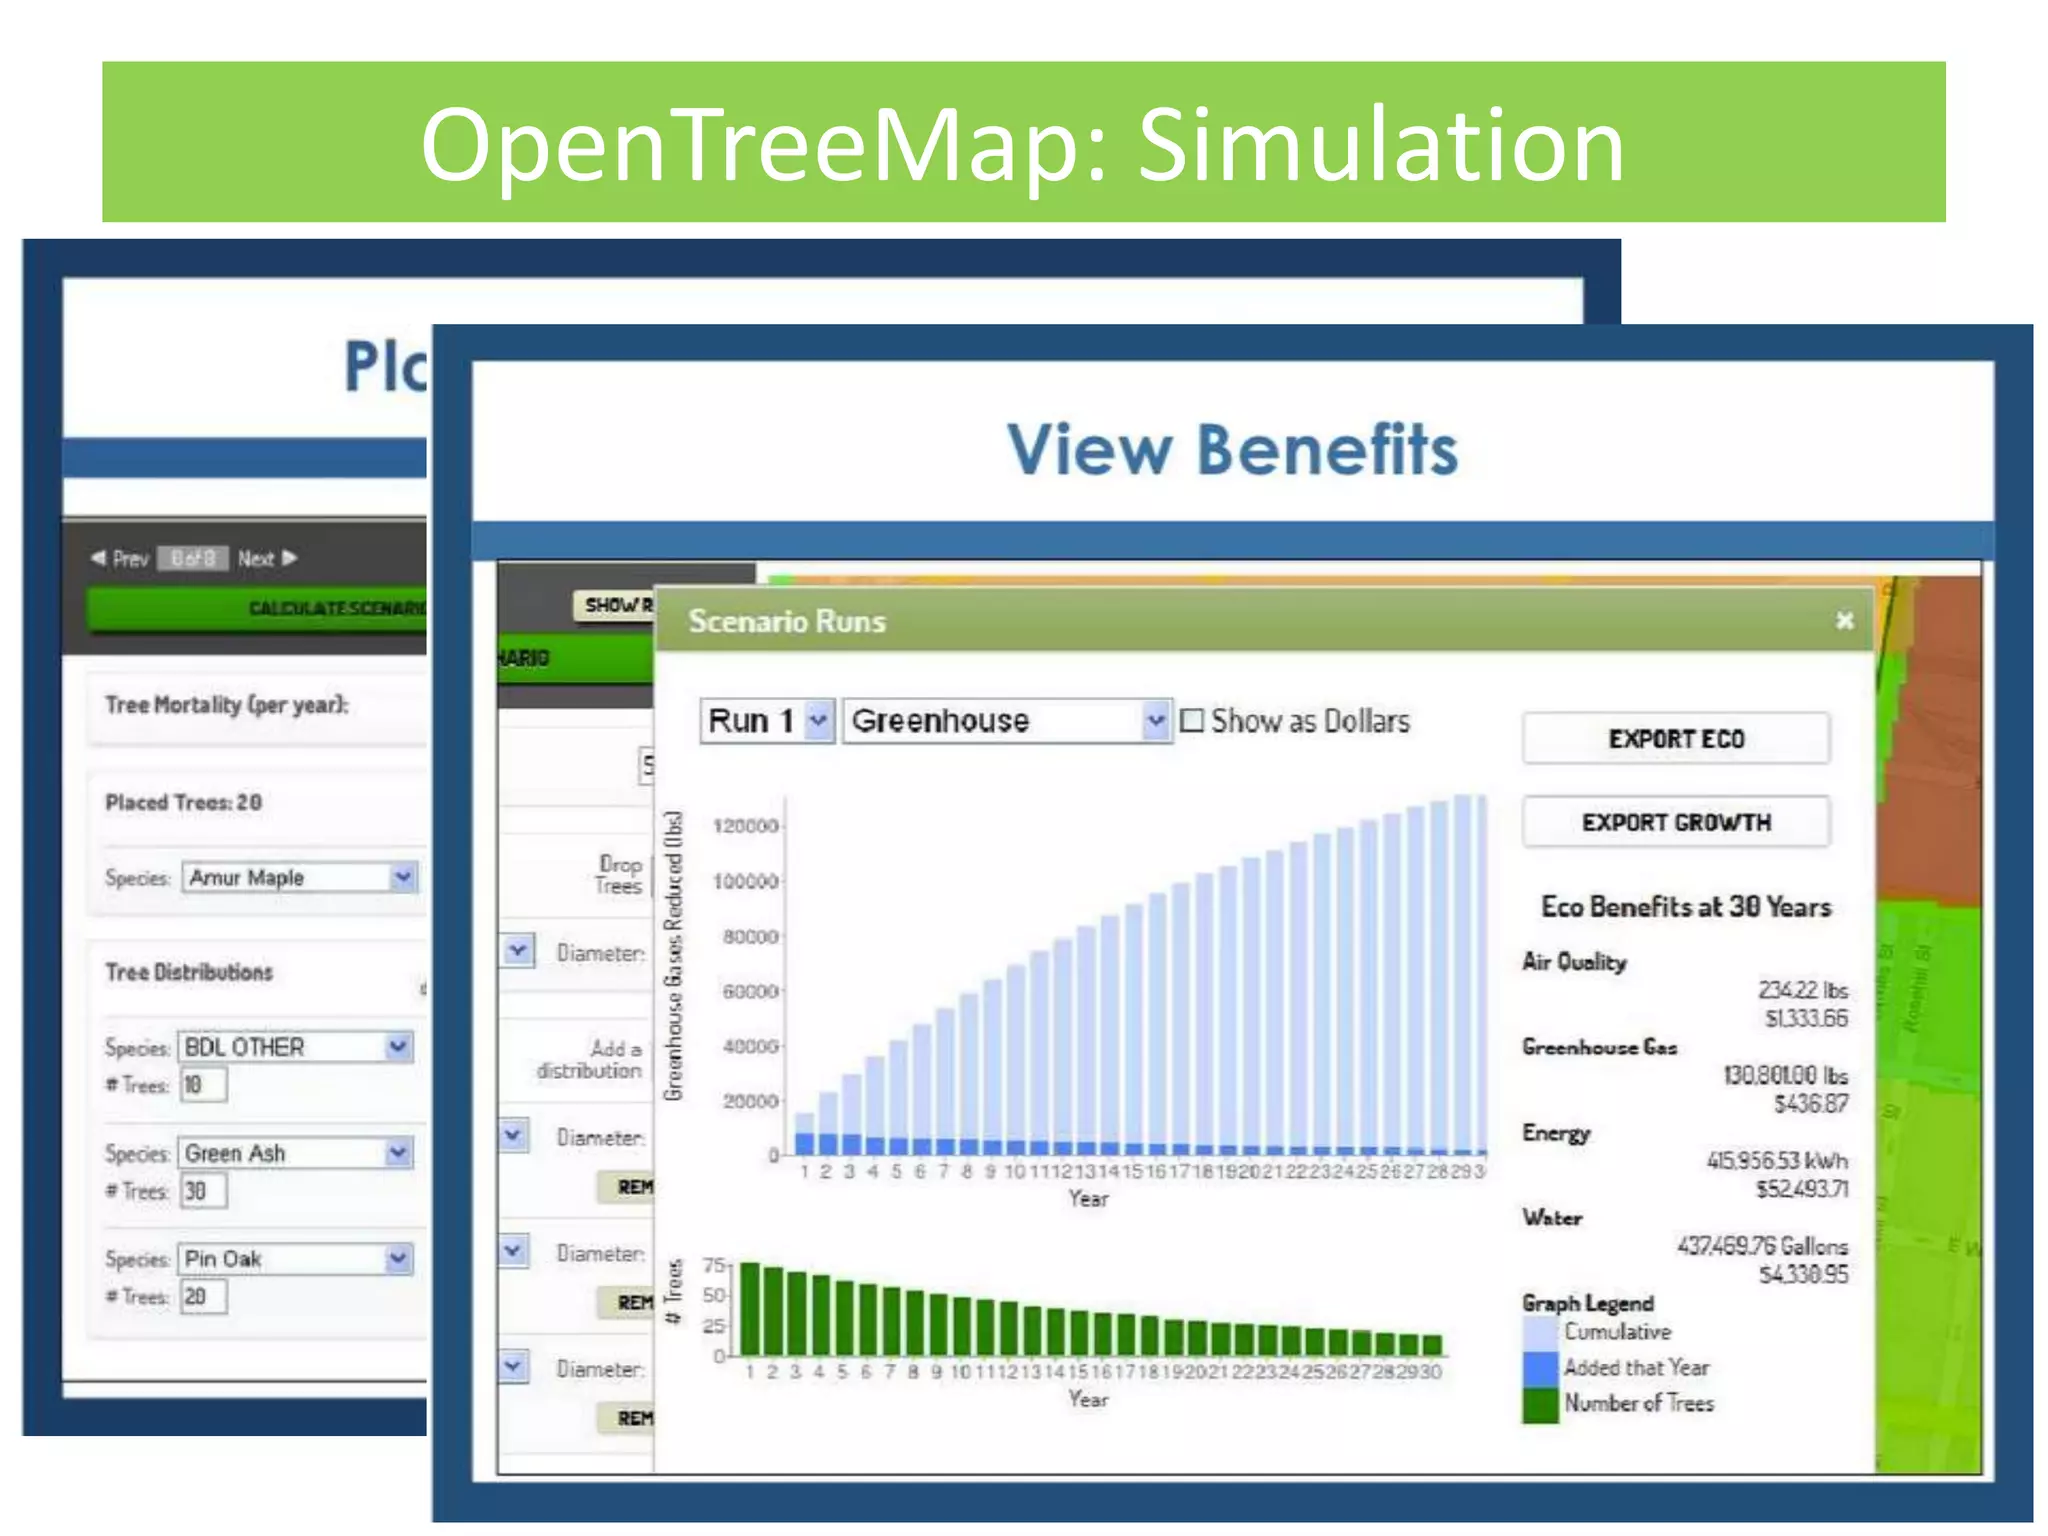
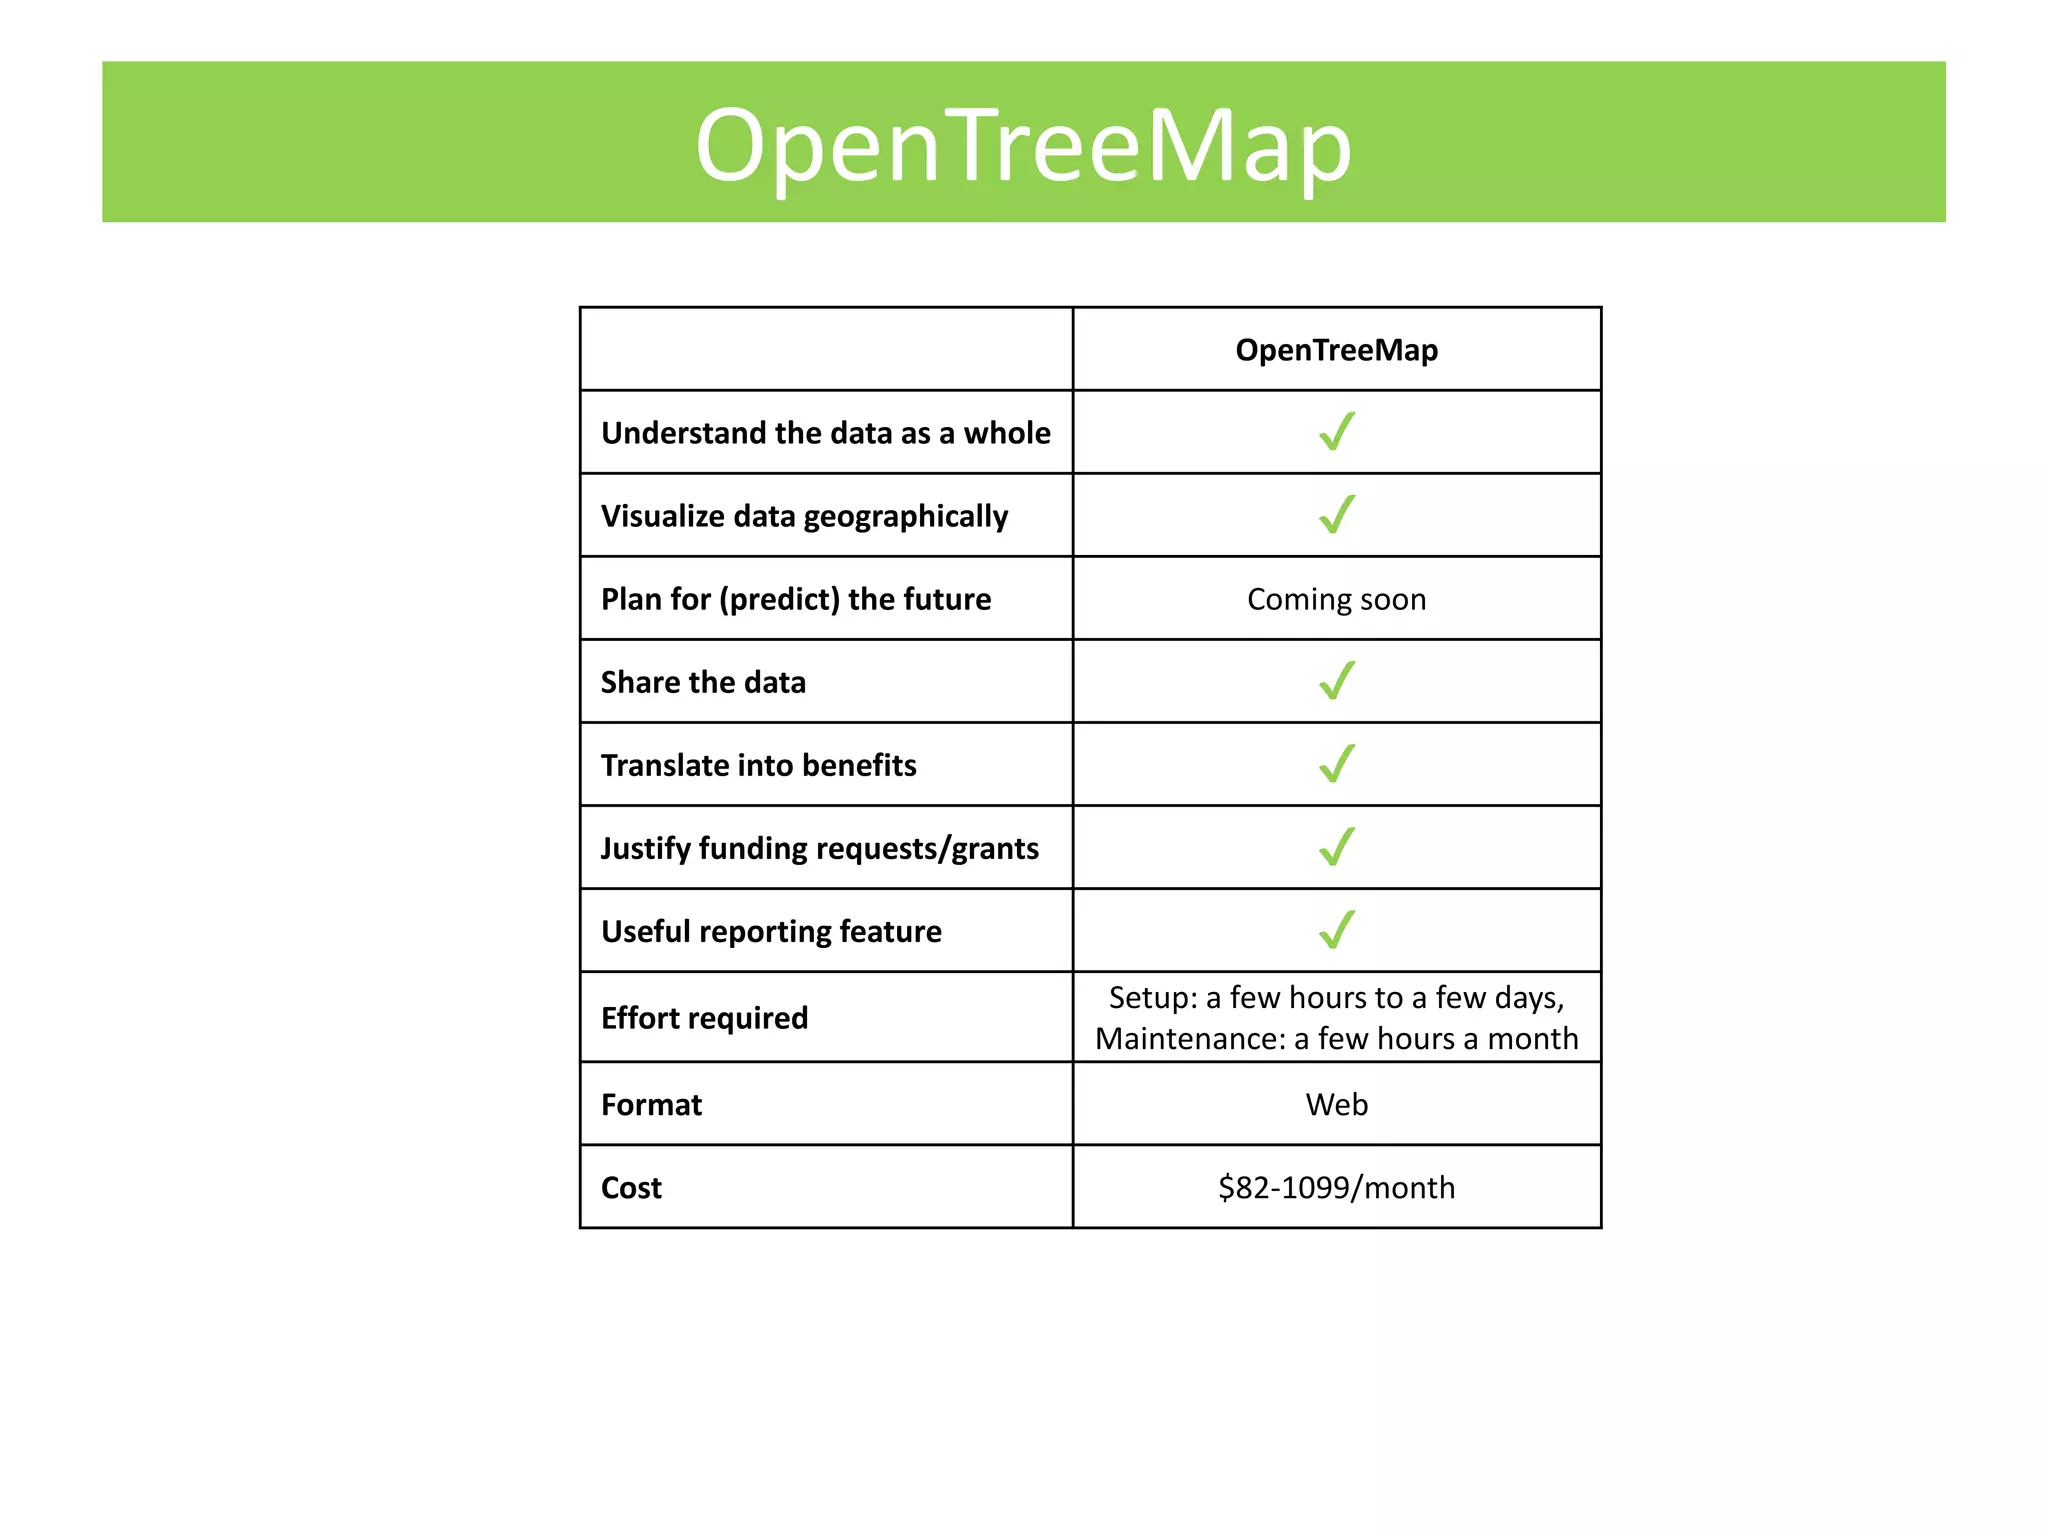
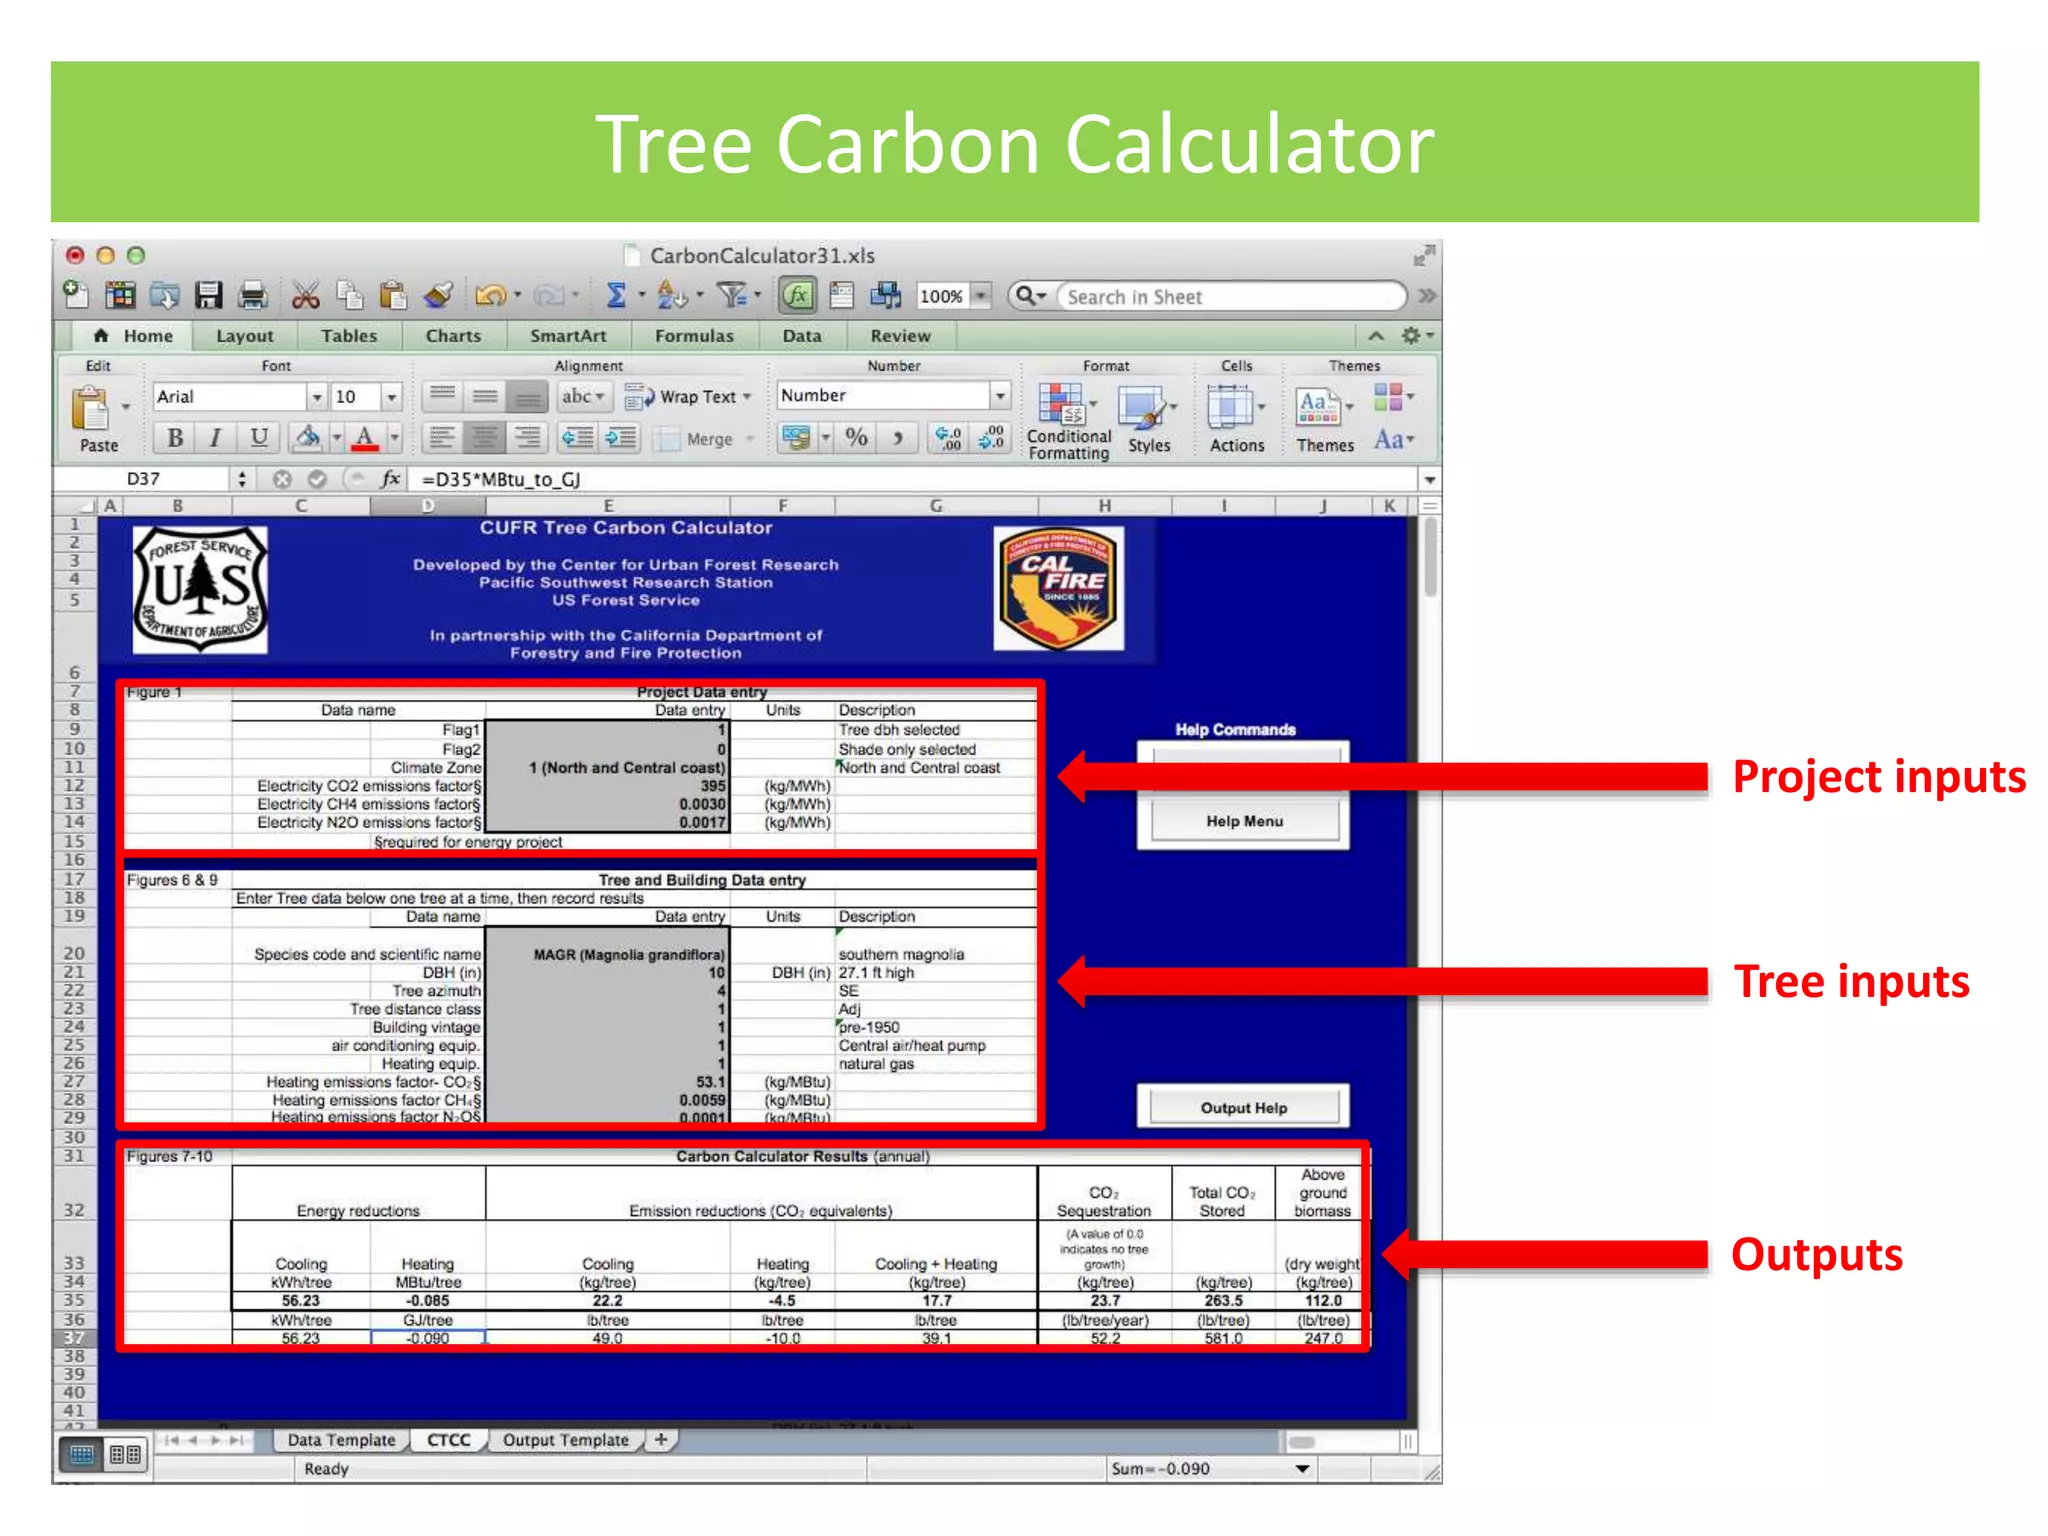
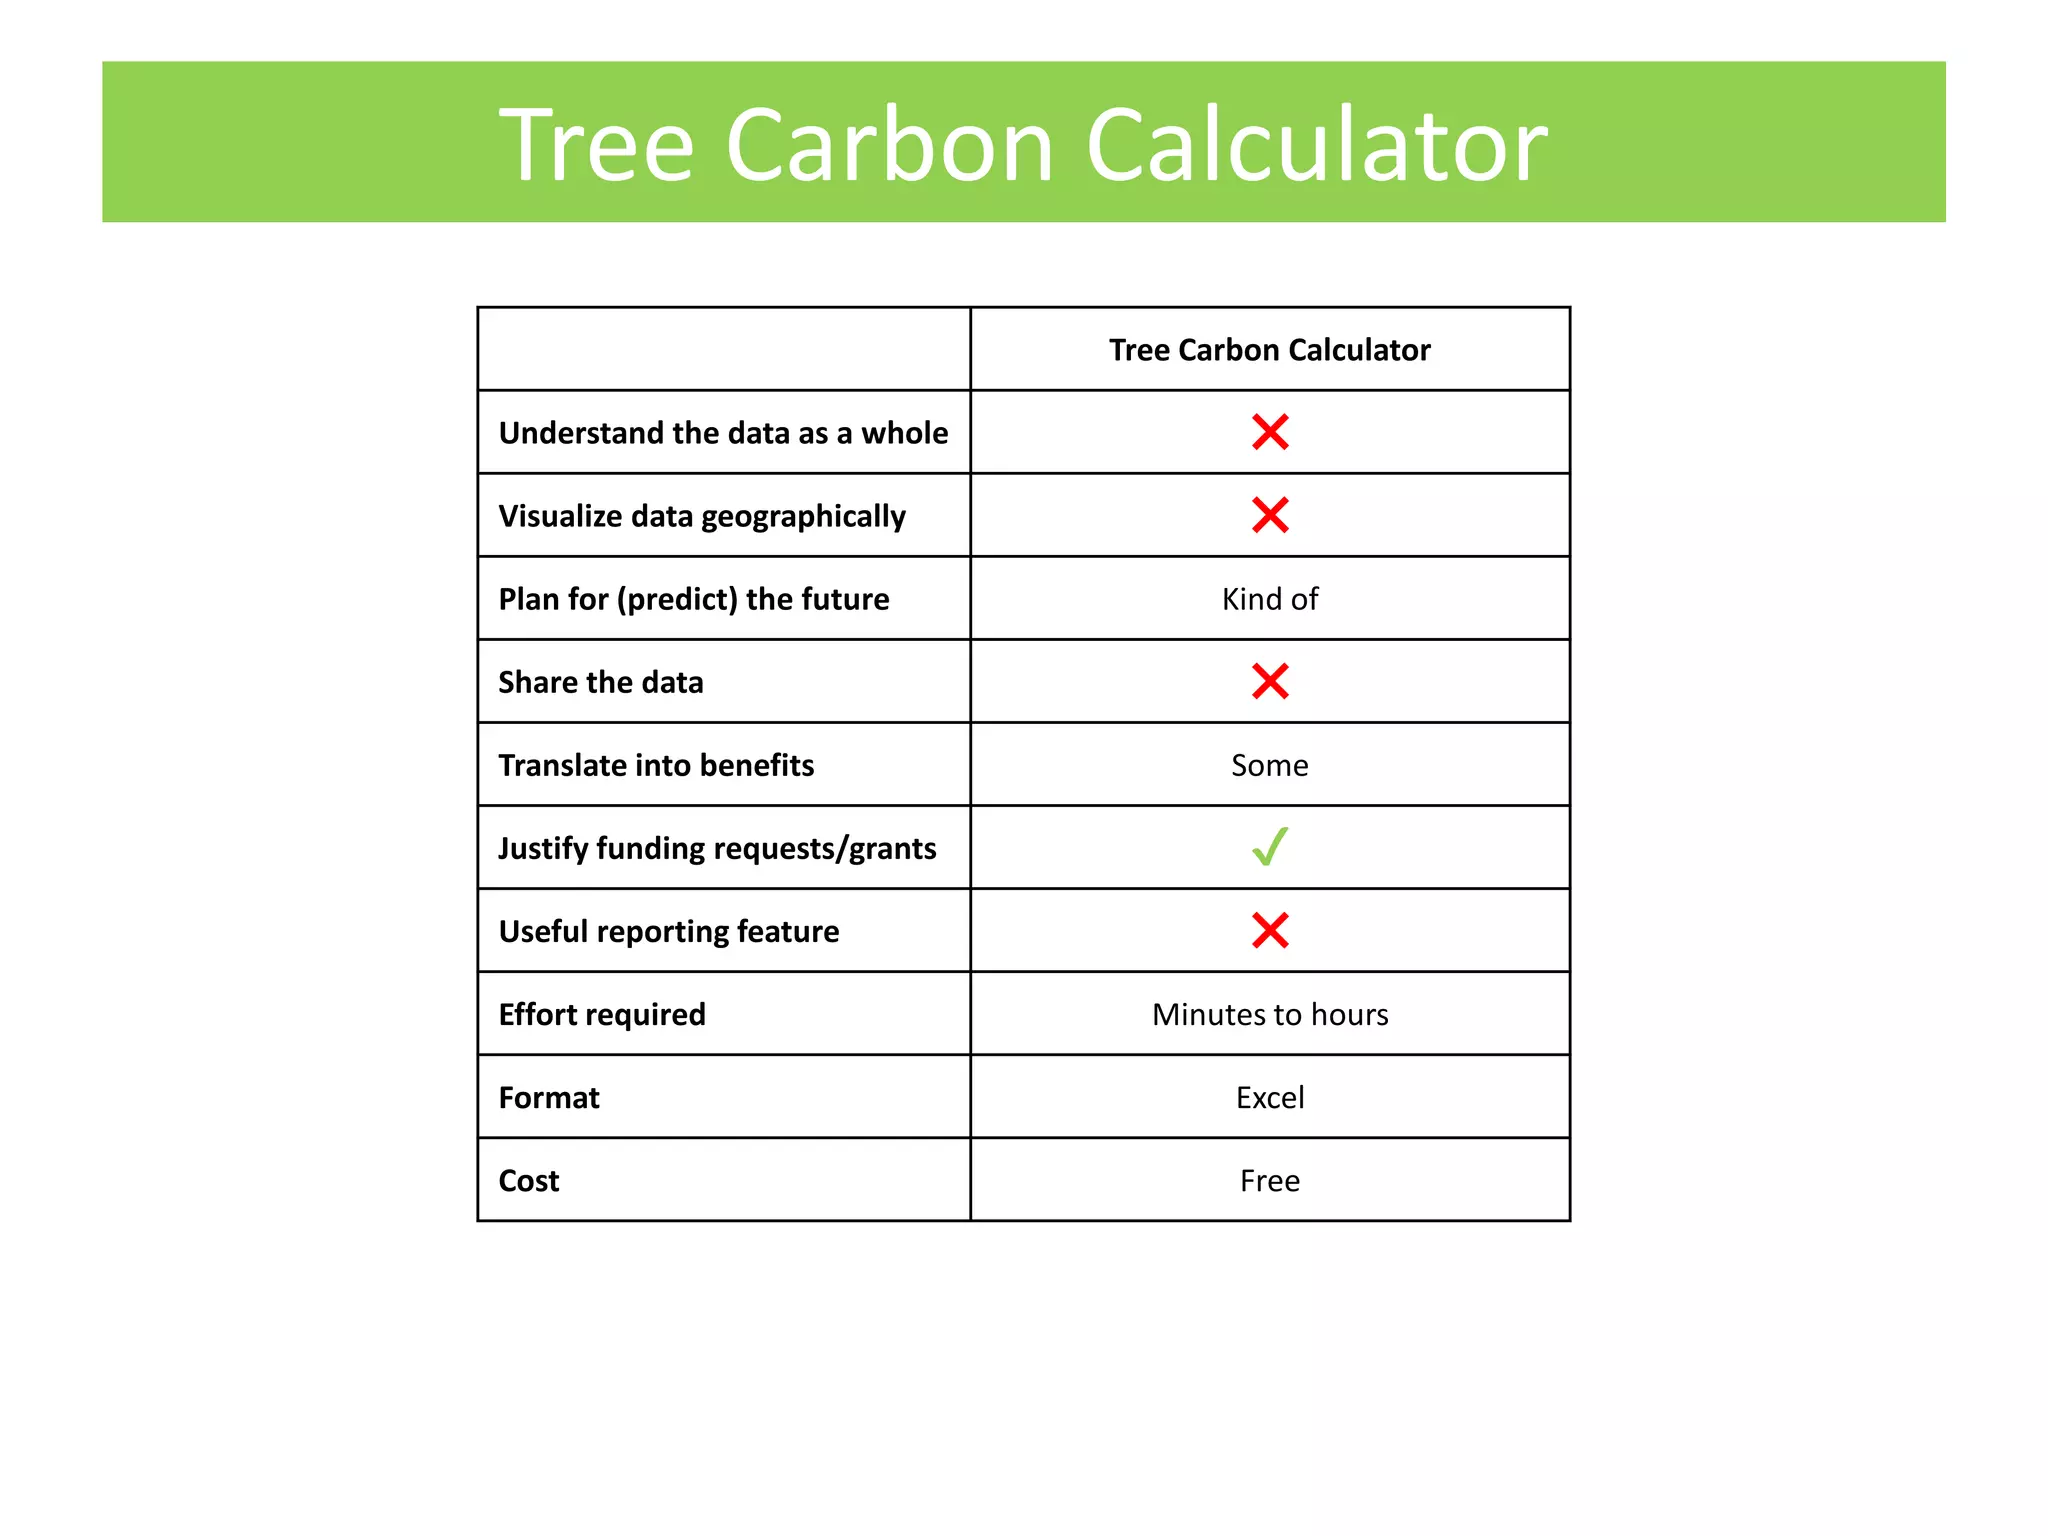

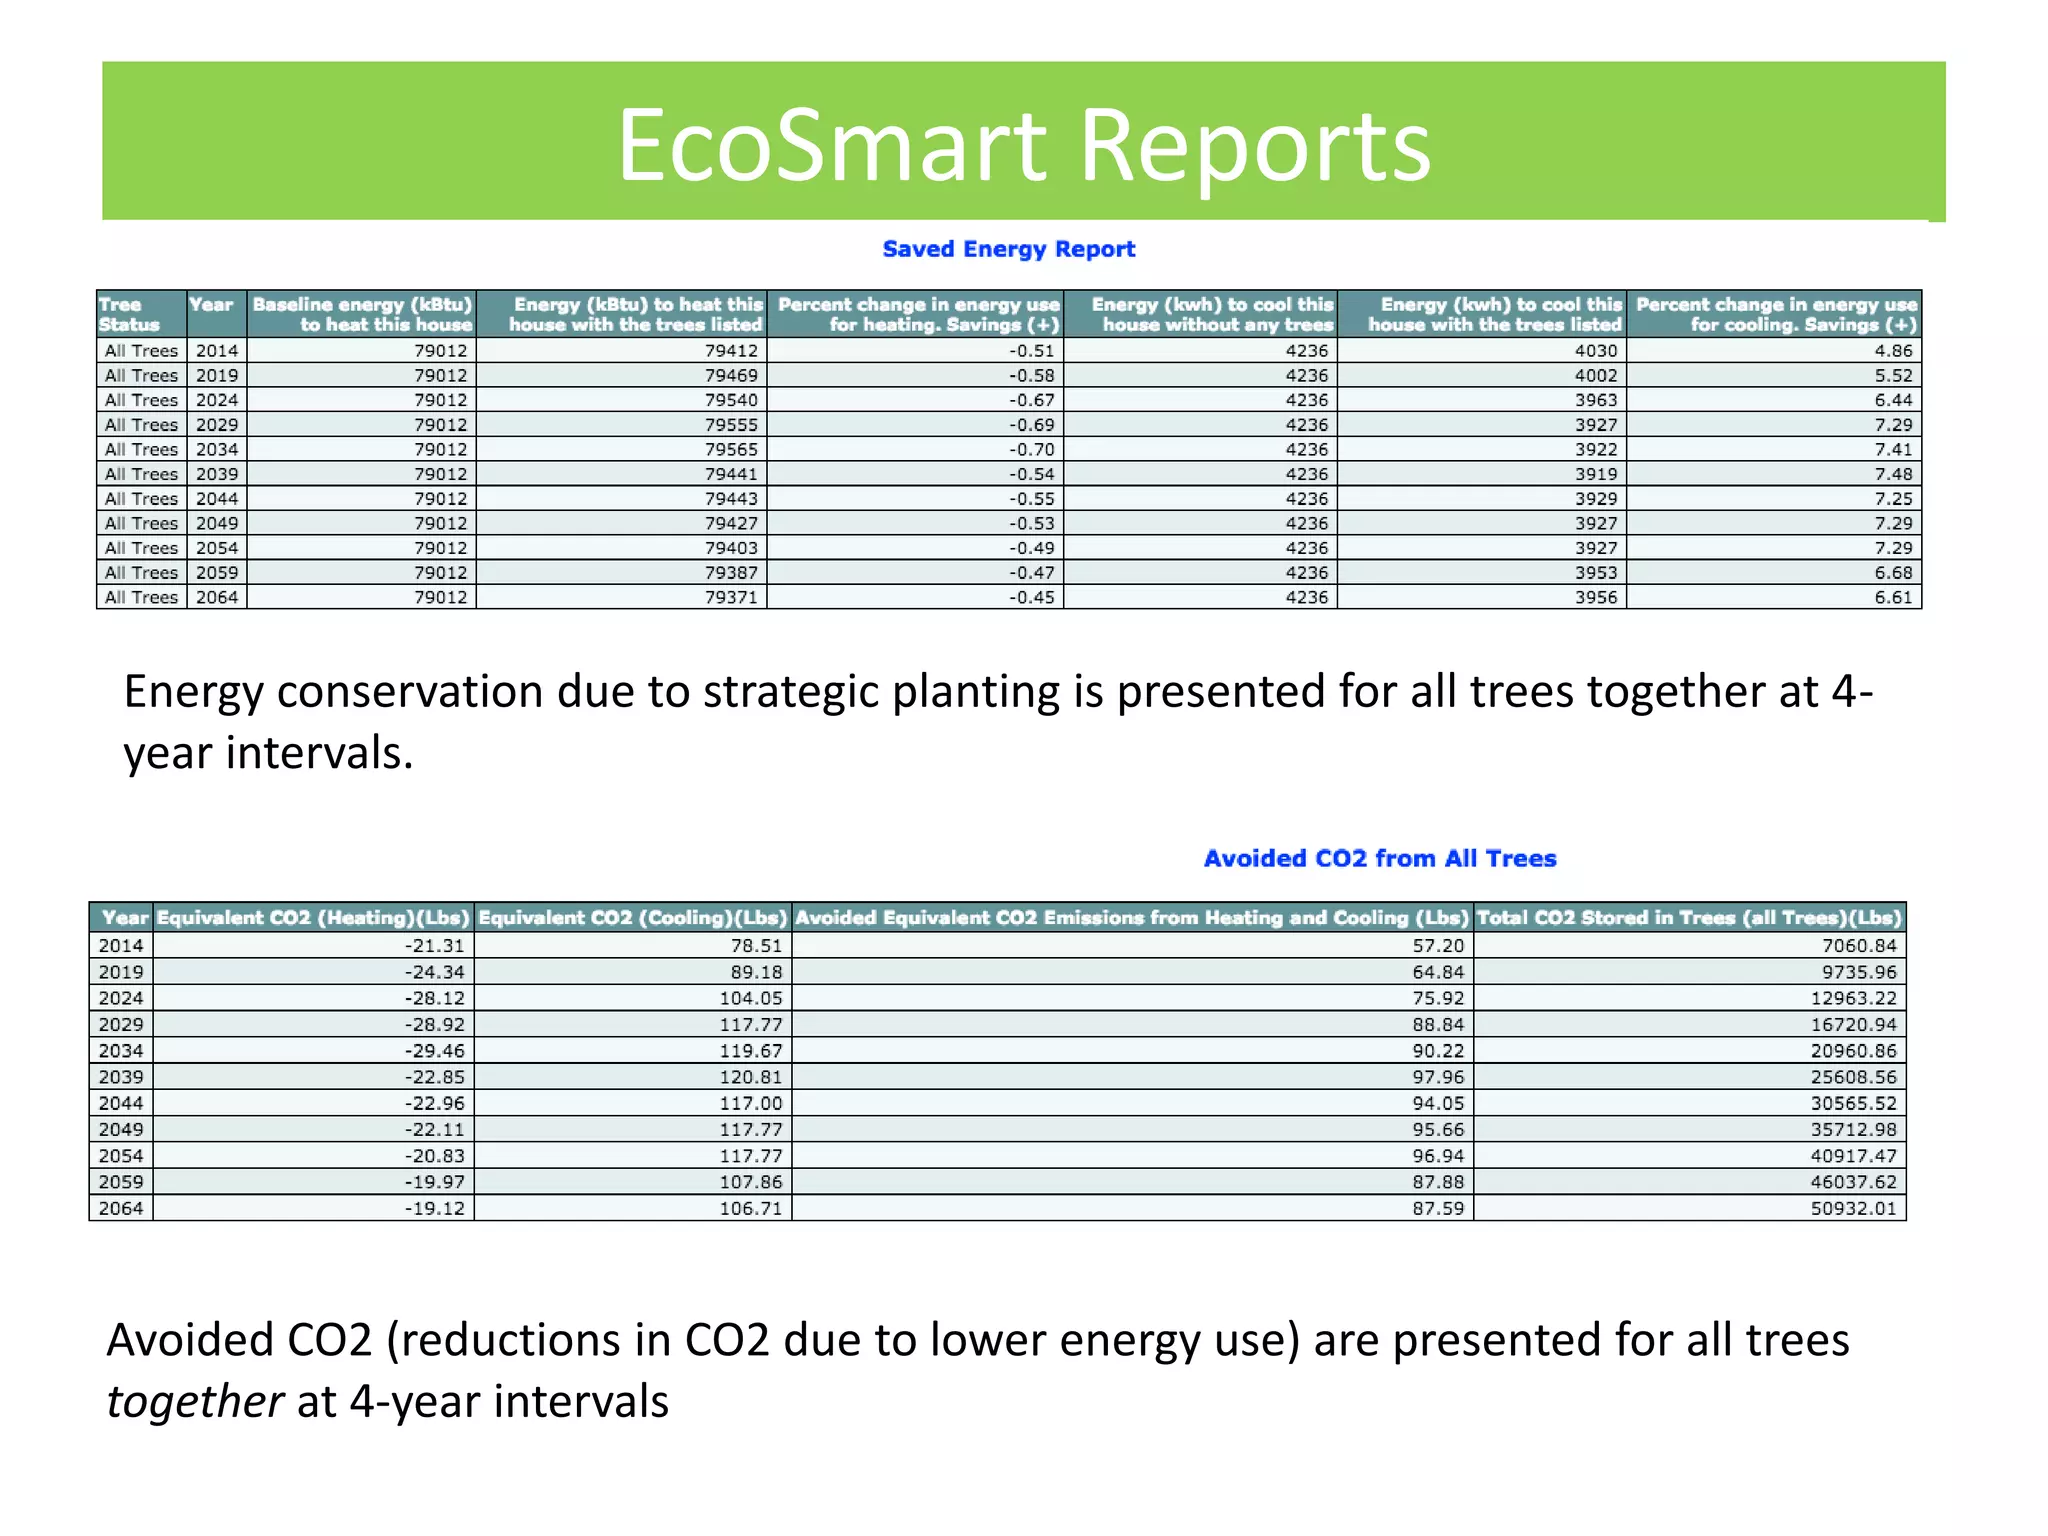
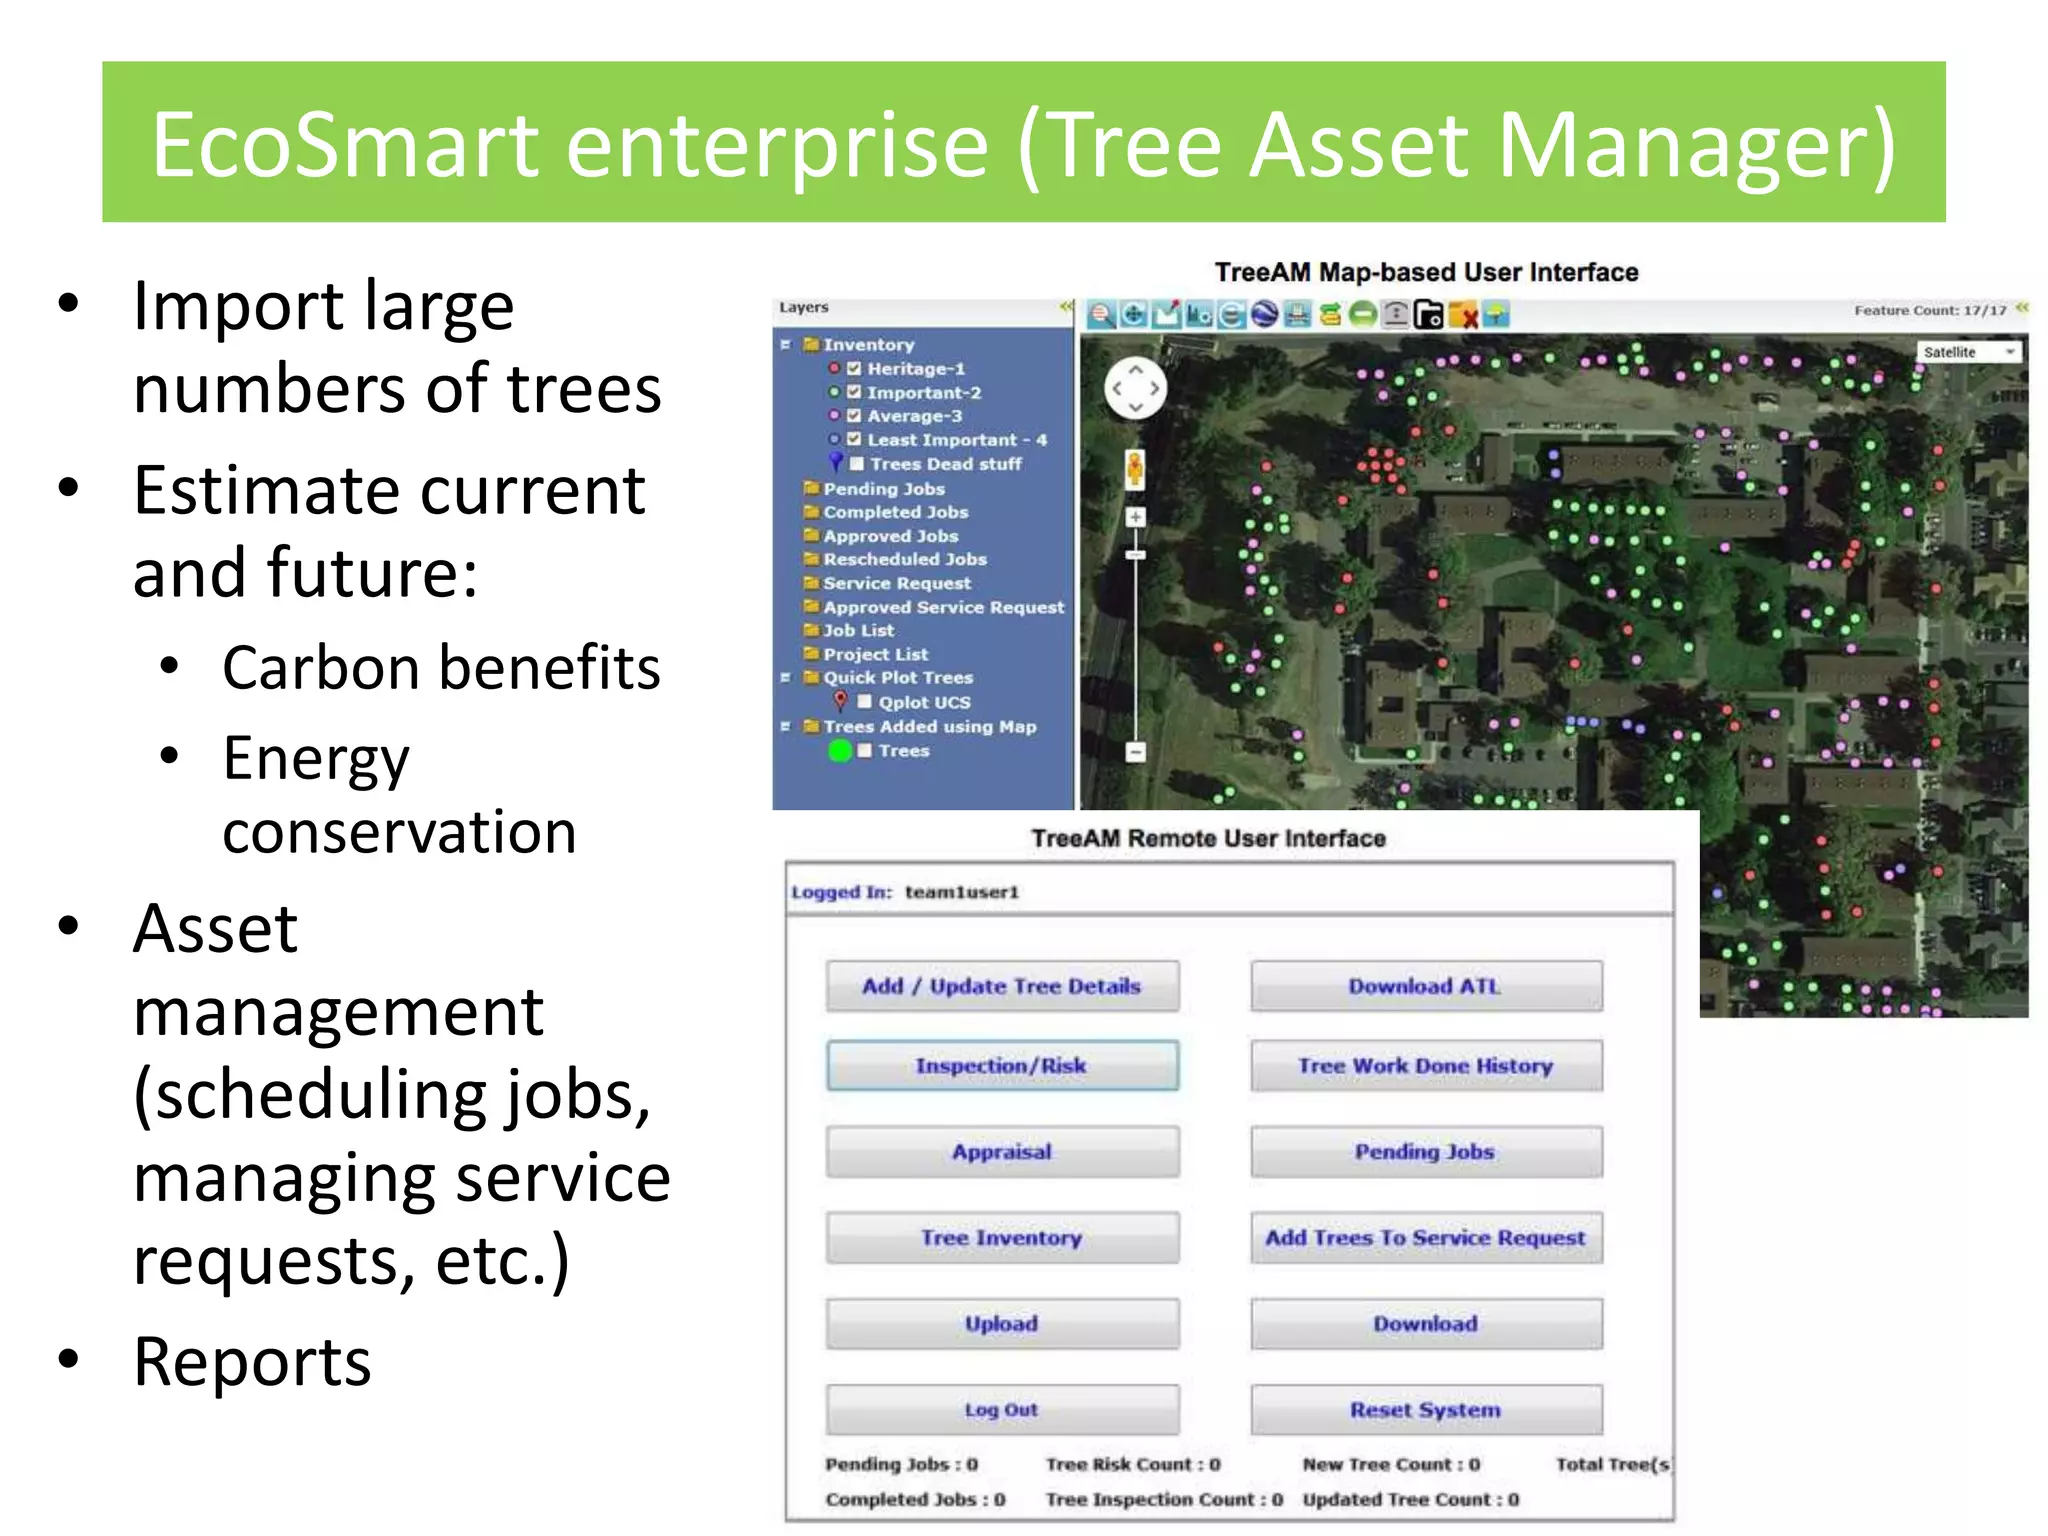
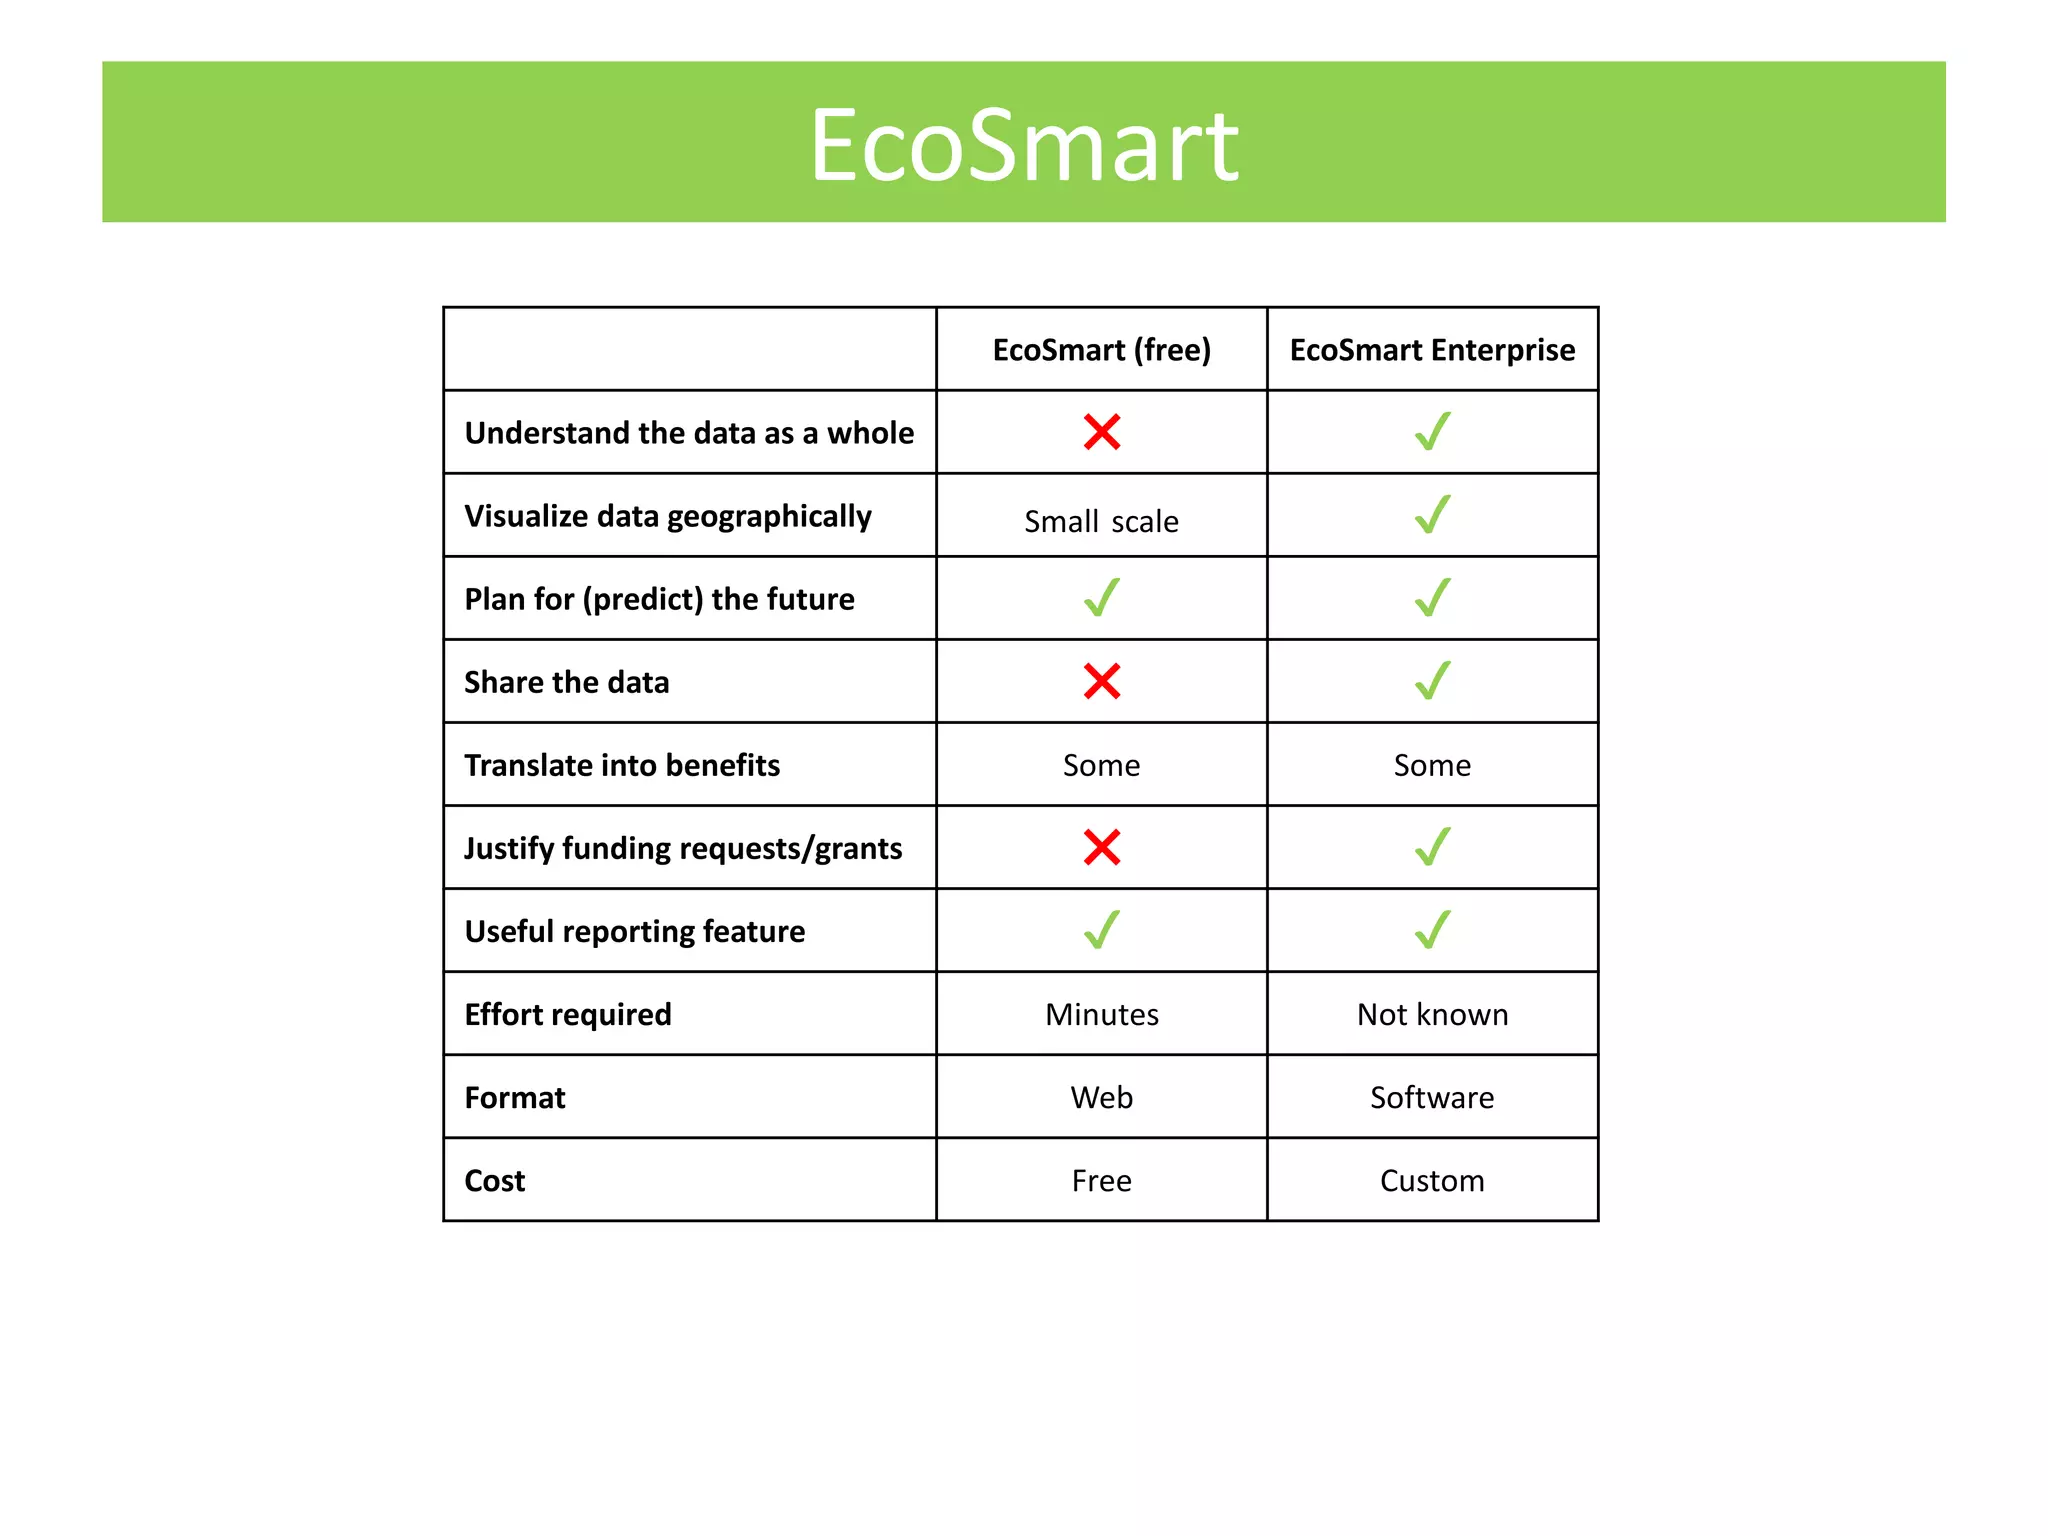
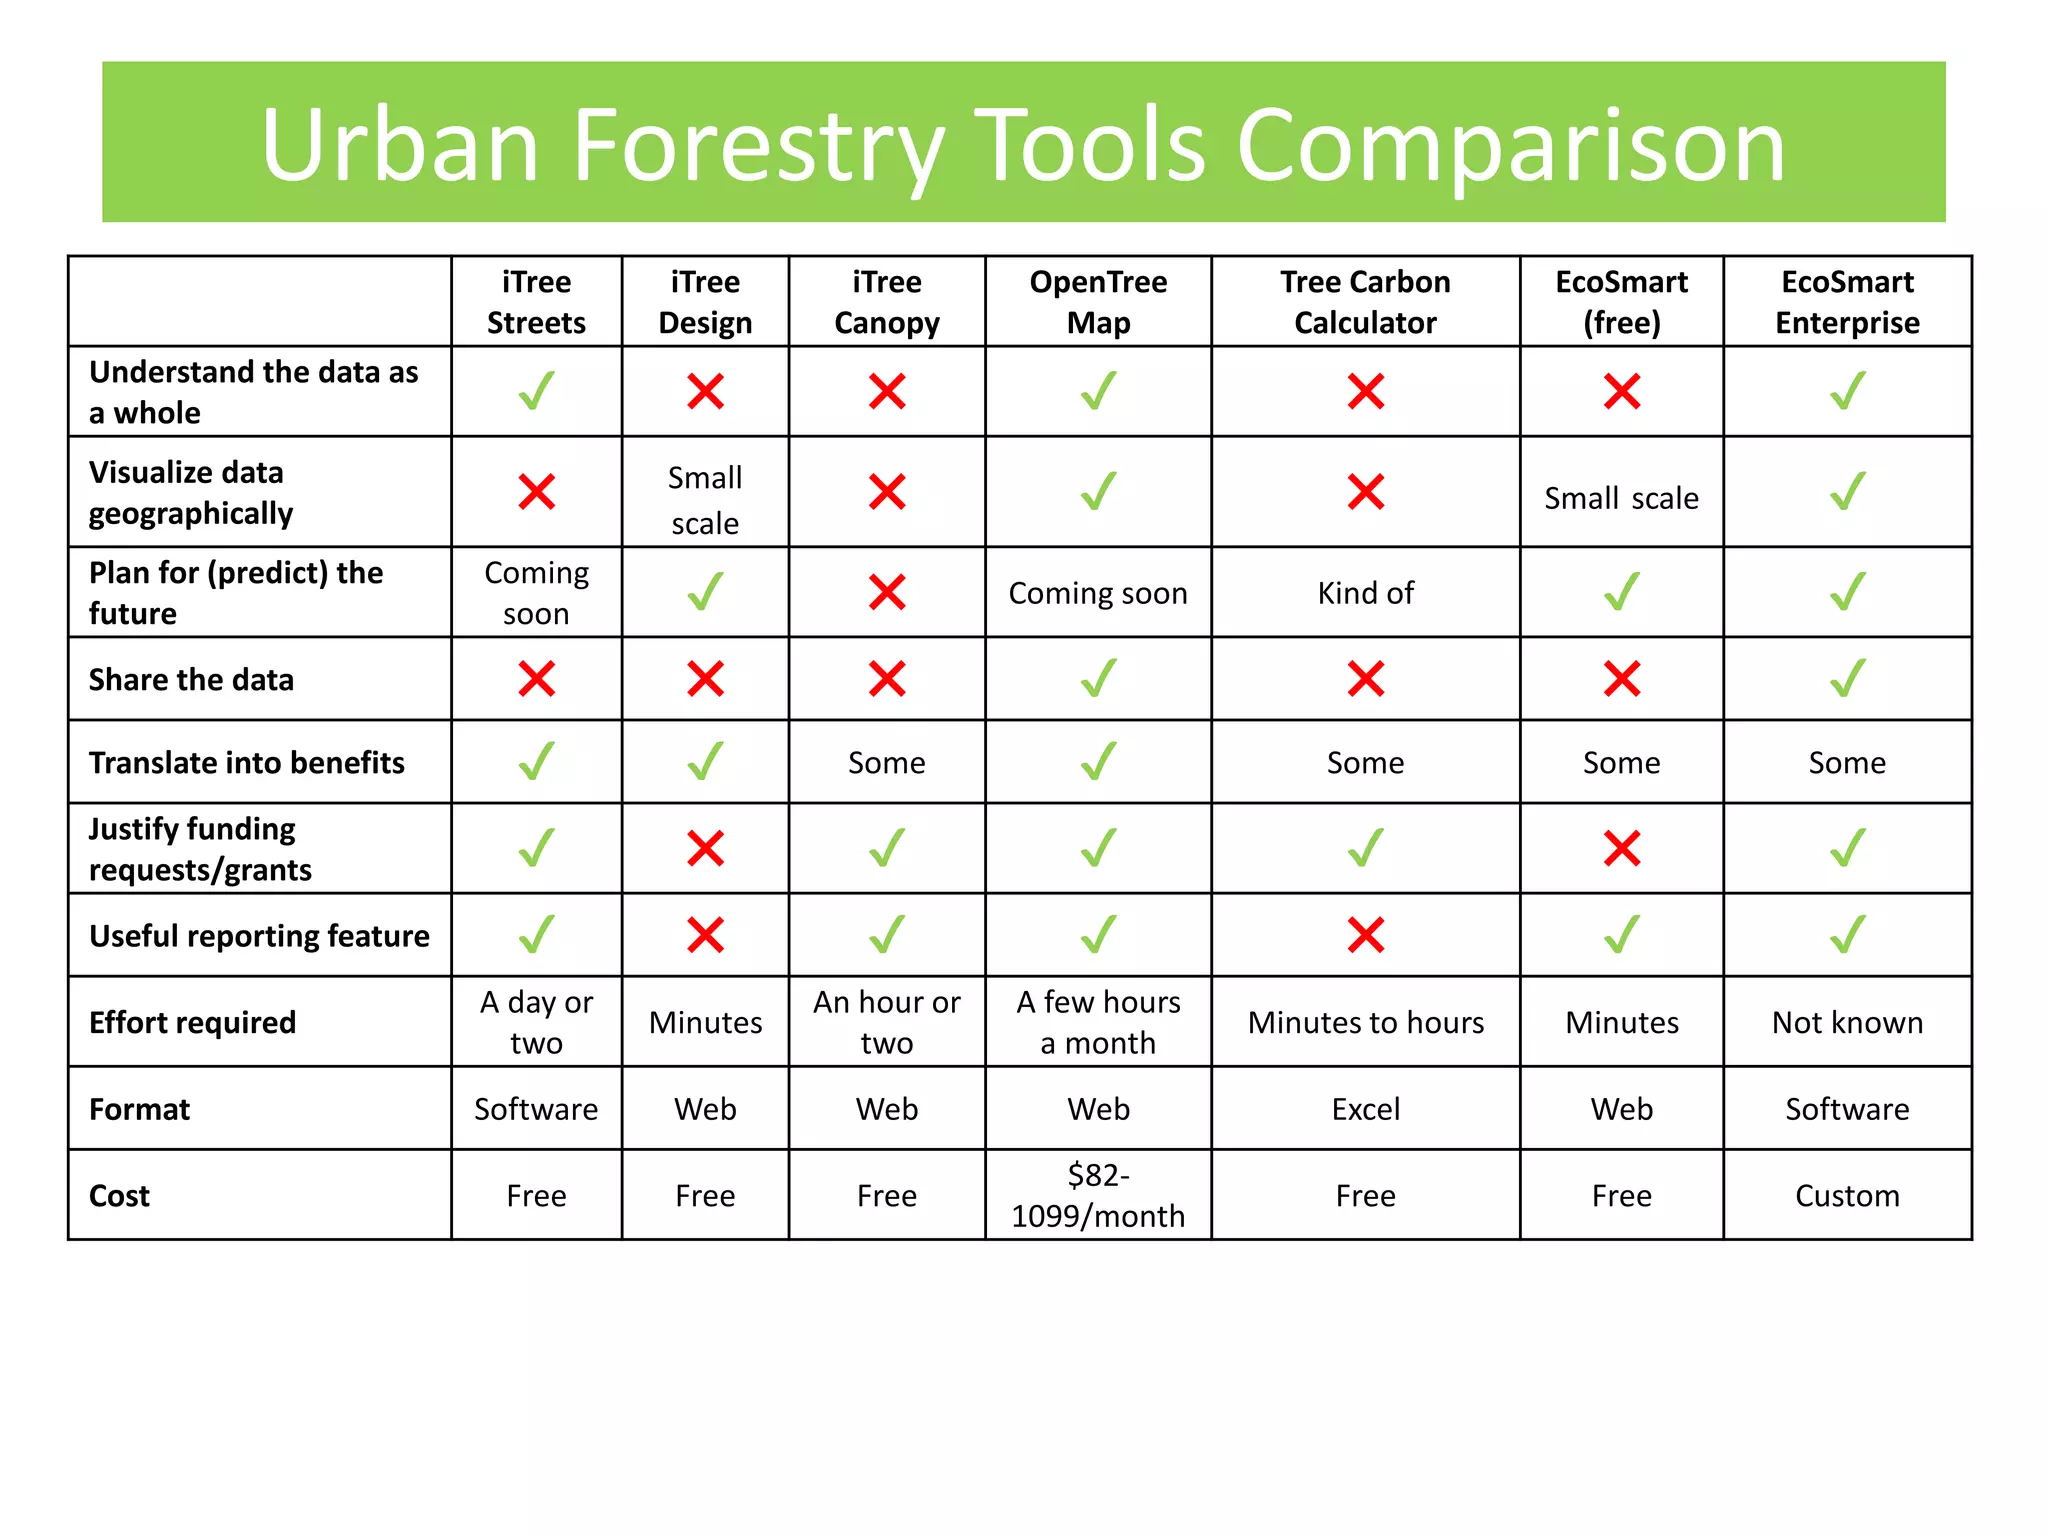

The document provides tools and methodologies for urban forest managers to effectively utilize their forest inventory data. It emphasizes understanding data as a whole, geographic visualization, future planning, and justifying funding requests. Various tools such as iTree and OpenTreeMap are highlighted for different functionalities, with details on their costs and features.


