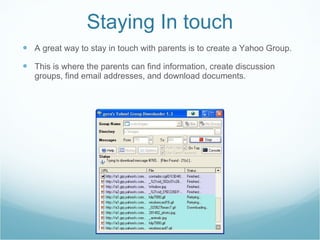
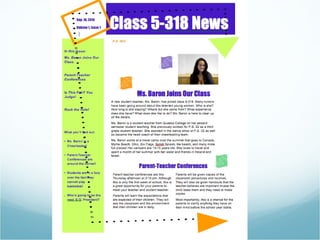
The document discusses various ways that technology can be used to engage students and keep parents informed. It recommends creating a Yahoo group to share information with parents, using Microsoft Word to create a monthly newsletter for parents, and posting student grades and test analysis on the Yahoo group using identification codes. It also discusses using the ARIS system to track student data and make it available to teachers and parents.
These slides are part of Dr. Voltz's presentation for the ISBE administrator academy "Become an iAdministrator to Strengthen Your Leadership and Management Skills
The CompassLearning Pulse Poll was a spot survey of national education leaders attending the ASCD Critical Transformation Conference in San Antonio, Texas, March 6 -8, 2010. The polling was conducted by PURSUIT, an independent research and consulting firm based in Austin, Texas. Interviews were completed in person on Saturday and Sunday, March 6-7, among a random sampling of conference attendees. Survey results reported carry a standard margin of error of +/- 5.5 percentage points at the 95% confidence interval.
Too Much Screen Time: Fake News or Real Parental Concern?Julie Evans
Education leaders are perplexed by parents’ views on technology use: parents worry about too much screen time but say digital learning is important. This session will unpack current research on parents’ views and provide K-12 leaders with insights to address screen time concerns with effective messaging and real data.
This was the last part of my presentation in National Meet ,NCERT,New Delhi on 22nd Dec,2012 celebration of National Mathematics Year.This slide show will give idea to teachers about the use of Technology in Teaching Mathematics.
Pratima Nayak,KV,Fort William,Kolkata
pnpratima@gmail.com.
Interactive Power Point presentation intended to introduce learners to the basics of learning analytics.
Prepared by Tanya Elias and shared in the Learning and Knowledge Analytics course https://landing.athabascau.ca/pg/file/tanyael/read/43701/learning-analytics-oer
WCOL2019: Learning analytics for learning design or learning design for learn...Marko Teräs
Presentation at the 28th ICDE World Conference on Online Learning on the relationship between learning design and learning analytics. Part of a national-level learning analytics research and development project funded by the Finnish Ministry of Education and Culture.
Learning analytics and Moodle: So much we could measure, but what do we want to measure? A presentation to the USQ Math and Sciences Community of Practice May 2013
11. Data-Driven Instruction Data Allows Us To: Provide feedback to teachers and administrators All the information is presented in a clear cut manner Prevent over-reliance on Standardized Tests If all assessments are put into data, all assessments can be analyzed and not just the standardized testing Give schools the ability to respond to accountability questions “ What have you done to help this child?” “ How is your class performing in reading?”
12. Data-Driven Instruction With data-driven decisions, we are able to accurately pin point problems; identify students needing interventions and find solutions. We are able to make decisions mid-course to continually improve a child’s academic progress.
13. “ Databases help teachers to analyze relationships, look for trends, test and refine hypothesis, discover likenesses and differences, and arrange information in useful ways.” (W., & Puckett, 2009) A Database is an organized collection of data in digital form. Some Database Tools: Microsoft Excel Filemaker Pro Openoffice.org Data-Driven Instruction
14. Data-Driven Instruction The students took a Unit test on the United States government and their results were graded. Lessons 1 to 5 refers to the topics that the test questions were on. Their scores under each lesson is a percentage of how well they did on the questions asked of that topic. Test results were collected and put into an organized manner.
15. Data-Driven Instruction If a chart is created based on the class average on how well they did on each topic of the test, it can be seen that the students did not do as well with questions regarding Lesson 4 as they did on the other topics. This chart holds the class accountable and also the teacher. The teacher might have to re-teach that lesson if there is no outside reason why the students did poorly on that section.
16. Data-Driven Instruction Here is a student’s score compared to the class average. The student scored below average on each section of the test. This chart holds the student accountable and by having this chart show these results, teachers and administrators can decide on an intervention for the student whether it is continue to look over his progress or have him evaluated.