Download to read offline
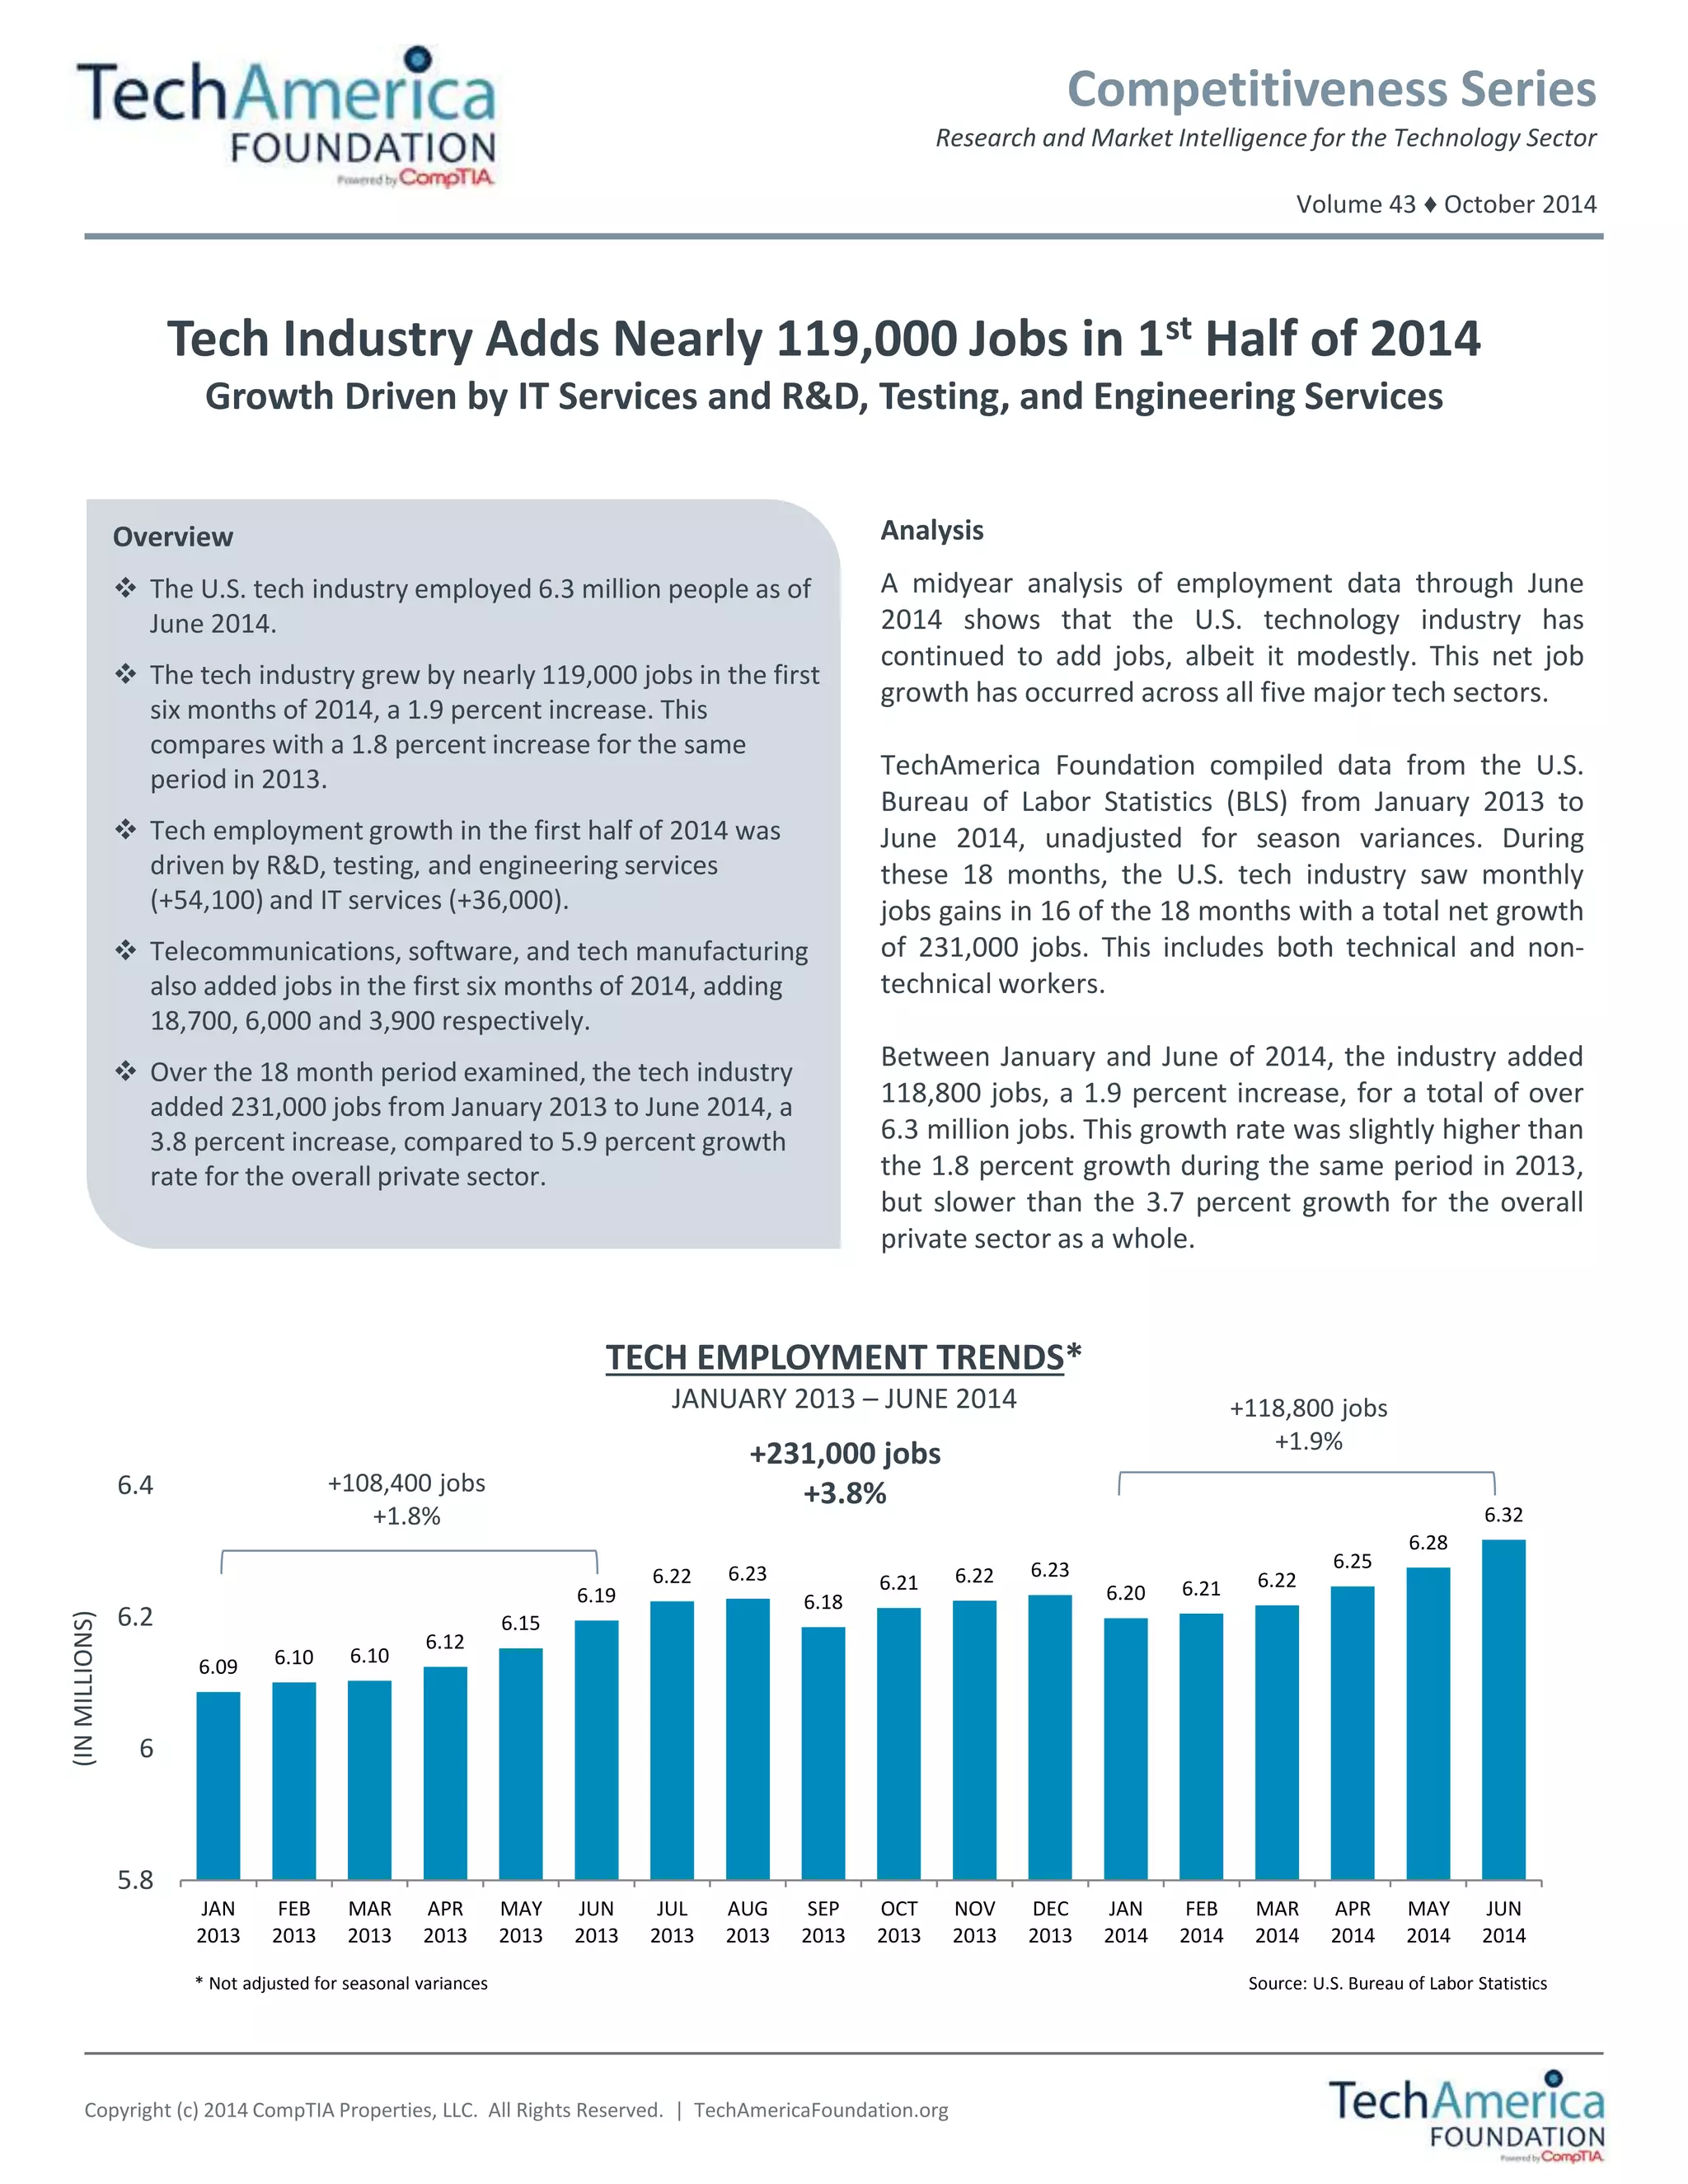
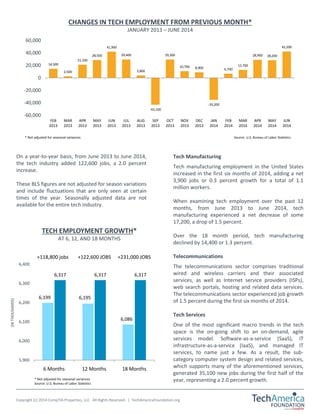
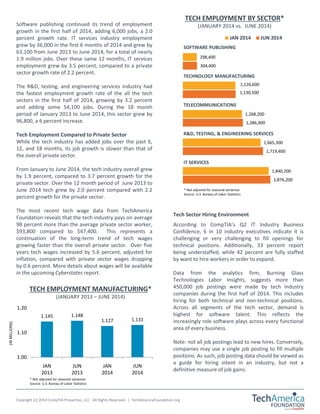
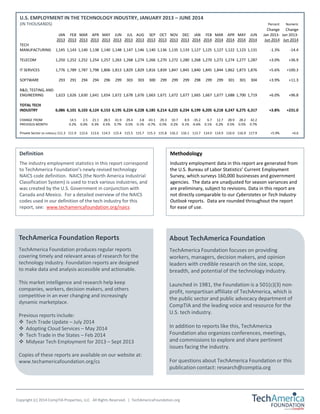

In the first half of 2014, the U.S. technology industry added nearly 119,000 jobs, resulting in a total of over 6.3 million employed within the sector. This growth, predominantly driven by R&D, testing, and engineering services (+54,100) and IT services (+36,000), represents a 1.9 percent increase compared to the same period in 2013. Over the 18 months from January 2013 to June 2014, the tech sector experienced a net gain of 231,000 jobs, although the growth rate was slower than that of the overall private sector.


