
CompTIA IT Employment Tracker – March 2020
•Download as PPTX, PDF•
0 likes•725 views

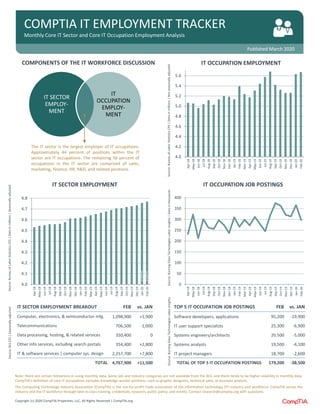
Monthly data, analysis, and trending covering the state of employment in the information technology (IT) sector and IT occupations. Released in conjunction with the U.S. Bureau of Labor Statistics monthly employment update. #JobsReport

Recommended
Recommended
More Related Content
What's hot
What's hot (20)
Similar to CompTIA IT Employment Tracker – March 2020
Similar to CompTIA IT Employment Tracker – March 2020 (12)
More from CompTIA
Recently uploaded
Recently uploaded (20)
CompTIA IT Employment Tracker – March 2020
- 1. 4.0 4.1 4.2 4.3 4.4 4.5 4.6 4.7 4.8 Apr-18 May-18 Jun-18 Jul-18 Aug-18 Sep-18 Oct-18 Nov-18 Dec-18 Jan-19 Feb-19 Mar-19 Apr-19 May-19 Jun-19 Jul-19 Aug-19 Sep-19 Oct-19 Nov-19 Dec-19 Jan-20 Feb-20 Note: there are certain limitations in using monthly data. Some job and industry categories are not available from the BLS, and there tends to be higher volatility in monthly data. CompTIA’s definition of core IT occupations excludes knowledge worker positions, such as graphic designers, technical sales, or business analysts. The Computing Technology Industry Association (CompTIA) is the not-for-profit trade association of the information technology (IT) industry and workforce. CompTIA serves the industry and the IT workforce through best-in-class training, credentials, research, public policy, and events. Contact research@comptia.org with questions. TOP 5 IT OCCUPATION JOB POSTINGS FEB vs. JAN Software developers, applications 95,200 -19,900 IT user support specialists 25,300 -6,900 Systems engineers/architects 20.500 -5,000 Systems analysts 19,500 -4,100 IT project managers 18,700 -2,600 TOTAL OF TOP 5 IT OCCUPATION POSTINGS 179,200 -38,500 COMPTIA IT EMPLOYMENT TRACKER Monthly Core IT Sector and Core IT Occupation Employment Analysis Published March 2020 IT SECTOR EMPLOY- MENT IT OCCUPATION EMPLOY- MENT The IT sector is the largest employer of IT occupations. Approximately 44 percent of positions within the IT sector are IT occupations. The remaining 56 percent of occupations in the IT sector are comprised of sales, marketing, finance, HR, R&D, and related positions. IT SECTOR EMPLOYMENT BREAKOUT FEB vs. JAN Computer, electronics, & semiconductor mfg. 1,098,900 +1,900 Telecommunications 706,500 -1,000 Data processing, hosting, & related services 350,400 0 Other info services, including search portals 354,400 +2,800 IT & software services | computer sys. design 2,257,700 +7,800 TOTAL 4,767,900 +11,500 IT SECTOR EMPLOYMENT IT OCCUPATION EMPLOYMENTCOMPONENTS OF THE IT WORKFORCE DISCUSSION IT OCCUPATION JOB POSTINGS Source:BurningGlassTechnologiesLaborInsights|DatainthousandsSource:BureauofLaborStatisticsCPS|Datainmillions|Notseasonallyadjusted Source:BureauofLaborStatisticsCES|Datainmillions|Seasonallyadjusted Copyright (c) 2020 CompTIA Properties, LLC, All Rights Reserved | CompTIA.org Source:BLSCES|Seasonallyadjusted Source:BurningGlassTechnologiesLaborInsights 4.0 4.2 4.4 4.6 4.8 5.0 5.2 5.4 5.6 Apr-18 May-18 Jun-18 Jul-18 Aug-18 Sep-18 Oct-18 Nov-18 Dec-18 Jan-19 Feb-19 Mar-19 Apr-19 May-19 Jun-19 Jul-19 Aug-19 Sep-19 Oct-19 Nov-19 Dec-19 Jan-20 Feb-20 projected projected 0 50 100 150 200 250 300 350 400 Apr-18 May-18 Jun-18 Jul-18 Aug-18 Sep-18 Oct-18 Nov-18 Dec-18 Jan-19 Feb-19 Mar-19 Apr-19 May-19 Jun-19 Jul-19 Aug-19 Sep-19 Oct-19 Nov-19 Dec-19 Jan-20 Feb-20
- 2. Copyright (c) 2020 CompTIA Properties, LLC, All Rights Reserved | CompTIA.org TOP STATES FOR IT JOB POSTINGS COUNT TOP 10 STATES FEB vs. JAN California 43,915 -13,296 Texas 27,691 -6,520 Virginia 15,896 -4,489 New York 15,623 -3,395 Florida 12,812 -4,151 Massachusetts 12,770 +2,079 North Carolina 12,558 -4,313 Illinois 12,102 -3,540 Georgia 10,417 -2,189 Pennsylvania 9,905 -2,816 STATE SUBTOTAL 173,689 -42,630 TOP STATES FOR IT JOB POSTINGS CHANGE TOP 10 STATES FEB vs. JAN Massachusetts 12,770 +2,079 New Hampshire 2,252 +1,210 Connecticut 3,612 +354 Rhode Island 1,521 +251 Alabama 2,627 +120 Maine 533 +97 Kansas 1,892 +48 Vermont 228 +1 South Dakota 254 -13 West Virginia 377 -14 STATE SUBTOTAL 26,066 +4,133 TOP METRO AREAS FOR IT JOB POSTINGS COUNT TOP 10 METRO AREAS FEB vs. JAN New York City 20,310 -4,335 Washington DC 18,801 -5,407 Dallas 13,651 -3,621 Los Angeles 12,993 -4,723 San Francisco 12,168 -2,819 Boston 11,435 +1,255 Chicago 10,834 -2,879 San Jose 8,942 -2,324 Atlanta 8,937 -2,187 Seattle 7,570 -1,474 125,641 -28,514 TOP METROS FOR IT JOB POSTINGS CHANGE TOP 10 METRO AREAS FEB vs. JAN Boston 11,435 +1,255 Worcester 533 +171 Providence 1,386 +163 Huntsville 1,162 +163 Hartford 1,814 +123 Richmond 2,419 +15 Birmingham 623 +15 Boise City 603 -77 Bridgeport 898 -89 Rochester 520 -92 METRO SUBTOTAL 21,393 +1,647 TOP EMPLOYERS FOR IT JOB POSTINGS COUNT TOP 10 U.S. EMPLOYERS FEB Deloitte 2,421 Anthem Blue Cross 2,320 Wells Fargo 2,213 IBM 2,201 PricewaterhouseCoopers 1,339 Northrop Grumman 1,255 Accenture 1,224 Lockheed Martin Corporation 1,169 Amazon 1,062 Stanley Black & Decker 909 TOP INDUSTRIES FOR IT JOB POSTINGS COUNT TOP 10 U.S. INDUSTRIES FEB Professional, Scientific, and Technical Services 51,278 Finance and Insurance 23,566 Manufacturing 20,581 Information 12,799 Administrative and Support 9,677 Health Care and Social Assistance 6,807 Public Administration 6,398 Retail Trade 5,485 Educational Services 5,483 Accommodation and Food Services 2,759 Source: CompTIA analysis of job posting data from Burning Glass Technologies Labor Insights | For metro area data, a minimum of 500 job postings used in analysis