The document presents a teaching case on constructing and utilizing a bar chart JavaBean component in an advanced information systems course. It emphasizes the importance of component-based development and outlines programming assignments that allow students to both build and apply this graphical component for data visualization. Additionally, it discusses the pedagogical benefits of hands-on experience in creating software components, enhancing students' understanding of event-driven architectures and graphical programming techniques.
![Teaching Case
Teaching Software Componentization:
A Bar Chart Java Bean
Michel Mitri
CIS & MS Department
James Madison University
Harrisonburg, VA 22801 USA
[email protected]
ABSTRACT
In the current object-oriented paradigm, software construction
increasingly involves creating and utilizing software
components. These components can serve a variety of functions,
from common algorithmic processes to database connectivity
to graphical interfaces. The advantage of component
architectures is that programmers can use pre-existing
components to
simplify their programming tasks and to facilitate rapid
application development. In the Java world, components are
implemented as Java Beans, which can be used in most
Integrated Development Environments (IDEs) to construct user
interface designs via form builders. This article describes a
programming assignment for an advanced information systems](https://image.slidesharecdn.com/teachingcaseteachingsoftwarecomponentization-221026055205-84330e1e/85/Teaching-Case-Teaching-Software-Componentization-docx-1-320.jpg)
![Teaching Case
Teaching Software Componentization:
A Bar Chart Java Bean
Michel Mitri
CIS & MS Department
James Madison University
Harrisonburg, VA 22801 USA
[email protected]
ABSTRACT
In the current object-oriented paradigm, software construction
increasingly involves creating and utilizing software
components. These components can serve a variety of functions,
from common algorithmic processes to database connectivity
to graphical interfaces. The advantage of component
architectures is that programmers can use pre-existing
components to
simplify their programming tasks and to facilitate rapid
application development. In the Java world, components are
implemented as Java Beans, which can be used in most
Integrated Development Environments (IDEs) to construct user
interface designs via form builders. This article describes a
programming assignment for an advanced information systems](https://image.slidesharecdn.com/teachingcaseteachingsoftwarecomponentization-221026055205-84330e1e/75/Teaching-Case-Teaching-Software-Componentization-docx-1-2048.jpg)
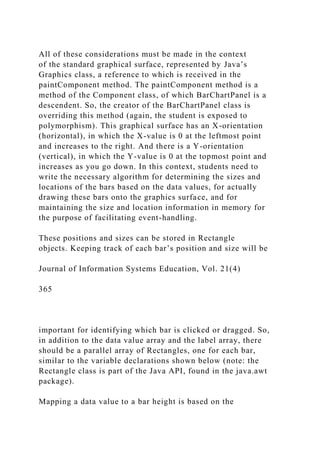
![7. REFERENCES
Cunningham C, Liu Y, Tadepalli P, and Fu M [2003],
Component Software: A New Software Engineering
Course, Journal of Computing Science in Colleges, 18:6,
pp10-21.
Howe E, Thornton M, and Weide B [2004], Components-
First Approaches to CS1/CS2: Principles and Practice,
SICGCSE ’04 Proceedings, March 3-7, 2004, Norfolk,
VA, pp291-295.
Java Platform Standard Edition 6 API Specification.
http://java.sun.com/javase/6/docs/api/javax/swing/package
-summary.html.
Liang, Y.D. Introduction to Java Programming:
Comprehensive Version. 7th Edition. © 2009. Pearson
Education, Inc.
Microsoft .NET Framework Class Library.
http://msdn.microsoft.com/en-
us/library/ms229335(v=VS.90).aspx
Mitri, Michel. [2008] “A Software Development Capstone
Course and Project for CIS Majors”. Journal of Computer
Information Systems. Vol 48 Nbr 3.
Ratchivadran, T. and Rothenberger, M. [2003], Software
Reuse Strategies and Component Markets,
Communications of the ACM, 46:8, pp109-114.
Wolz , U. and Koffman, E. simpleIO: a Java package for
novice interactive and graphics programming, ACM
SIGCSE Bulletin, v.31 n.3, p.212, Sept. 1999](https://image.slidesharecdn.com/teachingcaseteachingsoftwarecomponentization-221026055205-84330e1e/85/Teaching-Case-Teaching-Software-Componentization-docx-20-320.jpg)