Download as PDF, PPTX

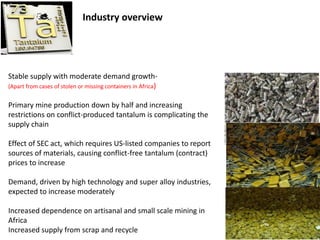

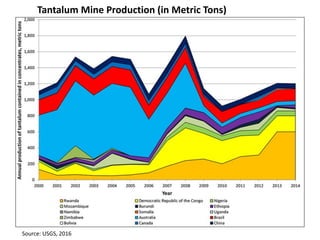

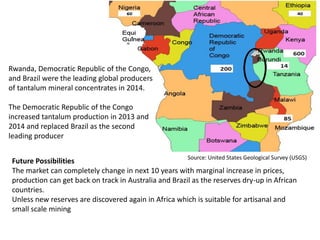
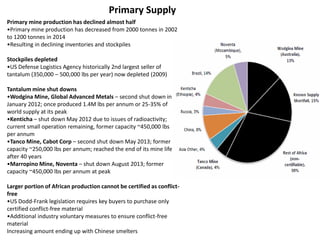
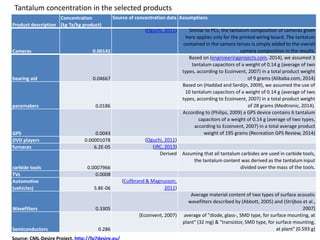
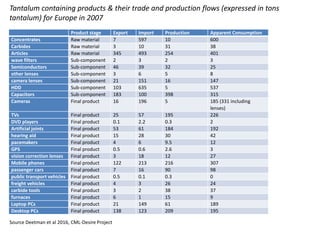
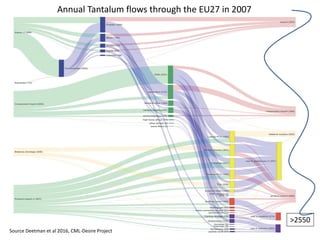
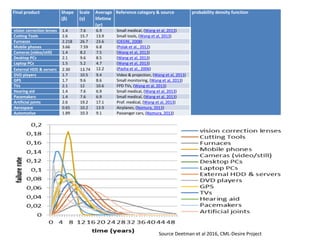
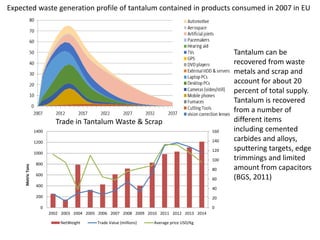
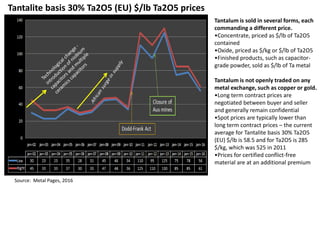
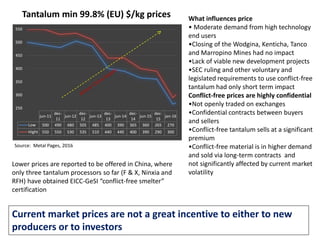
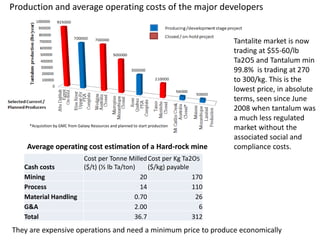
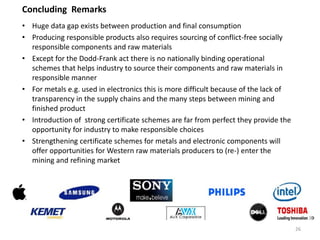


The document provides a comprehensive analysis of tantalum production, demand, and recyclability, highlighting a significant decline in primary mine production due to various factors, including geopolitical issues in Africa. It notes the increasing demand for tantalum from high-tech industries and a reliance on artisanal mining and recycling to meet future needs. Despite current challenges, global reserves are projected to be sufficient for the next 500 years, while the market dynamics could change due to evolving production conditions in Australia and Brazil.


