Download as PDF, PPTX

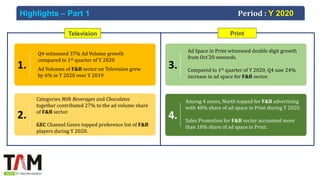
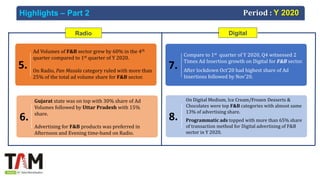
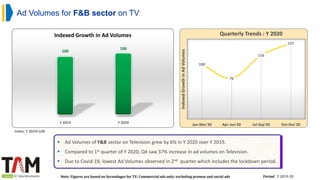
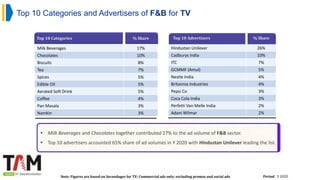
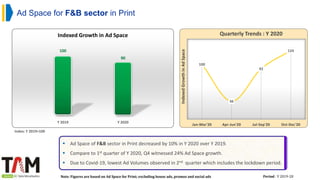
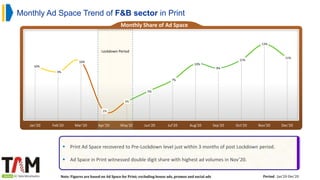
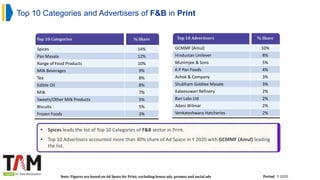
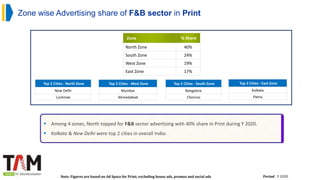
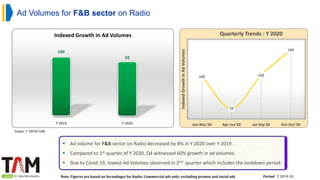
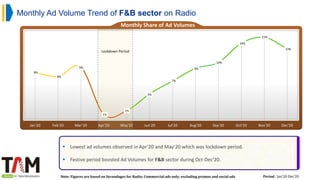
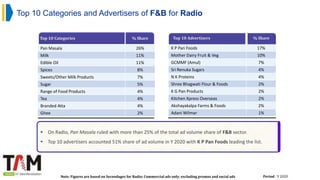
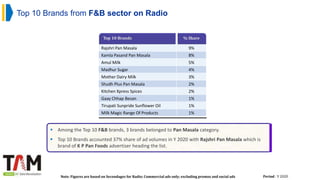
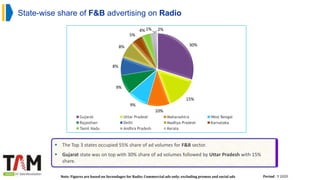
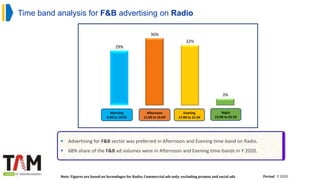
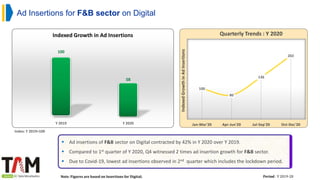
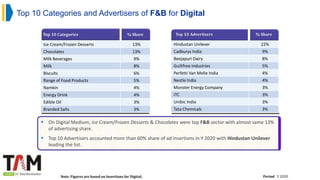


In 2020, the food and beverage (F&B) sector saw significant advertising growth, particularly in Q4, with television and digital ads growing by 6% and 60%, respectively, compared to Q1. The north zone dominated print advertising with a 40% share, while the pan masala category led radio advertising, capturing over 25% of total ad volume. Key advertisers included Hindustan Unilever and GCMMF (Amul), contributing significantly to the overall ad volumes across various media.


