Tabla 2
•
0 likes•57 views
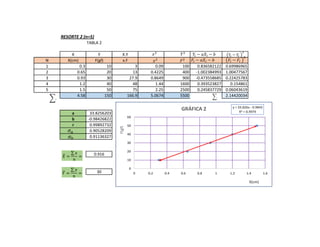
This document contains a table with 5 data points measuring X (in cm) and Y (in gf) values. It performs a linear regression analysis on the data, calculating the a and b coefficients as 33.8256203 and -0.98426822 respectively, with an R2 value of 0.9979, indicating a strong linear correlation between X and Y. A graph is included plotting the linear regression line y=33.826x-0.9843 against the data points.
Report
Share
Report
Share
Download to read offline
Recommended
mínimos cuadrados
1. The document contains data from an experiment measuring the period (T) of a simple pendulum with varying lengths (L). It includes the measured values for T and L, as well as calculated values including the standard deviation and correlation coefficient for the linear regression line of best fit.
2. The linear regression analysis calculated values for the slope (a = 5.722251) and y-intercept (b = -0.145448) of the line, with a high correlation coefficient (R^2 = 0.998976), indicating the period is directly proportional to the square root of the length.
3. Two graphs are shown, one plotting T vs the square root of L, fitting a linear
MÍNIMOS CUADRADOS
This document contains data from an experiment measuring the period of a pendulum with constant mass over five trials of increasing length. It includes the measured length, period, and calculated values of the square root of length versus period. A linear regression analysis was performed, finding an equation of y = 0.1744x + 0.027 with an R^2 value of 0.998, indicating a very strong linear correlation between the square root of length and period of the pendulum.
Cumeno diseño industrial
The document contains tables and calculations for heat exchanger design. It includes:
1) A net heat calculation of 478037 W.
2) A table with stream temperature and heat capacity rate data.
3) Calculations of temperature differences and heat transfer rates.
4) Identification of the pinch point temperature difference of -20359 W.
5) Grid and composite curves showing the heat exchanger design with streams A and C on the vertical axis and stream B on the horizontal axis.
Ejerciciooo3
This document analyzes the linear regression between hours worked (x) and units produced (y) at a workshop. It provides the correlation coefficient (0.953994158), scatter plot of the data, and calculations to determine the regression line equation and test for significance of the linear relationship. The t-statistic calculated (10.06071375) is greater than the critical value (2.228), indicating there is a statistically significant linear relationship between hours worked and units produced.
Cone morse[1]
This document contains specifications for different Morse taper sizes including taper angles and maximum dimensions for features A through K. The tapers range from size 0 to 7 with increasing dimensions and taper angles getting smaller as the size increases. Size 7 is the largest taper listed.
Chi squire test
1) This document provides a chi-square table for determining the critical value for rejecting the null hypothesis at different confidence levels and degrees of freedom.
2) The table lists the chi-square value for confidence levels from 99% to 0.1% and degrees of freedom ranging from 1 to 30.
3) If the calculated chi-square value is greater than the corresponding value in the table for a given confidence level and degrees of freedom, the null hypothesis can be rejected.
Orbital thrust problem of space aircraft
This document describes the calculations for determining the launch angle of a space shuttle. It involves:
1) Setting up a moment balance equation involving the forces and weights acting on the shuttle.
2) Solving the equation to determine the required launch angle is 8.82878 degrees.
3) Plotting the resultant moment over a range of angles from -5 to 5 radians to verify the solution.
4) Repeating the calculations to find the minimum payload requirement for a successful launch.
Mekucil data
The document contains 3 tables with 12 rows of data each. The tables include columns for variables X, Y, XY, and Z. X represents a number that increases by 1 each row from 0.7 to 10.6. Y and XY are calculated values that increase with X. Z is a calculated average that decreases with larger X and XY values in each table.
Luis miguel guepud ceballos
Este documento explica qué es RSS y cómo funciona. RSS permite que los usuarios se suscriban a fuentes de noticias en línea para recibir actualizaciones automáticamente sin tener que visitar los sitios individualmente. Explica que RSS funciona de manera similar al correo electrónico y describe tres formas de acceder a RSS: programas de escritorio, lectores en línea y a través del navegador o correo electrónico.
дипломная презентация по строительству
Все для дипломной презентации:
http://vakademe.ru/information/kak-sdelat-prezentatsiyu-k-diplomu.html
LCD Touchscreens
High resolution touchscreens with capacitve touch foils or ir optical touch frames. Wall mounted displays and touch walls.
Bosquejo
El documento define una máquina virtual como un programa informático que crea un entorno virtual entre el sistema operativo y el hardware para que el usuario pueda ejecutar aplicaciones de forma abstracta. Explica que existen diferentes tipos de virtualización como la de hardware, almacenamiento y máquinas virtuales. Finalmente, menciona brevemente las ventajas y desventajas de la virtualización.
Four Key Lessons in Improving Health Care Service Delivery - Personal observa...
Four Key Lessons in Improving Health Care Service Delivery - Personal observa...Health Informatics New Zealand
The document outlines four key lessons learned from the Health Roundtable experience in improving health care service delivery in New Zealand:
1. Deeper analysis is needed to uncover real performance differences between hospitals that are otherwise hidden, as casemix averages can hide big variations.
2. Financial incentives strongly influence practices and behaviors, as demonstrated by changes made in response to casemix payment systems.
3. Necessity drives innovation, as health systems have developed many strategies to address issues like bed shortages and growing elderly populations.
4. Peer discussions are valuable for sharing problems and innovations, and monitoring joint progress on key initiatives.Tecnología Médica: Sector Crítico de Desarrollo en México
Tecnología Médica: Sector Crítico de Desarrollo en MéxicoRed de Biomateriales e Ingeniería de Tejidos
Juan M. López, Ph.D., E.I.T.
Director, Graduate Biomedical Engineering
UPAEP Research and Graduate Programs
National Research Fellow, S.N.I. CONACyT
Chief Academic Officer, IIIEA, A.C.
Executive Committee, iideas http://iideas.org.mx/
Executive Committee, Red-BIT
Twitter: @iideas_mx, @DrJohnnyUPAEP
Facebook: https://goo.gl/aj6cZZ
juanmanuel.lopez@upaep.mx
An overview of the medical technology sector in Mexico and the incredible opportunities for development that surround this sector. The emerging market in Mexico is explored, comparing the opportunities in Mexico to the historical outcomes of other countries such as Korea.MAPEO DE LOS TIEMPOS DE RELAJACIÓN T2 EN TEJIDOS POR RESONANCIA MAGNÉTICA
MAPEO DE LOS TIEMPOS DE RELAJACIÓN T2 EN TEJIDOS POR RESONANCIA MAGNÉTICARed de Biomateriales e Ingeniería de Tejidos
El documento describe el mapeo de los tiempos de relajación T2 en tejidos mediante resonancia magnética. Explica cómo la resonancia magnética nuclear permite obtener imágenes médicas no invasivas mediante la medición de los tiempos de relajación T2. También describe cómo los mapas paramétricos T2 pueden usarse para visualizar diferentes regiones de tejidos y observar cambios en el tiempo, lo que los hace útiles como biomarcadores.World Co Ltd supply chain management
case study harvard business school about supply chain management
PowerPoint presentation on Three Questions
The king wanted to become a better ruler so he sought answers to three questions: when to begin a new venture, who to advise him, and what is most important to do. He offered rewards but was unsatisfied with the different answers. He asked a wise hermit digging in the ground. The hermit did not answer and the king helped him dig. They saw a wounded stranger who was the king's enemy but the king helped him and the man became his servant. The hermit told the king he already found the answers - that now is the important time, the person he is with is most important, and doing good for others is most important.
How to Build a Module in Odoo 17 Using the Scaffold Method
Odoo provides an option for creating a module by using a single line command. By using this command the user can make a whole structure of a module. It is very easy for a beginner to make a module. There is no need to make each file manually. This slide will show how to create a module using the scaffold method.
South African Journal of Science: Writing with integrity workshop (2024)
South African Journal of Science: Writing with integrity workshop (2024)Academy of Science of South Africa
A workshop hosted by the South African Journal of Science aimed at postgraduate students and early career researchers with little or no experience in writing and publishing journal articles.Introduction to AI for Nonprofits with Tapp Network
Dive into the world of AI! Experts Jon Hill and Tareq Monaur will guide you through AI's role in enhancing nonprofit websites and basic marketing strategies, making it easy to understand and apply.
A Strategic Approach: GenAI in Education
Artificial Intelligence (AI) technologies such as Generative AI, Image Generators and Large Language Models have had a dramatic impact on teaching, learning and assessment over the past 18 months. The most immediate threat AI posed was to Academic Integrity with Higher Education Institutes (HEIs) focusing their efforts on combating the use of GenAI in assessment. Guidelines were developed for staff and students, policies put in place too. Innovative educators have forged paths in the use of Generative AI for teaching, learning and assessments leading to pockets of transformation springing up across HEIs, often with little or no top-down guidance, support or direction.
This Gasta posits a strategic approach to integrating AI into HEIs to prepare staff, students and the curriculum for an evolving world and workplace. We will highlight the advantages of working with these technologies beyond the realm of teaching, learning and assessment by considering prompt engineering skills, industry impact, curriculum changes, and the need for staff upskilling. In contrast, not engaging strategically with Generative AI poses risks, including falling behind peers, missed opportunities and failing to ensure our graduates remain employable. The rapid evolution of AI technologies necessitates a proactive and strategic approach if we are to remain relevant.
More Related Content
Viewers also liked
Luis miguel guepud ceballos
Este documento explica qué es RSS y cómo funciona. RSS permite que los usuarios se suscriban a fuentes de noticias en línea para recibir actualizaciones automáticamente sin tener que visitar los sitios individualmente. Explica que RSS funciona de manera similar al correo electrónico y describe tres formas de acceder a RSS: programas de escritorio, lectores en línea y a través del navegador o correo electrónico.
дипломная презентация по строительству
Все для дипломной презентации:
http://vakademe.ru/information/kak-sdelat-prezentatsiyu-k-diplomu.html
LCD Touchscreens
High resolution touchscreens with capacitve touch foils or ir optical touch frames. Wall mounted displays and touch walls.
Bosquejo
El documento define una máquina virtual como un programa informático que crea un entorno virtual entre el sistema operativo y el hardware para que el usuario pueda ejecutar aplicaciones de forma abstracta. Explica que existen diferentes tipos de virtualización como la de hardware, almacenamiento y máquinas virtuales. Finalmente, menciona brevemente las ventajas y desventajas de la virtualización.
Four Key Lessons in Improving Health Care Service Delivery - Personal observa...
Four Key Lessons in Improving Health Care Service Delivery - Personal observa...Health Informatics New Zealand
The document outlines four key lessons learned from the Health Roundtable experience in improving health care service delivery in New Zealand:
1. Deeper analysis is needed to uncover real performance differences between hospitals that are otherwise hidden, as casemix averages can hide big variations.
2. Financial incentives strongly influence practices and behaviors, as demonstrated by changes made in response to casemix payment systems.
3. Necessity drives innovation, as health systems have developed many strategies to address issues like bed shortages and growing elderly populations.
4. Peer discussions are valuable for sharing problems and innovations, and monitoring joint progress on key initiatives.Tecnología Médica: Sector Crítico de Desarrollo en México
Tecnología Médica: Sector Crítico de Desarrollo en MéxicoRed de Biomateriales e Ingeniería de Tejidos
Juan M. López, Ph.D., E.I.T.
Director, Graduate Biomedical Engineering
UPAEP Research and Graduate Programs
National Research Fellow, S.N.I. CONACyT
Chief Academic Officer, IIIEA, A.C.
Executive Committee, iideas http://iideas.org.mx/
Executive Committee, Red-BIT
Twitter: @iideas_mx, @DrJohnnyUPAEP
Facebook: https://goo.gl/aj6cZZ
juanmanuel.lopez@upaep.mx
An overview of the medical technology sector in Mexico and the incredible opportunities for development that surround this sector. The emerging market in Mexico is explored, comparing the opportunities in Mexico to the historical outcomes of other countries such as Korea.MAPEO DE LOS TIEMPOS DE RELAJACIÓN T2 EN TEJIDOS POR RESONANCIA MAGNÉTICA
MAPEO DE LOS TIEMPOS DE RELAJACIÓN T2 EN TEJIDOS POR RESONANCIA MAGNÉTICARed de Biomateriales e Ingeniería de Tejidos
El documento describe el mapeo de los tiempos de relajación T2 en tejidos mediante resonancia magnética. Explica cómo la resonancia magnética nuclear permite obtener imágenes médicas no invasivas mediante la medición de los tiempos de relajación T2. También describe cómo los mapas paramétricos T2 pueden usarse para visualizar diferentes regiones de tejidos y observar cambios en el tiempo, lo que los hace útiles como biomarcadores.World Co Ltd supply chain management
case study harvard business school about supply chain management
PowerPoint presentation on Three Questions
The king wanted to become a better ruler so he sought answers to three questions: when to begin a new venture, who to advise him, and what is most important to do. He offered rewards but was unsatisfied with the different answers. He asked a wise hermit digging in the ground. The hermit did not answer and the king helped him dig. They saw a wounded stranger who was the king's enemy but the king helped him and the man became his servant. The hermit told the king he already found the answers - that now is the important time, the person he is with is most important, and doing good for others is most important.
Viewers also liked (17)
дипломная презентация по транспортному обслуживанию
дипломная презентация по транспортному обслуживанию
Авилон. Снижение взысканий по потреб. спорам 2015 вер2
Авилон. Снижение взысканий по потреб. спорам 2015 вер2
Four Key Lessons in Improving Health Care Service Delivery - Personal observa...
Four Key Lessons in Improving Health Care Service Delivery - Personal observa...
Tecnología Médica: Sector Crítico de Desarrollo en México
Tecnología Médica: Sector Crítico de Desarrollo en México
MAPEO DE LOS TIEMPOS DE RELAJACIÓN T2 EN TEJIDOS POR RESONANCIA MAGNÉTICA
MAPEO DE LOS TIEMPOS DE RELAJACIÓN T2 EN TEJIDOS POR RESONANCIA MAGNÉTICA
Recently uploaded
How to Build a Module in Odoo 17 Using the Scaffold Method
Odoo provides an option for creating a module by using a single line command. By using this command the user can make a whole structure of a module. It is very easy for a beginner to make a module. There is no need to make each file manually. This slide will show how to create a module using the scaffold method.
South African Journal of Science: Writing with integrity workshop (2024)
South African Journal of Science: Writing with integrity workshop (2024)Academy of Science of South Africa
A workshop hosted by the South African Journal of Science aimed at postgraduate students and early career researchers with little or no experience in writing and publishing journal articles.Introduction to AI for Nonprofits with Tapp Network
Dive into the world of AI! Experts Jon Hill and Tareq Monaur will guide you through AI's role in enhancing nonprofit websites and basic marketing strategies, making it easy to understand and apply.
A Strategic Approach: GenAI in Education
Artificial Intelligence (AI) technologies such as Generative AI, Image Generators and Large Language Models have had a dramatic impact on teaching, learning and assessment over the past 18 months. The most immediate threat AI posed was to Academic Integrity with Higher Education Institutes (HEIs) focusing their efforts on combating the use of GenAI in assessment. Guidelines were developed for staff and students, policies put in place too. Innovative educators have forged paths in the use of Generative AI for teaching, learning and assessments leading to pockets of transformation springing up across HEIs, often with little or no top-down guidance, support or direction.
This Gasta posits a strategic approach to integrating AI into HEIs to prepare staff, students and the curriculum for an evolving world and workplace. We will highlight the advantages of working with these technologies beyond the realm of teaching, learning and assessment by considering prompt engineering skills, industry impact, curriculum changes, and the need for staff upskilling. In contrast, not engaging strategically with Generative AI poses risks, including falling behind peers, missed opportunities and failing to ensure our graduates remain employable. The rapid evolution of AI technologies necessitates a proactive and strategic approach if we are to remain relevant.
A Survey of Techniques for Maximizing LLM Performance.pptx
A Survey of Techniques for Maximizing LLM Performance
ANATOMY AND BIOMECHANICS OF HIP JOINT.pdf
it describes the bony anatomy including the femoral head , acetabulum, labrum . also discusses the capsule , ligaments . muscle that act on the hip joint and the range of motion are outlined. factors affecting hip joint stability and weight transmission through the joint are summarized.
Digital Artifact 1 - 10VCD Environments Unit
Digital Artifact 1 - 10VCD Environments Unit - NGV Pavilion Concept Design
Main Java[All of the Base Concepts}.docx
This is part 1 of my Java Learning Journey. This Contains Custom methods, classes, constructors, packages, multithreading , try- catch block, finally block and more.
Executive Directors Chat Leveraging AI for Diversity, Equity, and Inclusion
Let’s explore the intersection of technology and equity in the final session of our DEI series. Discover how AI tools, like ChatGPT, can be used to support and enhance your nonprofit's DEI initiatives. Participants will gain insights into practical AI applications and get tips for leveraging technology to advance their DEI goals.
Advanced Java[Extra Concepts, Not Difficult].docx
This is part 2 of my Java Learning Journey. This contains Hashing, ArrayList, LinkedList, Date and Time Classes, Calendar Class and more.
Exploiting Artificial Intelligence for Empowering Researchers and Faculty, In...
Exploiting Artificial Intelligence for Empowering Researchers and Faculty, In...Dr. Vinod Kumar Kanvaria
Exploiting Artificial Intelligence for Empowering Researchers and Faculty,
International FDP on Fundamentals of Research in Social Sciences
at Integral University, Lucknow, 06.06.2024
By Dr. Vinod Kumar KanvariaThe History of Stoke Newington Street Names
Presented at the Stoke Newington Literary Festival on 9th June 2024
www.StokeNewingtonHistory.com
Recently uploaded (20)
How to Build a Module in Odoo 17 Using the Scaffold Method
How to Build a Module in Odoo 17 Using the Scaffold Method
South African Journal of Science: Writing with integrity workshop (2024)
South African Journal of Science: Writing with integrity workshop (2024)
Pride Month Slides 2024 David Douglas School District
Pride Month Slides 2024 David Douglas School District
Introduction to AI for Nonprofits with Tapp Network
Introduction to AI for Nonprofits with Tapp Network
A Survey of Techniques for Maximizing LLM Performance.pptx
A Survey of Techniques for Maximizing LLM Performance.pptx
Digital Artefact 1 - Tiny Home Environmental Design
Digital Artefact 1 - Tiny Home Environmental Design
Executive Directors Chat Leveraging AI for Diversity, Equity, and Inclusion
Executive Directors Chat Leveraging AI for Diversity, Equity, and Inclusion
Exploiting Artificial Intelligence for Empowering Researchers and Faculty, In...
Exploiting Artificial Intelligence for Empowering Researchers and Faculty, In...
Tabla 2
- 1. RESORTE 2 (n=5) TABLA 2 X Y X.Y N X(cm) F(gf) x.F 1 0.3 10 3 0.09 100 0.836582122 0.69986965 2 0.65 20 13 0.4225 400 -1.002384993 1.00477567 3 0.93 30 27.9 0.8649 900 -0.473558685 0.22425783 4 1.2 40 48 1.44 1600 0.393523827 0.154861 5 1.5 50 75 2.25 2500 0.245837729 0.06043619 4.58 150 166.9 5.0674 5500 2.14420034 a 33.8256203 b -0.98426822 r 0.99892732 0.90528209 0.91136327 33.8256203 -0.98426822 0.916 0.90528209 0.91136327 0.9978558 0.8454191 1396.12299 3 30 𝑥2 . 𝐹2 𝜎 𝑎 𝜎𝑏 𝐹𝑖 − 𝑎𝑋𝑖 − 𝑏 𝐹𝑖 − 𝐹𝑖 ´ 2 𝑥2 𝑌2 𝑌𝑖 − 𝑎𝑋𝑖 − 𝑏 𝑌𝑖 − 𝑌𝑖 ´ 2 . y = 33.826x - 0.9843 R² = 0.9979 0 10 20 30 40 50 60 0 0.2 0.4 0.6 0.8 1 1.2 1.4 1.6 F(gf) X(cm) GRÁFICA 2 𝑋 = 𝑥 𝑛 = 𝑌 = 𝑦 𝑛 =