Mekucil data
•Download as DOC, PDF•
0 likes•258 views

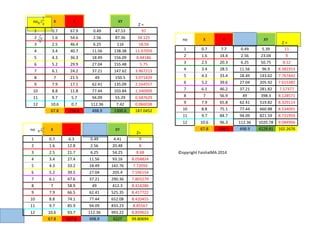
The document contains 3 tables with 12 rows of data each. The tables include columns for variables X, Y, XY, and Z. X represents a number that increases by 1 each row from 0.7 to 10.6. Y and XY are calculated values that increase with X. Z is a calculated average that decreases with larger X and XY values in each table.

More Related Content
What's hot
What's hot (20)
Similar to Mekucil data
Similar to Mekucil data (20)
Recently uploaded
Recently uploaded (20)
Mekucil data
- 1. no X Y XY Z = 1 0.7 67.9 0.49 47.53 97 2 1.6 54.6 2.56 87.36 34.125 3 2.5 46.4 6.25 116 18.56 4 3.4 40.7 11.56 138.38 11.97059 5 4.3 36.3 18.49 156.09 8.44186 6 5.2 29.9 27.04 155.48 5.75 7 6.1 24.2 37.21 147.62 3.967213 8 7 21.5 49 150.5 3.071429 9 7.9 17.1 62.41 135.09 2.164557 10 8.8 11.8 77.44 103.84 1.340909 11 9.7 5.7 94.09 55.29 0.587629 12 10.6 0.7 112.36 7.42 0.066038 67.8 356.8 498.9 1300.6 187.0452 no X Y XY Z= 1 0.7 6.3 0.49 4.41 9 2 1.6 12.8 2.56 20.48 8 3 2.5 21.7 6.25 54.25 8.68 4 3.4 27.4 11.56 93.16 8.058824 5 4.3 33.2 18.49 142.76 7.72093 6 5.2 39.5 27.04 205.4 7.596154 7 6.1 47.6 37.21 290.36 7.803279 8 7 58.9 49 412.3 8.414286 9 7.9 66.5 62.41 525.35 8.417722 10 8.8 74.1 77.44 652.08 8.420455 11 9.7 85.9 94.09 833.23 8.85567 12 10.6 93.7 112.36 993.22 8.839623 67.8 567.6 498.9 4227 99.80694 no X Y XY Z = 1 0.7 7.7 0.49 5.39 11 2 1.6 14.4 2.56 23.04 9 3 2.5 20.3 6.25 50.75 8.12 4 3.4 28.5 11.56 96.9 8.382353 5 4.3 33.4 18.49 143.62 7.767442 6 5.2 39.6 27.04 205.92 7.615385 7 6.1 46.2 37.21 281.82 7.57377 8 7 56.9 49 398.3 8.128571 9 7.9 65.8 62.41 519.82 8.329114 10 8.8 75.1 77.44 660.88 8.534091 11 9.7 84.7 94.09 821.59 8.731959 12 10.6 96.3 112.36 1020.78 9.084906 67.8 568.9 498.9 4228.81 102.2676 ©opyright FaishalMA 2014