Factsheet lion may 19-retail
•
0 likes•20 views

- The portfolio is a multi-strategy portfolio consisting of 5 different trading strategies, each with its own focus or approach, aiming to create diversification and reduce drawdowns while maintaining exposure to different market conditions. - The portfolio uses a proprietary predictive system and mathematical models to identify market swing points and trade currencies and indices with leverage, seeking absolute returns in all market conditions. - This type of investment is best suited for investors with a medium-high risk tolerance and short-medium investment horizon as the portfolio can experience short-term losses and fluctuations.

More Related Content
What's hot
What's hot (20)
Similar to Factsheet lion may 19-retail
Similar to Factsheet lion may 19-retail (12)
Recently uploaded
Recently uploaded (20)
Factsheet lion may 19-retail
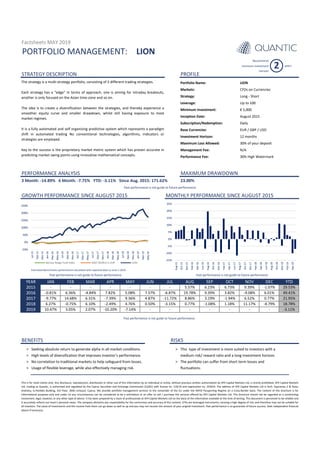
- 1. PORTFOLIO MANAGEMENT: PROFILE PERFORMANCE ANALYSIS MAXIMUM DRAWDOWN 3 Month: -14.89% 6 Month: -7.75% YTD: -3.11% Since Aug. 2015: 171.62% GROWTH PERFORMANCE SINCE AUGUST 2015 MONTHLY PERFORMANCE SINCE AUGUST 2015 BENEFITS RISKS > Seeking absolute return to generate alpha in all market conditions. > This type of investment is more suited to investors with a > High levels of diversification that improves investor’s performance. medium risk/ reward ratio and a long investment horizon. > No correlation to traditional markets to help safeguard from losses. > The portfolio can suffer from short term losses and > Usage of flexible leverage, while also effectively managing risk. fluctuations. LION Past performance is not guide to future performance The strategy is a multi-strategy portfolio, consisting of 5 different trading strategies. Each strategy has a “edge” in terms of approach, one is aiming for intraday breakouts, another is only focused on the Asian time-zone and so on. The idea is to create a diversification between the strategies, and thereby experience a smoother equity curve and smaller drawdown, whilst still having exposure to most market regimes. It is a fully automated and self organizing predictive system which represents a paradigm shift in automated trading No conventional technologies, algorithms, indicators or strategies are employed. Key to the success is the proprietary market metric system which has proven accurate in predicting market swing points using innovative mathematical concepts. NOV DEC 49.41% -1.07% 29.53%5.57% 6.23% STRATEGY DESCRIPTION JUNYEAR 2015 - - - - - JAN FEB MAR APR MAY OCT 2016 -0.81% 6.36% 2017 -9.77% 14.68% 6.31% -7.39% 9.36% 4.87% -11.72% 8.86% 3.19% -1.94% 6.52% 0.77% 21.95% - - This is for retail clients only. Any disclosure, reproduction, distribution or other use of this information by an individual or entity, without previous written authorization by AFX Capital Markets Ltd, is strictly prohibited. AFX Capital Markets Ltd, trading as Quantic, is authorized and regulated by the Cyprus Securities and Exchange Commission (CySEC) with license no. 119/10 and registration no. 253014. The address of AFX Capital Markets Ltd is Arch. Kyprianou 2 & Ayiou Andreou, G.Pavlides Building, 3rd Floor, 3036 Limassol, Cyprus. We provide portfolio management services to the remainder of the EU under the MiFID Passporting Regime on a Cross-Border basis. The content of this brochure is for informational purposes only and under no any circumstances can be considered to be a solicitation or an offer to sell / purchase the services offered by AFX Capital Markets Ltd. This brochure should not be regarded as a constituting investment, legal, taxation, or any other type of advice. It has been prepared by a team of professionals at AFX Capital Markets Ltd on the basis of the information available at the time of writing. This document is perceived to be reliable and it accurately reflects our team’s personal views. The company disclaims any responsibility for the correctness and accuracy of this content. CFDs are leveraged instruments, carrying a high degree of risk, and therefore may not be suitable for all investors. The value of investments and the income from them can go down as well as up and you may not recover the amount of your original investment. Past performance is no guarantee of future success. Seek independent financial advice if necessary. Past performance is not guide to future performance - - - - - - -- - - - - -4.84% 7.82% 5.08% 7.57% Investment Horizon: Maximum Loss Allowed: -6.87% - - JUL 23.00% Estimated Benchmarks performance calculated with reported data as June-1-2019 * Please note that as of June-10-2019 the Management fee will be changed from 2% to 1.5% and will be applied from thereon. 30% of your deposit N/A 30% High Watermark Management Fee: Performance Fee: 9.39%6.73% Past performance is not guide to future performance SEP Factsheets MAY 2019 6.27% -0.75% 6.10% -2.49% 4.76% 0.50% 10.47% 3.05% 2.07% -10.20% -7.14% - - Past performance is not guide to future performance - Base Currencies: - - - - - - -4.79% - - -2019 - - - - - - -3.15% 0.77% -1.08%2018 - 18.78% -3.11% - 1.18% 11.17% - - - - LION CFDs on Currencies Long - Short Up to 100 ₤ 5,000 EUR / GBP / USD Portfolio Name: Markets: Strategy: Leverage: Minimum Investment: Inception Date: Recommend minimum investment horizon 2 years - - - - - - - 19.78% 9.39% 3.82% -9.08% 6.01% YTD August 2015 Subscription/Redemption: Daily 12 months AUG - -15% -10% -5% 0% 5% 10% 15% 20% 25% Aug-15 Oct-15 Dec-15 Feb-16 Apr-16 Jun-16 Aug-16 Oct-16 Dec-16 Feb-17 Apr-17 Jun-17 Aug-17 Oct-17 Dec-17 Feb-18 Apr-18 Jun-18 Aug-18 Oct-18 Dec-18 Feb-19 Apr-19 Past performance is not guide to future performance -50% 0% 50% 100% 150% 200% 250% Jul-15 Sep-15 Nov-15 Jan-16 Mar-16 May-16 Jul-16 Sep-16 Nov-16 Jan-17 Mar-17 May-17 Jul-17 Sep-17 Nov-17 Jan-18 Mar-18 May-18 Jul-18 Sep-18 Nov-18 Jan-19 Mar-19 May-19 Barclay Hedge Fund Index MSCI WORLD in EUR LION
- 2. Market review & Performance contribution and portfolio changes Opportunities Risks Disclaimer Important information CFDs are leveraged instruments, carrying a high degree of risk, and therefore may not be suitable for all investors. The value of investments and the income from them can go down as well as up and you may not recover the amount of your original investment. Past performance is no guarantee of future success. Seek independent financial advice if necessary. The strategy was updated and utilized to investigate the possibility that market structure variables might improve the diversification/performance relationship. COMMENTS Please bear in mind that investing is not for everyone and the value of investments can fall as well as rise, so you might get back less than you invest. The direct investing service doesn’t give personal advice on investments. If you’re unsure, seek independent advice. Tax rules can change in future. Their effects on you will depend on your individual circumstances. Any views, opinions, estimates, forecasts, and statements of financial market trends that are based on current market conditions, constitute the judgement of the portfolio manager and are subject to change without notice. Any disclosure, reproduction, distribution or other use of this information by an individual or entity, without previous written authorization by AFX Capital Markets Ltd, is strictly prohibited. AFX Capital Markets Ltd, trading as Quantic, is authorized and regulated by the Cyprus Securities and Exchange Commission (CySEC) with license no. 119/10 and registration no. 253014. The address of AFX Capital Markets Ltd is Arch. Kyprianou 2 & Ayiou Andreou, G.Pavlides Building, 3rd Floor, 3036 Limassol, Cyprus. We provide portfolio management services to the remainder of the EU under the MiFID Passporting Regime on a Cross-Border basis. The content of this brochure is for informational purposes only and under no any circumstances can be considered to be a solicitation or an offer to sell / purchase the services offered by AFX Capital Markets Ltd. This brochure should not be regarded as a constituting investment, legal, taxation, or any other type of advice. It has been prepared by a team of professionals at AFX Capital Markets Ltd on the basis of the information available at the time of writing. This document is perceived to be reliable and it accurately reflects our team’s personal views. The company disclaims any responsibility for the correctness and accuracy of this content. This is for retail clients only. Any disclosure, reproduction, distribution or other use of this information by an individual or entity, without previous written authorization by AFX Capital Markets Ltd, is strictly prohibited. AFX Capital Markets Ltd, trading as Quantic, is authorized and regulated by the Cyprus Securities and Exchange Commission (CySEC) with license no. 119/10 and registration no. 253014. The address of AFX Capital Markets Ltd is Arch. Kyprianou 2 & Ayiou Andreou, G.Pavlides Building, 3rd Floor, 3036 Limassol, Cyprus. We provide portfolio management services to the remainder of the EU under the MiFID Passporting Regime on a Cross-Border basis. The content of this brochure is for informational purposes only and under no any circumstances can be considered to be a solicitation or an offer to sell / purchase the services offered by AFX Capital Markets Ltd. This brochure should not be regarded as a constituting investment, legal, taxation, or any other type of advice. It has been prepared by a team of professionals at AFX Capital Markets Ltd on the basis of the information available at the time of writing. This document is perceived to be reliable and it accurately reflects our team’s personal views. The company disclaims any responsibility for the correctness and accuracy of this content. CFDs are leveraged instruments, carrying a high degree of risk, and therefore may not be suitable for all investors. The value of investments and the income from them can go down as well as up and you may not recover the amount of your original investment. Past performance is no guarantee of future success. Seek independent financial advice if necessary. - This type of investment is more suited to investors with a medium/high degree of risk and a short to medium investment horizon. - The portfolio can suffer from short term losses and fluctuations. The investment strategies invest in derivatives, which are subject to the risks of their underlying markets or underlying instruments as well as issuer risks and often involve higher risks than direct investments. All forms of investment, which we may undertake on your behalf, involve risk. The value of investment and the income derived from them is not guaranteed and it can fall as well as rise. For detailed explanation of the key risks, please refer to key risk warnings document, available upon request from info@afxgroup.com A highly qualified and experienced management actively manages the accounts on the basis of a fundamental valuation approach. The objective is to identify the potential investments that, in the Investment manager’s opinion, are most attractive and to generate interesting and profitable opportunities for investors. The managed accounts invest in currencies and in indices in a broadly diversified manner and seeks opportunities for returns wherever they exist. Factsheets MAY 2019
- 3. RISKS: LEGAL INFORMATION Past performance is not a guide to future performance. All forms of investment, which we may undertake on your behalf, involve risk. The value of your investment and income from it is not guaranteed and may fall of rise. Due leveraged nature of the derivates in the portfolio, the effect of leverage is that a small price movement can cause both gains and losses to be magnified. Contract for Differences (CFDs) are complex financial instrument. A “complex financial instrument” is a high-risk investment, places your capital at risk of loss and requires knowledge and understanding of the underlying risks of the involved. The portfolio is exposed to the following key risks: liquidity risk, equity risk, credit risk, volatility risk, market risk, concentration risk, counterparty risk and inflation risk. For further details please read the more detailed risks section below. CFDs are leveraged instruments, carrying a high degree of risk, and therefore may not be suitable for all investors. The value of investments and the income from them can go down as well as up and you may not recover the amount of your original investment. Past performance is no guarantee of future success. Seek independent financial advice if necessary. Liquidity risk is the risk stemming from the lack of marketability of an investment that cannot be bought or sold quickly enough to prevent or minimize a loss. With liquidity risk, typically reflected in unusually wide bid-ask spreads or large price movements. Exchange risk, also called FX risk or currency risk, is the financial risk of an investment's value changing due to the changes in currency exchange rates. This also refers to the risk an investor faces when he needs to close out a long or short position in a foreign currency at a loss, due to an adverse movement in exchange rates. Volatility risk is the risk of a change of price of a portfolio as a result of changes in the volatility of a risk factor. It can either be measured by using the standard deviation or variance between returns from that same security or market index. Commonly, the higher the volatility, the riskier the security. Equity risk is the risk that the value of a derivative’s underlying equity instrument becomes worthless as the company becomes bankrupt. Credit risk is the risk of an issuer defaulting and being unable to repay the principal investment or financial gain. Market risk is the risk that the value of an individual investment or portfolio will fall as a result of a fall in markets. Concentration risk is the risk that there is an insufficient level of diversification such that an investor is excessively exposed to one or a limited number of investment. Counterparty risk is the risk that a party connected to an investment or transaction is unable to meet its commitment. The weekend effect is a phenomenon in financial markets in which stock returns on Mondays are often significantly lower than those of the immediately preceding Friday. Some theories that explain the effect attribute the tendency for companies to release bad news on Friday after the markets close to depressed stock prices on Monday. Others state that the weekend effect might be linked to short selling, which would affect stocks with high short interest positions. Alternatively, the effect could simply be a result of traders' fading optimism between Friday and Monday. Leverage is an investment strategy. Companies and investors can use leverage to finance their assets. The control of systemic risk requires controlling leverage. Leveraging enables gains and losses to be multiplied. On the other hand, there is a risk that leveraging will result in a loss. A margin call is a broker's demand on an investor using margin to deposit additional money or securities so that the margin account is brought up to the minimum maintenance margin. An investor receives a margin call from a broker if one or more of the securities he had bought with borrowed money decreases in value past a certain point. The investor must either deposit more money in the account or sell off some of his assets. Factsheets MAY 2019 Any investment objective or target will be treated as a target only and should not be considered as assurance or guarantee of performance of the Portfolio or any part of it. This is for retail clients only. Any disclosure, reproduction, distribution or other use of this information by an individual or entity, without previous written authorization by AFX Capital Markets Ltd, is strictly prohibited. AFX Capital Markets Ltd, trading as Quantic, is authorized and regulated by the Cyprus Securities and Exchange Commission (CySEC) with license no. 119/10 and registration no. 253014. The address of AFX Capital Markets Ltd is Arch. Kyprianou 2 & Ayiou Andreou, G.Pavlides Building, 3rd Floor, 3036 Limassol, Cyprus. We provide portfolio management services to the remainder of the EU under the MiFID Passporting Regime on a Cross-Border basis. The content of this brochure is for informational purposes only and under no any circumstances can be considered to be a solicitation or an offer to sell / purchase the services offered by AFX Capital Markets Ltd. This brochure should not be regarded as a constituting investment, legal, taxation, or any other type of advice. It has been prepared by a team of professionals at AFX Capital Markets Ltd on the basis of the information available at the time of writing. This document is perceived to be reliable and it accurately reflects our team’s personal views. The company disclaims any responsibility for the correctness and accuracy of this content. CFDs are leveraged instruments, carrying a high degree of risk, and therefore may not be suitable for all investors. The value of investments and the income from them can go down as well as up and you may not recover the amount of your original investment. Past performance is no guarantee of future success. Seek independent financial advice if necessary.
- 4. GLOSSARY Factsheets MAY 2019 This is for retail clients only. Any disclosure, reproduction, distribution or other use of this information by an individual or entity, without previous written authorization by AFX Capital Markets Ltd, is strictly prohibited. AFX Capital Markets Ltd, trading as Quantic, is authorized and regulated by the Cyprus Securities and Exchange Commission (CySEC) with license no. 119/10 and registration no. 253014. The address of AFX Capital Markets Ltd is Arch. Kyprianou 2 & Ayiou Andreou, G.Pavlides Building, 3rd Floor, 3036 Limassol, Cyprus. We provide portfolio management services to the remainder of the EU under the MiFID Passporting Regime on a Cross-Border basis. The content of this brochure is for informational purposes only and under no any circumstances can be considered to be a solicitation or an offer to sell / purchase the services offered by AFX Capital Markets Ltd. This brochure should not be regarded as a constituting investment, legal, taxation, or any other type of advice. It has been prepared by a team of professionals at AFX Capital Markets Ltd on the basis of the information available at the time of writing. This document is perceived to be reliable and it accurately reflects our team’s personal views. The company disclaims any responsibility for the correctness and accuracy of this content. CFDs are leveraged instruments, carrying a high degree of risk, and therefore may not be suitable for all investors. The value of investments and the income from them can go down as well as up and you may not recover the amount of your original investment. Past performance is no guarantee of future success. Seek independent financial advice if necessary. BONDS: A bond is a debt investment in which an investor loans money to an entity (typically corporate or governmental) which borrows the funds for a defined period of time at a variable or fixed interest rate. Bonds are used by companies, municipalities, states and sovereign governments to raise money and finance a variety of projects and activities. Owners of bonds are debt-holders, or creditors, of the issuer. CFD: A contract for differences (CFD) is an arrangement made in a futures contract whereby differences in settlement are made through cash payments, rather than by the delivery of physical goods or securities. It is a tradable contract between a client and a broker, who are exchanging the difference in the current value of a share, currency, commodity or index and its value at the contract’s end. CFDs provide investors with the all benefits and risks of owning a security without actually owning it. COMMODITIES: A commodity is a basic good used in commerce that is interchangeable with other commodities of the same type; commodities are most often used as inputs in the production of other goods or services. The quality of a given commodity may differ slightly, but it is essentially uniform across producers. When they are traded on an exchange, commodities must also meet specified minimum standards, also known as a basis grade. On our platform, you can trade: Oil, Gold, Silver, Palladium, Corn, Wheat, Soybean; Sugar Cocoa, Coffee, Cotton. CURRENCIES: Currency is a generally accepted form of money, including coins and paper notes, which is issued by a government and circulated within an economy. Used as a medium of exchange for goods and services, currency is the basis for trade. HMW: A high-water mark is the highest peak in value that an investment fund or account has reached. This term is often used in the context of fund manager compensation, which is performance-based. The high-water mark ensures the manager does not get paid large sums for poor performance. INDICES: An index is an indicator, In the case of financial markets, stock and bond market indices consist of a hypothetical portfolio of securities representing a particular market or a segment of it. (You cannot invest directly in an index.) However, to assess how the index has changed from the previous day, investors must look at the amount the index has fallen, often expressed as a percentage. The Standard & Poor’s 500 is one of the world’s best known indices. LEVERAGE: The concept of leverage is used by both investors and companies. Investors use leverage to significantly increase the returns that can be provided on an investment. They lever their investments by using various instruments that include options, futures, and margin accounts. Companies and investors can use leverage to finance their assets. The control of systemic risk requires controlling leverage. Leveraging enables gains and losses to be multiplied. On the other hand, there is a risk that leveraging will result in a loss. LONG POSITION: A long (or long position) is the buying of a security such as a stock, commodity or currency with the expectation the asset will rise in value. MARKET ORDERS: An investor makes a market order through a broker or brokerage service to buy or sell an in-vestment such as currencies, commodities, bond, share and indices, immediately at the best available current price. A market order guarantees execution, and it often has low commissions due to the minimal work brokers need to do. PERFORMANCE FEE: A performance fee is a payment made to a fund manager for generating positive returns. The performance fee is generally calculated as a percentage of investment profits, often both realized and unrealized. It is largely a feature of the hedge fund industry, where performance fees have made many hedge fund managers among the wealthiest people in the world. MANAGEMENT FEE: A management fee is a charge levied by an investment manager for managing an investment fund. The management fee is intended to compensate the managers for their time and expertise for selecting stocks and managing the portfolio. It can also include other items such as investor relations expenses and the administration costs of the fund. SHARES: Shares are units of ownership interest in a corporation or financial asset that provide for an equal distribution in any profits, in the form of dividends. The two main types of shares are common shares and preferred shares. Physical paper stock certificates have been replaced with electronic recording of stock shares. SHORT POSITION: A short, or short position, is a directional trading or investment strategy where the investor sells shares of borrowed stock in the open market. The expectation of the investor is that the price of the stock will de-crease over time, at which point the he will purchase it. VOLATILITY: The greater the volatility, the greater the risk. Volatility is a statistical measure of the dispersion of returns for a given security or market index. Volatility can either be measured by using the standard deviation or variance between returns from that same security or market index. Volatility, as expressed as a percentage coefficient refers to the amount of uncertainty or risk about the size of changes in a security's value. A higher volatility means that a security's value can potentially be spread out over a larger range of values. This means that the price of the security can change dramatically over a short time period in either direction.