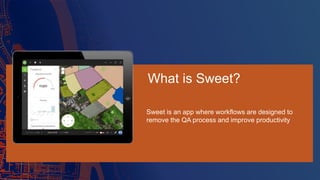
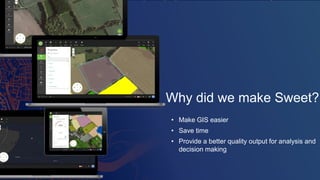
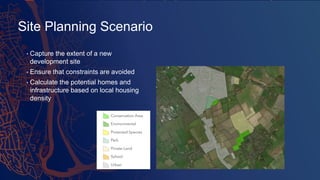
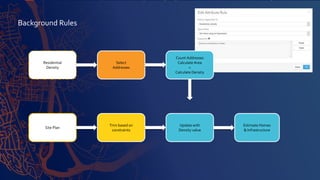
Sweet is an app built on the ArcGIS platform by Esri UK to streamline workflows and improve productivity by removing manual quality assurance steps. It allows users to design workflows that capture site data, analyze constraints, and calculate development potential or insurance exposure. Sweet saves time over traditional GIS processes, provides higher quality outputs for analysis and decision making, and aims to make GIS easier to use.
Arcadis - Improving Ground Engineering Data Flows - Smart Infrastructure - AC18Esri UK
As part of the digital engineering solution for Lower Thames Crossing a targeted three-step process has been developed to collect, manage and validate ground information for dissemination across the project. Join this session to understand how Arcadis are using the ArcGIS platform to provide a system of engagement across the project from data capture in the field to dissemination of relevant information to all stakeholders.
Get Further by Being Mobile – A Look at Advanced Mobile Techniques in the Arc...Esri UK
Ever wondered if you are getting the most out of mobile in your organisation? In this session learn how ArcGIS apps help to plan, co-ordinate and complete field workflows and discover what’s coming next.
I Didn't Know You Could Do That -Technical - AC18Esri UK
From learning how to create imaginative and attractive pop-ups through to securing public facing data, this session will dive into some of the more nuanced details of the ArcGIS Platform that you may not have been previously aware of, all of which have the potential to improve your GIS experience.
Visual Analysis With Insights and Operations Dashboard - Analytical Insights ...Esri UK
This presentation covers two of our new web-based analytics products: Insights is a data driven workbench for explorative analysis techniques, while Operations Dashboard offers a configurable console for monitoring and visualising real-time activities and performance indicators. Visit us to learn how to discover the spatial and tabular patterns in your datasets, and present your findings in a series of interactive and engaging dashboards.
Switching Your Teaching to ArcGIS Pro - Smart Education - Higher - AC18Esri UK
ArcGIS Pro is the new kid on the block in terms of desktop applications from Esri. It is fast becoming the industry standard, replacing ArcMap. Should you be thinking about swapping over to teaching you students ArcGIS Pro? We would say yes! It will future proof your courses and ensure that graduates are as employable as possible. In this session we will look at some of the main reasons we think you should start thinking about switching your teaching to ArcGIS Pro and will provide some handy resources to make the transition as smooth as it can be.
Break on Through (To The Java(Script) Side) - Smart Development - Esri UK Ann...Esri UK
In June 2016, Esri retired the ArcGIS API for Flex. This presentation aims to demonstrate the many benefits of migrating existing Flex applications to JavaScript, utilising the full suite of well-documented online resources and additional training options available from Esri. These have enabled Intertek to undertake this transition seamlessly and taking advantage of enhanced features provided by using JavaScript.
Staging the Enterprise on ArcGIS OnlineMichael Olkin
The Town of Amherst, MA, a leader in the use of Geographic Information Systems (GIS) technology, uses Esri's ArcGIS Online platform as a means to provide mobile and online access to a wealth of resources.
Creative Ways to Leverage Operational DataCartegraph
The seamless integration between Cartegraph OMS and ArcGIS fuels high-performance organizations with powerful spatial data and flexible workflows. Our Cartegraph + GIS expert share ideas for maps and apps that will help your team work smarter and provide a new level of transparency to your citizens.
Provides an overview of how Putnam County, TN and the City of Cookeville partnered to share resources an collaborate on data maintenance in order to grow their respective GIS programs. Presented at the 2013 Esri Southeast User Conference in Jacksonville, FL.
Basemap data is often an afterthought in utility GIS implementations. Parcels, streets, and imagery from multiple jurisdictions are stacked at the bottom of the layer list in desktop and web apps, leaving users with an assortment of inconsistent cartography and data attributes to sort through. Esri provides tools through the Local and State Government Solution Centers that create a framework for building and maintaining a consistent, seamless landbase that is easier to use and that provides more meaningful context for utility applications.
Introduction to ArcGIS Developer Tools - Smart Development - Esri UK Annual C...Esri UK
It's been an exciting year for ArcGIS developers with some great new capabilities available to us! This introduction session is all about giving you the knowledge you need to get the best out of our developer tools. We'll take you through all our APIs and SDKs and discuss how you can use them to write powerful GIS apps.
Our road to microservices - or how we learned to love async eventsThomas Bøgh Fangel
A presentation of Lunar Way’s journey of breaking up our Rails monolith into a scalable microservice based architecture with a special focus on the benefits we have gained from letting go of the secureness of synchronous RPC and instead use asynchronous event-based messaging.
How a Global Healthcare Company Built a Migration Factory to Quickly Move Tho...Amazon Web Services
Setting a goal for your teams to move a large number of workloads to AWS in a short period of time can be a great way to motivate teams to migrate quickly. Cardinal Health created a migration factory composed of teams, tools, and processes that streamlined the movement of workloads from on-premises to AWS. In this session, hear from Cardinal Health about how they used a migration factory to successfully move thousands of applications to the AWS Cloud. In addition, learn best practices for creating an effective migration platform and process in your organization.
Opening the Outage Door: Integrating OMS into CISSSP Innovations
Tri-County Electric Co-Op breaks the OMS data barrier by integrating their existing ATS OpenOne CIS system with Schneider Electric’s Responder OMS. CSR’s now have the ability to: retrieve past outage information for the customer account; input new outage calls on behalf of the customer; and retrieve real-time outage information for existing outages. Customers are now able to enter outages from web and mobile technologies. SSP Innovations bridged the gap with a Multispeak-based web service.
leveraging the power of the Cloud for building sustainable GIS solutions. you can easily adding the location advantage to your business workflows with different Cloud GIS offerings.
ArcGIS - A Platform for Developers & StartupsEsri Ireland
Presentation created and delivered by Eamonn Doyle, the Chief Technology Officer for Esri Ireland.
The ArcGIS Platform is constantly evolving to meet the needs of startups and developers. In a world where the need for geoanalytics is being driven by the ever increasing amounts of data from sensor networks, IoT device and mobile apps, developers need a rich API's and comprehensive IaaS and PaaS foundation on which to build their apps.
At the same time startups in the location intelligence space need a set of functionality to help make sense of spatio-temporal data from Big Data sources.
ArcGIS is the complete mapping and analytics platform that offers all of the above. Check out this slide deck to learn about the Esri Startup and Developer programs - what is included in them and how you can sign up.
AWS Summit Singapore - Focus on your Business with Predictive Analytics, Cont...Amazon Web Services
Phoon Woh Shon, Senior Solutions Architect, RedHat
As existing workloads evolve and deployments grow in size and complexity, managing them is a key challenge. Learn how Red Hat Insights proactively identifies configuration and security risks before business operations are affected. In this session, we will also learn how developers and operators are embracing Linux containers and Kubernetes with OpenShift. OpenShift is well positioned to manage the complexity of Machine Learning and democratize access to these techniques. OpenShift will even allow you to deploy AWS services from within Red Hat OpenShift Container Platform both on-premises and in the cloud.
This session provides an overview of how organizations can migrate workloads to the AWS cloud at scale. We will go through available migration frameworks and best practices with common use case examples during this session. After migrating the initial workloads, understand how to migrate at scale to the AWS cloud. Hear about real life experiences from the AWS Professional Services team and learn about common use case examples, frameworks, and best practices. Hear about what to avoid when migrating applications at scale to AWS and understand the tools and partner services that can assist you when migrating applications to AWS.
This keynote will help you understand the current state of cloud adoption, identify the business value for your organization, and provide you a framework to plot your course to cloud adoption.
The Modern Database for Enterprise ApplicationsQAware GmbH
Gregor Bauer, Couchbase & QAware Meetup, 02.02.23
Couchbase and Kubernetes: a powerful data management duo
Gregor explains how to escape the common struggles of cloud deployments by leveraging cloud portability across platforms and providers. Here, the Couchbase Autonomous Operator for Kubernetes enables cloud portability and automates operational best practices for deploying and managing the Couchbase Data Platform.
The following key features will be presented:
Native integration with Kubernetes Operator which provides a data platform with rich query support, mobile, analytics, and full-text search functionality out of the box.
Easily deploy Couchbase within a managed private cloud or public cloud, which offers maximum flexibility, customizability, and performance.
AWS Summit 2013 | Auckland - Building Web Scale Applications with AWSAmazon Web Services
AWS provides a platform that is ideally suited for deploying highly available and reliable systems that can scale with a minimal amount of human interaction. This talk describes a set of architectural patterns that support highly available services that are also scalable, low cost, low latency and allow for agile development practices. We walk through the various architectural decisions taken for each tier and explain our choices for appropriate AWS services and building blocks to ensure the security, scale, availability and reliability of the application.
Look Before You Leap: Migrating On-Premises Hadoop to AWSDevOps.com
Lack of agility, excessive costs, and administrative overhead are convincing on-premises Spark and Hadoop customers to migrate to cloud native services on AWS. As you’re migrating these applications to the cloud, Unravel helps ensure you won’t be flying blind.
Solving sustainability challenges with geospatial informationEsri UK
An understanding of location is vital for helping both organisations and governments to reach their sustainability goals. Indeed, geospatial data plays a pivotal role in everything from planning renewable energy policies and rolling out infrastructure for electric cars nationwide, to enhancing the natural capital around an office building or improving waste collection at a business park. This presentation will reveal how Ordnance Survey uses innovation to help its customers see a sustainable place. Learn about a series of ground-breaking propositions that blend geospatial and earth observation technologies to solve some of the world’s most complex sustainability challenges.
Streamlining the design and operation of infrastructure in WalesEsri UK
Streamlining the design and operation of infrastructure in Wales is both an imperative issue and a challenging undertaking, particularly when responding to the climate crisis and budgetary constraints in the Welsh context. The cost of digitisation and varying levels of digital knowledge amongst professionals often impede efforts to streamline processes. ‘Going digital’ with purchases of data, systems and training can be a hurdle for many infrastructure projects, particularly for smaller ones where digitalisation capex can be prohibitively high. See a Welsh example from AtkinsRéalis that provides a workable and highly successful demonstrator of how projects can benefit from a shared GIS model, providing rapid collaboration against a design deadline of climate change.
Ecological monitoring in Wales: data capture in the ERAMMP field surveyEsri UK
As part of the Welsh Government’s Environment and Rural Affairs Monitoring and Modelling Programme (ERAMMP), the UK Centre for Ecology and Hydrology (UKCEH) is re-surveying soil, plants, insects, birds, water and landscape features at 300 distinct 1 km2 sample sites, dispersed across the whole of Wales. This large-scale, four-year project is being undertaken by thirty seven specialist surveyors, who use a suite of ArcGIS apps to view and capture data in the field. Learn how UKCEH has configured different ArcGIS apps to accurately monitor changes to trees and woodlands, geo-reference 4,500 soil samples and record around 1,200 plant species.
Planning a brighter future with a GIS of the WorldEsri UK
With the rise of data and more organisations becoming aware of GIS, we are now starting to understand and see the world as one system. This session explores how Esri UK are building a ‘Living Atlas of the World’ and how a GIS of the World can transform your data management, enable collaboration, and help you gain valuable insights to plan for a brighter future.
Slow Ways is a grassroots initiative to create a national network of walking routes that connect all of Great Britain's towns and cities. Kick-started in 2020 and catalysed by lockdowns, the Slow Ways walking network is being created by thousands of volunteers from across the country. Join this session to learn about this big vision for walking and how the Slow Ways team are using GIS and geospatial thinking to bring it to life. You'll also discover how you can help bring this big idea to life where you live.
Bringing ArcGIS spatial analysis to bear on IoT dataEsri UK
IoT is changing the way we manage key systems and plan our future, generating ever more digital data. This session explores the new capabilities in ArcGIS that are making it easier to apply the power of spatial analysis to IoT data. Whether you need to ask questions of real time feeds or draw insight from ever larger big data sets, there are tools to help.
How climate data can help address the climate challengeEsri UK
Climate change has already altered the weather we experience and the magnitude of impacts from extreme temperatures and rainfall. These impacts manifest locally and can cause human causalities and damage to infrastructure and natural systems. In future, some further climate change is now inevitable, but the rate and magnitude of change will depend on global greenhouse gas emissions. New data and tools to use the data are available to help plot a path through the climate and weather challenges, enabling organisations at all scales to adapt to the changing conditions.
Adam Branscomb ventures to the cutting edge of ArcGIS. Over the course of 30 minutes, he explores how, by faithfully recreating our world, we can make better-informed decisions on the challenges of today and tomorrow.
Using Jupyter Notebooks - Developers Forum - AC18Esri UK
The ArcGIS API for Python is not only great for administering your Web GIS, it's also amazing for performing exploratory analysis of your data using Jupyter Notebooks. In this session, we will learn how to do just this!
All About Angular and ArcGIS - Developers Forum - AC18Esri UK
Angular is a hugely popular web application framework based on TypeScript. This session will take you through how to get started working with Angular and ArcGIS to create highly capable and interactive apps.
What's New in the Javascript API - Developers Forum - AC18Esri UK
A lot can happen in a year! Our development teams have been hard at work to bring you some amazing new features and help you take your apps to the next level. This rapid fire session will cover the latest and greatest updates in our ArcGIS API for JavaScript, as well as a look at what's coming soon.
GIS Under the Radar - Smart Education - Higher - AC18Esri UK
GIS is an ideal vehicle for meeting the changing expectations of students in Higher Education. Opportunities to introduce GIS to students outside of the formal, taught GIS curriculum, however, often go unrecognised, or are missed. Michael Horswell, from the University of the West of England, will consider the barriers to, and opportunities for, implementing GIS under the radar in HE curricula, as well as the considerable benefits that such an approach presents to students.
Knowing Your Place - Smart Education - Schools - AC18Esri UK
Discover how to use Community Analyst to create and explore detailed local data for anywhere in the UK and over 100 other countries. A unique resource for GCSE, NEA and A level teaching.
TACP - Cycling Jersey with ArcGIS - Analytical Insights - Esri UK Annual Conf...Esri UK
The States of Jersey are targeting a 100 % increase in commuting by bicycle - a goal made more challenging by a road network with little capacity for change. Having sourced two years of cycling data from Strava, totalling over 50 million records across the island, the States of Jersey are working with TACP (UK) Ltd to better understand existing active travel demands and where potential improvements to provision can be made. This project highlights the power of ArcGIS Pro and Model Builder for analysing large volumes of data, along with the ease at which users can quickly publish to ArcGIS Online and create easy-to-use web apps.
TfL - How GIS is Helping to Deliver Healthy Streets for Londoners - Enterpris...Esri UK
London is facing an inactivity crisis and the shift to a more sedentary lifestyle is now one of the biggest threats to our health. With the need to design physical activity back into our everyday lives, join Henry and Joe to find out how TfL use GIS to support ‘The Healthy Streets Approach.’ You will see how the city planner tool is used to analyse a vast library of spatial data to help inform investment decisions in our walking, cycling and public transport infrastructure to transform London and improve the lives of everyone who lives in, works in and visits this great city.
Highways England - Improved Road Scheme Planning - Smart Infrastructure - Esr...Esri UK
Insight into strategic planning across the road network enables disruption to be minimised, risks to the workforce to be reduced and delivers cost savings. Join this session to understand how Highway’s England are using the ArcGIS Platform to analyse road schemes both geographically and temporally and are now exploring how to share the information more widely to councils and other transport organisations.
Mott MacDonald - BIM and the Environment - Smart Infrastructure - Esri UK Ann...Esri UK
Environment work on large infrastructure projects can align with the BIM strategy and GIS has a significant role to play. Join this session to understand how Mott MacDonald are digitising environmental assessments using GIS so that the valuable data collected can be used effectively in decision support for projects across the business.
JMeter webinar - integration with InfluxDB and GrafanaRTTS
Watch this recorded webinar about real-time monitoring of application performance. See how to integrate Apache JMeter, the open-source leader in performance testing, with InfluxDB, the open-source time-series database, and Grafana, the open-source analytics and visualization application.
In this webinar, we will review the benefits of leveraging InfluxDB and Grafana when executing load tests and demonstrate how these tools are used to visualize performance metrics.
Length: 30 minutes
Session Overview
-------------------------------------------
During this webinar, we will cover the following topics while demonstrating the integrations of JMeter, InfluxDB and Grafana:
- What out-of-the-box solutions are available for real-time monitoring JMeter tests?
- What are the benefits of integrating InfluxDB and Grafana into the load testing stack?
- Which features are provided by Grafana?
- Demonstration of InfluxDB and Grafana using a practice web application
To view the webinar recording, go to:
https://www.rttsweb.com/jmeter-integration-webinar
Generating a custom Ruby SDK for your web service or Rails API using Smithyg2nightmarescribd
Have you ever wanted a Ruby client API to communicate with your web service? Smithy is a protocol-agnostic language for defining services and SDKs. Smithy Ruby is an implementation of Smithy that generates a Ruby SDK using a Smithy model. In this talk, we will explore Smithy and Smithy Ruby to learn how to generate custom feature-rich SDKs that can communicate with any web service, such as a Rails JSON API.
UiPath Test Automation using UiPath Test Suite series, part 3DianaGray10
Welcome to UiPath Test Automation using UiPath Test Suite series part 3. In this session, we will cover desktop automation along with UI automation.
Topics covered:
UI automation Introduction,
UI automation Sample
Desktop automation flow
Pradeep Chinnala, Senior Consultant Automation Developer @WonderBotz and UiPath MVP
Deepak Rai, Automation Practice Lead, Boundaryless Group and UiPath MVP
Key Trends Shaping the Future of Infrastructure.pdfCheryl Hung
Keynote at DIGIT West Expo, Glasgow on 29 May 2024.
Cheryl Hung, ochery.com
Sr Director, Infrastructure Ecosystem, Arm.
The key trends across hardware, cloud and open-source; exploring how these areas are likely to mature and develop over the short and long-term, and then considering how organisations can position themselves to adapt and thrive.
GDG Cloud Southlake #33: Boule & Rebala: Effective AppSec in SDLC using Deplo...James Anderson
Effective Application Security in Software Delivery lifecycle using Deployment Firewall and DBOM
The modern software delivery process (or the CI/CD process) includes many tools, distributed teams, open-source code, and cloud platforms. Constant focus on speed to release software to market, along with the traditional slow and manual security checks has caused gaps in continuous security as an important piece in the software supply chain. Today organizations feel more susceptible to external and internal cyber threats due to the vast attack surface in their applications supply chain and the lack of end-to-end governance and risk management.
The software team must secure its software delivery process to avoid vulnerability and security breaches. This needs to be achieved with existing tool chains and without extensive rework of the delivery processes. This talk will present strategies and techniques for providing visibility into the true risk of the existing vulnerabilities, preventing the introduction of security issues in the software, resolving vulnerabilities in production environments quickly, and capturing the deployment bill of materials (DBOM).
Speakers:
Bob Boule
Robert Boule is a technology enthusiast with PASSION for technology and making things work along with a knack for helping others understand how things work. He comes with around 20 years of solution engineering experience in application security, software continuous delivery, and SaaS platforms. He is known for his dynamic presentations in CI/CD and application security integrated in software delivery lifecycle.
Gopinath Rebala
Gopinath Rebala is the CTO of OpsMx, where he has overall responsibility for the machine learning and data processing architectures for Secure Software Delivery. Gopi also has a strong connection with our customers, leading design and architecture for strategic implementations. Gopi is a frequent speaker and well-known leader in continuous delivery and integrating security into software delivery.
UiPath Test Automation using UiPath Test Suite series, part 4DianaGray10
Welcome to UiPath Test Automation using UiPath Test Suite series part 4. In this session, we will cover Test Manager overview along with SAP heatmap.
The UiPath Test Manager overview with SAP heatmap webinar offers a concise yet comprehensive exploration of the role of a Test Manager within SAP environments, coupled with the utilization of heatmaps for effective testing strategies.
Participants will gain insights into the responsibilities, challenges, and best practices associated with test management in SAP projects. Additionally, the webinar delves into the significance of heatmaps as a visual aid for identifying testing priorities, areas of risk, and resource allocation within SAP landscapes. Through this session, attendees can expect to enhance their understanding of test management principles while learning practical approaches to optimize testing processes in SAP environments using heatmap visualization techniques
What will you get from this session?
1. Insights into SAP testing best practices
2. Heatmap utilization for testing
3. Optimization of testing processes
4. Demo
Topics covered:
Execution from the test manager
Orchestrator execution result
Defect reporting
SAP heatmap example with demo
Speaker:
Deepak Rai, Automation Practice Lead, Boundaryless Group and UiPath MVP
GraphRAG is All You need? LLM & Knowledge GraphGuy Korland
Guy Korland, CEO and Co-founder of FalkorDB, will review two articles on the integration of language models with knowledge graphs.
1. Unifying Large Language Models and Knowledge Graphs: A Roadmap.
https://arxiv.org/abs/2306.08302
2. Microsoft Research's GraphRAG paper and a review paper on various uses of knowledge graphs:
https://www.microsoft.com/en-us/research/blog/graphrag-unlocking-llm-discovery-on-narrative-private-data/
The Art of the Pitch: WordPress Relationships and SalesLaura Byrne
Clients don’t know what they don’t know. What web solutions are right for them? How does WordPress come into the picture? How do you make sure you understand scope and timeline? What do you do if sometime changes?
All these questions and more will be explored as we talk about matching clients’ needs with what your agency offers without pulling teeth or pulling your hair out. Practical tips, and strategies for successful relationship building that leads to closing the deal.
Epistemic Interaction - tuning interfaces to provide information for AI supportAlan Dix
Paper presented at SYNERGY workshop at AVI 2024, Genoa, Italy. 3rd June 2024
https://alandix.com/academic/papers/synergy2024-epistemic/
As machine learning integrates deeper into human-computer interactions, the concept of epistemic interaction emerges, aiming to refine these interactions to enhance system adaptability. This approach encourages minor, intentional adjustments in user behaviour to enrich the data available for system learning. This paper introduces epistemic interaction within the context of human-system communication, illustrating how deliberate interaction design can improve system understanding and adaptation. Through concrete examples, we demonstrate the potential of epistemic interaction to significantly advance human-computer interaction by leveraging intuitive human communication strategies to inform system design and functionality, offering a novel pathway for enriching user-system engagements.
Kubernetes & AI - Beauty and the Beast !?! @KCD Istanbul 2024Tobias Schneck
As AI technology is pushing into IT I was wondering myself, as an “infrastructure container kubernetes guy”, how get this fancy AI technology get managed from an infrastructure operational view? Is it possible to apply our lovely cloud native principals as well? What benefit’s both technologies could bring to each other?
Let me take this questions and provide you a short journey through existing deployment models and use cases for AI software. On practical examples, we discuss what cloud/on-premise strategy we may need for applying it to our own infrastructure to get it to work from an enterprise perspective. I want to give an overview about infrastructure requirements and technologies, what could be beneficial or limiting your AI use cases in an enterprise environment. An interactive Demo will give you some insides, what approaches I got already working for real.
1. Esri UK Scottish Conference 2018
Sweet
Sarah Saint-Ruth & Emma Sandison
2. What is Sweet?
Sweet is an app where workflows are designed to
remove the QA process and improve productivity
3. • An Esri UK Product built on the ArcGIS Platform
• Uses ArcGIS Portal/Online, User Model and Services
• App Builder creates instances of Sweet
Web Application
Builder
Desktop
Operations
DashboardSweet
Collector
Marketplace
AppsPortal
4. Why did we make Sweet?
• Save time
• Provide a better quality output for analysis and
decision making
• Make GIS easier
5. Site Planning Scenario
• Capture the extent of a new
development site
• Ensure that constraints are avoided
• Calculate the potential homes and
infrastructure based on local housing
density
Sarah’s shown spatial feedback and calculations while designing a new site. This next example focuses on attribute feedback and calculation in a business context….
Site Planning Scenario
This site planning scenario is inspired by a talk that Homes England delivered at our annual conference in May.
I’d like to create a site plan for a new housing development. It’s important that I avoid the constraints, such as conservation areas, private land or existing urban build – I can include any useful open data layers from the local council, SNH and other organisations. I’d also like to get a feel for the housing potential of the site. To stay in keeping with the local environment I’d like to maintain a similar housing density to the area nearby.
Demo
The interface in this example is stripped back to just cover the necessary functions. Specifically, I only really need to switch basemaps, pan around the map or create new features.
Create urban density poly - First, I’ll digitise a sample training area to assess the existing housing density.
Properties - Sweet reviews the chosen area telling me the area size, number of homes and density.
This value will be used for the new site plan I’ll now create…
Create site plan poly - I don’t need to worry about causing overlaps into constraint areas because when I’ve finished digitising, Sweet will resolve these for me.
Dynamic Feedback helps me make decisions and modify my digitising while editing, and whilst I could use this to create my site without the topology rules, it would definitely take me longer.
Properties - Opening the properties of this new site, I can see an estimate of the number of homes as well as our related infrastructure.
Subtract using poly - If I need to add or subtract from the site that is very easy…. The properties pane will also dynamically update.
So it’s much easier for users to create valid sites because of the rules we have behind the scenes.
I started off creating a residential density area – that’s used to select addresses and calculate the density using the count of addresses and the area.
Attribute rule – using an expression to create that new attribute variable for me on-the-fly
Next, I created the site plan and Sweet dynamically trimmed the site plan based on the constraints in the area to ensure I’m not encroaching into them. It’s then using the precalculated residential density value to estimate the number of homes that could be built and the likely infrastructure that would be required to support them.
In this example Sweet is providing an easy to use editing environment that’s helping keep my data clean, while also calculating a variety of key metrics to help me understand the potential of the new housing site.
This type of workflow would also be good for a Phase One habitat survey. Sweet can be used offline so I can take my laptop or tablet into the field to capture data while onsite.
Insurance demo
Here I have an Insurance workflow built for users with no GIS experience. It shows how Sweet can help simplify complex calculations for users who probably don’t even know they’re using GIS.
As an Insurance Call Centre worker, I’d like an application that helps me quickly assess customer enquiries regarding property insurance. I’d like to understand the accumulative risk in the area, the flood risk and our exposure to bomb damage.
Ultimately, I need to know if I can insure a property or not. Determining this needs information that’s inherently spatial, but Sweet hides all the background processing from me.
Demo
The interface is even more striped back than in the Site Planning app.
Find - Distaff Lane, London – I can search for an address
Create - then add a point to the map on the building of interest.
Sweet’s working away in the background, creating some buffers and highlighting the properties that my company already insures in this area.
Properties – I quickly find out if I can insure a property at this location. The properties panel also details the insurance risk. The accumulation helps us understand the insured value of other properties in the area. I also see an assessment of the potential bomb damage risk, as well as information on flood risk.
Accumulation – bit more detail on the other nearby properties we insure
The bomb blast tab provides more detailed information on the potential risk at set distances from this address. Chart – can see there’s quite a lot of exposure at 400m
Reports - Finally we’re able to generate a report that condenses all that info down to the key stats for future reference.
Click on One New Change - If I reselect a new location in the shopping centre to the East of St Pauls we’ll see that the accumulation in that area is far too high for us to take on new customers.
In this example Sweet is generating a variety of key metrics to help me understand the risk at any given location. I’m able to quickly respond to customer enquiries and safe guard my business from high accumulation or flood risk.