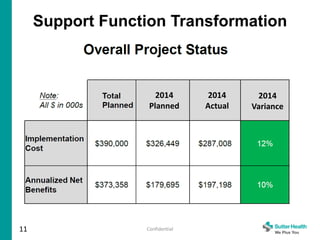
2200 River Plaza Drive
Sacramento, CA 95833
June 9, 2015
The following information for Sutter Health and Affiliates (the “Presentation”) will be shared by Sutter
Health’s President and Chief Operating Officer, Sarah Krevans, along with Jeff Sprague, Senior Vice
President and Chief Financial Officer of Sutter Health, and Don Wreden, M.D., Senior Vice President,
Patient Experience of Sutter Health at the Citi Non-Profit Health Care Investor Conference on June 11 and
12, 2015, in New York City.
The filing of this information does not constitute or imply any representation (i) that all of the information
provided herein is material to investors, (ii) regarding any other financial, operating or other information
about Sutter Health, the Obligated Group Members or any related bonds (the “Bonds”), (iii) that no
changes, circumstances or events have occurred since the end of the fiscal year to which this information
relates, or any other date specified with respect to any of the information contained in the following, or that
no other information exists, which may have a bearing on the security for the Bonds, or an investor’s
decision to buy, sell, or hold the Bonds or (iv) that Sutter Health is obligated to, or plans to, update or
revise the information that is presented. The information has been obtained from sources which are
believed to be reliable, but such information is not guaranteed as to accuracy or completeness. No
statement in the following information should be construed as a prediction or representation about future
financial performance of Sutter Health or any Obligated Group Member.
Should you have questions, please contact the Sutter Health Finance support staff at (916) 286-6557.
{00678639 v.1}
Sixteenth Annual Not-for-Profit
Health Care Investor Conference
Sutter Health
June, 2015
Unless otherwise noted, the financial information related to fiscal year
2014 contained in this presentation has been obtained from Sutter
Health Audited Financial Statements
Certain statements in this presentation constitute “forward-looking
statements.” Such statements generally are identifiable by the terminology used,
such as “plan,” “expect,” “estimate,” “budget” or other similar words. The
achievement of certain results or other expectations contained in such forward-
looking statements involve known and unknown risks, uncertainties and other
factors, some of which are beyond Sutter Health’s control, that may cause actual
results, performance or achievements described to be materially different from any
future results, performance or achievements expressed or implied by such forward-
looking statements. You are cautioned not to place undue reliance on forward-
looking statements that reflect management's view only as of the date of this
presentation or as of such earlier date as indicated. All forward-looking statements
included in this presentation and all subsequent forward-looking statements
attributable to Sutter Health or persons acting on Sutter Health’s behalf are
expressly qualified in their entirety by these cautionary statements. The information
contained in this presentation speaks only as of the date stated, or if no date is
stated, as of the date of this presentation. Sutter Health is not under any obligations
and does not intend to issue any updates or revisions to those forward-looking
statements if, or when, its expectations or events, conditions or circumstances on
which such statements are based occur or fail to occur, except as required by law.
2
Caution regarding forward-looking statements
Sarah Krevans
President & Chief Operating Officer
Sutter Health
Sutter is nationally significant
Broad Reach
Largest contiguous not-for-profit health system in the US
Diverse Patients
100+ languages
Serving some of the richest and poorest areas in the nation
National Health Impact
1 in 100 Americans receives care at Sutter
Economic Contributor
Among the largest US employers
Community impact
$3M of charity care provided every week
Sutter Health system snapshot (2014)
5
Bay Area
Operating
Unit
Valley Area
Operating
Unit
Physicians (members of Sutter Medical
Network)
5,000
Network and affiliate employees 49,381
Licensed acute care beds 4,321
2014 by Numbers
Births 35,463
Discharges 190,054
Outpatient visits 11,121,733
Operations of most Sutter Health affiliates recently
consolidated from five regions into two distinct Northern
California geographic operating units. It is anticipated that
the legal consolidation of these Sutter Health affiliates will
be complete by Fiscal Year ending 2017
Sutter Health Facts at a Glance
*Not shown on map:
- Sutter Coast Hospital (Crescent City, CA)
- Kahi Mohala Behavioral Health Hospital (Ewa Beach, HI)
Confidential6
$(100)
$-
$100
$200
$300
$400
$500
$600
2012 2013 2014
Strong 2014 Financial Performance
Business Segments
• Acute Hospital
– Focusing on high quality, affordable care
• Medical Foundations
– Focusing on growth, affordable care
• Other Providers Growing Rapidly
– Sutter Care at Home
– Ambulatory Surgery Center Joint Ventures
– System Lab
• Additional Diversification Investments
7 Confidential
One Sutter
Focus on continued operational excellence
Focus on the market, and enhance our
presence
Focus on the holistic patient experience
Focus on the future – innovation and
growth
9 Confidential
10
Support Function Transformation
Project Summary
Confidential
Confidential
Support Function Transformation
Twelve Months Ending December 2014
11
2014
Planned
2014
Actual
2014
Variance
Sutter Research Enterprise
R
S
Hospital
Ambulatory
Surgery Center
R
Sutter
Rehabilitation
Institute
Care Center
Valley Area Snapshot (2014)
 12 Counties
 Population: 4.4M
 Square Miles: 13,800
 Med Group Physicians: 1,040
 Independent Physicians: 864
 Foundation Patient Visits: 5.4M
 Employees: 17k
 Acute Facilities: 11
 ASCs: 13
 Licensed Beds: 1,855+
 Inpatient Discharges: 87k
 Care Centers: 107
 Gross Patient Rev: $11,737M
 Net Operating Rev: $3,819M
 Operating Expense: $3,559M
 Operating Income: $260M
 EBITDA: $457M
Operations of most Sutter Health
affiliates recently consolidated from
five regions into two distinct
Northern California geographic
operating units. It is anticipated that
the legal consolidation of these
Sutter Health affiliates will be
complete by Fiscal Year ending 2017
Bay Area Snaphot (2014)
 Counties: 8
 Population: 7.2M
 Square Miles: 5,781
 Med Group Physicians: 1,921
 Independent Physicians: 1,704
 Foundation Patient Visits: 5.5M
 Employees: 19,927
 Acute Facilities: 16
 ASCs: 16
 Licensed Beds: 2,250+
 Inpatient Discharges: 101K
 Care Centers: 147
 Gross Patient Rev: $14,920M
 Net Operating Rev: $5,856M
 Operating Expense: $5,497M
 Operating Income: $359M
 EBITDA: $751M
S
Bay Area
Hospital
Ambulatory
Surgery Center
Care Center
Outreach
Center
Operations of most Sutter Health
affiliates recently consolidated from
five regions into two distinct
Northern California geographic
operating units. It is anticipated that
the legal consolidation of these
Sutter Health affiliates will be
complete by Fiscal Year ending 2017
15
One Sutter Team Success
Confidential
End
of Life
Complex Case
Management
Acute Case Management
Chronic Disease Management
Wellness Management
16
…Celebrating AIM
(Advanced Illness Management)
Within 90 days of entering the program, AIM patients experience:
56% reduction in hospital stays
19% reduction in ER visits
59% reduction in time spent in ICU
Jeff Sprague
Sr. Vice President and Chief Financial Officer
Sutter Health
Revenue Diversification
19
2013 2014
Confidential
Hospital
Inpatient
39%
Hospital
Outpatient
20%
Medical
Foundations
28%
Joint Ventures
2%
SPS
1%
Home Health
2%
Investment
Income
3%
RetirementPlans
5%
Hospital
Inpatient
40%
Hospital
Outpatient
21%
Medical
Foundations
32%
Joint Ventures
3%
SPS
2%
Home Health
2%
Investment
Income
0% RetirementPlans
0%
Medical Foundations, Joint Ventures and Sutter Physician Services
represent 37% of revenues in 2014, up from 31% in the previous year
Cash Flow Diversification
20
2013 2014
Confidential
($100)
$0
$100
$200
$300
$400
$500
$600
$700
$800
$900
$1,000
Hospitals Medical
Foundations
Surgicenters Health Plan Other Ops Investment
Income
Retirement
Plans
Diversified portfolio of non correlated assets supports expectation of a steady source
of cash flow to continue to invest in transformation, EHR and retirement plans
21
Liquidity Remains Strong
Confidential
0
20
40
60
80
100
120
140
160
180
200
220
$0
$500
$1,000
$1,500
$2,000
$2,500
$3,000
$3,500
$4,000
$4,500
$5,000
$5,500
2005 2006 2007 2008 2009 2010 2011 2012 2013 2014
TotalDaysCashonHand
TotalCash&InvestmentsinMillions Total Liquidity
Cash & Investments Days Cash on Hand
Source: Audited Financial Statements
2005 - 2010 adjusted to reflect FASB ASU No. 2011-07, Healthcare Entities Topic 954
22
Growth in Net Assets
Reflects Our Low Risk Profile
Confidential
0
35
70
105
140
175
210
245
280
315
350
$0
$1,000
$2,000
$3,000
$4,000
$5,000
$6,000
$7,000
$8,000
$9,000
$10,000
2005 2006 2007 2008 2009 2010 2011 2012 2013 2014
DaysNetAssets
NetAssetsinMillions
Net Asset
Net Assets Days Net Assets
Source: Audited Financial Statements
2005 - 2010 adjusted to reflect FASB ASU No. 2011-07, Healthcare Entities Topic 954
23
Hospital Replacements Under Way
Using Integrated Lean Project Delivery Method
Sacramento San Francisco Van Ness Geary
San Francisco
St. Luke’s
$0
$150
$300
$450
$600
$750
$900
$1,050
$1,200
$1,350
2004
2005
2006
2007
2008
2009
2010
2011
2012
2013
2014
2015
2016
2017
2018
2019
2020
2021
2022
2023
$inMillions
Capital Investment Forecast
Additions to PP&E
Routine
Discretionary
IT
Regulatory
24
Sufficient Sources of Capital On Hand to
Complete SB1953 Mandate
Long term thinking. Flexibility forward
Future
Flexibility
Confidential
--------------- Projection ----------------
0.0%
1.5%
3.0%
4.5%
6.0%
7.5%
9.0%
10.5%
12.0%
13.5%
15.0%
2005 2006 2007 2008 2009 2010 2011 2012 2013 2014
Operating Cash Flow Margin
Source: Audited Financial Statements
2005 - 2010 adjusted to reflect FASB ASU No. 2011-07, Healthcare Entities Topic 954
25
Impact on operating cash flow margin -2.1% in 2013 from cost of investments that must be expensed due to GAAP
Confidential
Transformation Investments and Strong Operations
are Favorably Impacting Operating Cash Flows
*
*
0.0%
1.2%
2.4%
3.6%
4.8%
6.0%
7.2%
8.4%
9.6%
10.8%
2005 2006 2007 2008 2009 2010 2011 2012 2013 2014
Net Income Margin
Source: Audited Financial Statements
2005 - 2010 adjusted to reflect FASB ASU No. 2011-07, Healthcare Entities Topic 954
26
Even during periods of financial market
distress (2008) and heavy transformation
investment (2013) net margins still
exceeded 2%
Confidential
Impact on operating cash flow margin -2.1% in 2013 from cost of investments that must be expensed due to GAAP
*
27
Affordability*
Confidential
$-
$2,000
$4,000
$6,000
$8,000
$10,000
$12,000
$14,000
-
50,000
100,000
150,000
200,000
250,000
300,000
2011 2012 2013 2014
Discharges Net Revenueper CMI Adjusted Discharge
3 year = -2.7%
3 year = 0.1%
*Small revenue increase per discharge translates to lower
cost increase to payers
28
Affordability*
Confidential
$-
$2,000
$4,000
$6,000
$8,000
$10,000
$12,000
2011 2012 2013 2014
Cost per CMI and WI Adjusted Discharge
3 year = 0.5%
*Small revenue increase per discharge is a result of low
increase in underlying costs
Medical Foundation Transparency and Affordability
29
Confidential
• Website posting-Consumer Facing Basket of
Service
 ~200 services – anticipate posting January 2016
• Patient Interactive Tool
Self service web application allowing patients with
My Health Online to determine the total allowed
amount and patient responsibility (anticipate
implementation in early 2016)
30
Balance Sheet Strike Zone
Continued focus on a rational capital plan that matches the performance from
operations is having the desired outcome on our balance sheet
Confidential
22%
24%
26%
28%
30%
32%
34%
36%
38%
40%
42%
130
145
160
175
190
205
220
235
250
265
280
2005 2006 2007 2008 2009 2010 2011 2012 2013 2014
UnrestrictedSystemDebtLeverage
TotalDaysCash
Total Days Cash and System Debt Leverage
Total Days Cash Unrestricted System Debt Leverage
31
Permanent Capital Base
No Puttable Debt, No Swaps
Confidential
$0
$1,250
$2,500
$3,750
$5,000
$6,250
$7,500
$8,750
$10,000
$11,250
$12,500
$13,750
2005 2006 2007 2008 2009 2010 2011 2012 2013 2014
inMillions
Capital (Long Term Debt + Net Assets)
Net Assets Fixed Debt Variable Debt Line of Credit
Source: Audited Financial Statements
A strong pension plan is highly valued by employees
32
Keeping the Pension Plan Fully Funded
Keeps the Cost Manageable
$0
$100
$200
$300
$400
$500
$600
600
800
1,000
1,200
1,400
1,600
1,800
2,000
2,200
S&P500
Major Funding inDown Markets
Biasto Buy Low Produces Stronger Returns
Funding S&P500
2014 Highlights
$ in Millions
• Profit & Loss
– Operating income $419
– Income attributable to Sutter $402
• Infrastructure Investments
– Capital expenditures $983
– Healthcare diversification investments $55
– Operations investments
• Balance Sheet
– Net assets $8.0 billion
– Cash and investments $4.9 billion
– 198 total days on hand (170 days unrestricted)
33
Don Wreden, M.D.
Senior Vice President, Patient Experience
Sutter Health
0%
2%
4%
6%
8%
10%
12%
14%
16%
18%
20%
Elective Delivery< 39 Weeks: Sutter Health System
Sys P90 P50
OB Care: Elective Delivery < 39 Weeks
Better
Benchmark is based on Leapfrog Group 2011 U.S. Goal and 2010 P50.
Target = 5.0%
Threshold = 9.0%
Sepsis Mortality Reduction Initiative
36
UCL
LCL
CL
Rolling 12 month sepsis
mortality rate
ICU IV Liberation
Improvement Process
Interprofessional Team Development eICU Telemedicine data collection
Interprofessional Rounding
A- Awake
B-Breathing
C-Coordination
D-Delirium
E-Exercise
F-Family
Results
ICU Liberation
Improving Patient Outcomes
• ICU acquired delirium
• ICU and hospital length of stay
• 1.11 ventilator day reduction
• ICU and 6-month mortality post discharge
Variation Reduction: Doctors agree to
avoid ordering labs as “Repeat Daily”
39
47%  35%
September 2014:
40 doctors meet and
review differences
Impact in one hospital:
2,964 blood draws avoided
$95,000 saved
How did Sutter Hospitals perform
compared to other hospitals nationally?
Source: http://www.hospitalsafetyscore.org/media/file/ExplanationofSafetyScoreGrades_April2015.pdf
and www.hospitalsafetyscore.org
0%
10%
20%
30%
40%
50%
60%
70%
A B C D F
Percent of All Hospitals
Percent of Sutter Hospitals
Better Worse
End
of Life
Complex Case
Management
Acute Case Management
Chronic Disease Management
Wellness Management
41
Confidential42
We Plus You

Sutter

  • 1.
    2200 River PlazaDrive Sacramento, CA 95833 June 9, 2015 The following information for Sutter Health and Affiliates (the “Presentation”) will be shared by Sutter Health’s President and Chief Operating Officer, Sarah Krevans, along with Jeff Sprague, Senior Vice President and Chief Financial Officer of Sutter Health, and Don Wreden, M.D., Senior Vice President, Patient Experience of Sutter Health at the Citi Non-Profit Health Care Investor Conference on June 11 and 12, 2015, in New York City. The filing of this information does not constitute or imply any representation (i) that all of the information provided herein is material to investors, (ii) regarding any other financial, operating or other information about Sutter Health, the Obligated Group Members or any related bonds (the “Bonds”), (iii) that no changes, circumstances or events have occurred since the end of the fiscal year to which this information relates, or any other date specified with respect to any of the information contained in the following, or that no other information exists, which may have a bearing on the security for the Bonds, or an investor’s decision to buy, sell, or hold the Bonds or (iv) that Sutter Health is obligated to, or plans to, update or revise the information that is presented. The information has been obtained from sources which are believed to be reliable, but such information is not guaranteed as to accuracy or completeness. No statement in the following information should be construed as a prediction or representation about future financial performance of Sutter Health or any Obligated Group Member. Should you have questions, please contact the Sutter Health Finance support staff at (916) 286-6557. {00678639 v.1}
  • 2.
    Sixteenth Annual Not-for-Profit HealthCare Investor Conference Sutter Health June, 2015 Unless otherwise noted, the financial information related to fiscal year 2014 contained in this presentation has been obtained from Sutter Health Audited Financial Statements
  • 3.
    Certain statements inthis presentation constitute “forward-looking statements.” Such statements generally are identifiable by the terminology used, such as “plan,” “expect,” “estimate,” “budget” or other similar words. The achievement of certain results or other expectations contained in such forward- looking statements involve known and unknown risks, uncertainties and other factors, some of which are beyond Sutter Health’s control, that may cause actual results, performance or achievements described to be materially different from any future results, performance or achievements expressed or implied by such forward- looking statements. You are cautioned not to place undue reliance on forward- looking statements that reflect management's view only as of the date of this presentation or as of such earlier date as indicated. All forward-looking statements included in this presentation and all subsequent forward-looking statements attributable to Sutter Health or persons acting on Sutter Health’s behalf are expressly qualified in their entirety by these cautionary statements. The information contained in this presentation speaks only as of the date stated, or if no date is stated, as of the date of this presentation. Sutter Health is not under any obligations and does not intend to issue any updates or revisions to those forward-looking statements if, or when, its expectations or events, conditions or circumstances on which such statements are based occur or fail to occur, except as required by law. 2 Caution regarding forward-looking statements
  • 4.
    Sarah Krevans President &Chief Operating Officer Sutter Health
  • 5.
    Sutter is nationallysignificant Broad Reach Largest contiguous not-for-profit health system in the US Diverse Patients 100+ languages Serving some of the richest and poorest areas in the nation National Health Impact 1 in 100 Americans receives care at Sutter Economic Contributor Among the largest US employers Community impact $3M of charity care provided every week
  • 6.
    Sutter Health systemsnapshot (2014) 5 Bay Area Operating Unit Valley Area Operating Unit Physicians (members of Sutter Medical Network) 5,000 Network and affiliate employees 49,381 Licensed acute care beds 4,321 2014 by Numbers Births 35,463 Discharges 190,054 Outpatient visits 11,121,733 Operations of most Sutter Health affiliates recently consolidated from five regions into two distinct Northern California geographic operating units. It is anticipated that the legal consolidation of these Sutter Health affiliates will be complete by Fiscal Year ending 2017 Sutter Health Facts at a Glance *Not shown on map: - Sutter Coast Hospital (Crescent City, CA) - Kahi Mohala Behavioral Health Hospital (Ewa Beach, HI)
  • 7.
  • 8.
    Business Segments • AcuteHospital – Focusing on high quality, affordable care • Medical Foundations – Focusing on growth, affordable care • Other Providers Growing Rapidly – Sutter Care at Home – Ambulatory Surgery Center Joint Ventures – System Lab • Additional Diversification Investments 7 Confidential
  • 9.
    One Sutter Focus oncontinued operational excellence Focus on the market, and enhance our presence Focus on the holistic patient experience Focus on the future – innovation and growth
  • 10.
  • 11.
  • 12.
    Confidential Support Function Transformation TwelveMonths Ending December 2014 11 2014 Planned 2014 Actual 2014 Variance
  • 13.
  • 14.
    R S Hospital Ambulatory Surgery Center R Sutter Rehabilitation Institute Care Center ValleyArea Snapshot (2014)  12 Counties  Population: 4.4M  Square Miles: 13,800  Med Group Physicians: 1,040  Independent Physicians: 864  Foundation Patient Visits: 5.4M  Employees: 17k  Acute Facilities: 11  ASCs: 13  Licensed Beds: 1,855+  Inpatient Discharges: 87k  Care Centers: 107  Gross Patient Rev: $11,737M  Net Operating Rev: $3,819M  Operating Expense: $3,559M  Operating Income: $260M  EBITDA: $457M Operations of most Sutter Health affiliates recently consolidated from five regions into two distinct Northern California geographic operating units. It is anticipated that the legal consolidation of these Sutter Health affiliates will be complete by Fiscal Year ending 2017
  • 15.
    Bay Area Snaphot(2014)  Counties: 8  Population: 7.2M  Square Miles: 5,781  Med Group Physicians: 1,921  Independent Physicians: 1,704  Foundation Patient Visits: 5.5M  Employees: 19,927  Acute Facilities: 16  ASCs: 16  Licensed Beds: 2,250+  Inpatient Discharges: 101K  Care Centers: 147  Gross Patient Rev: $14,920M  Net Operating Rev: $5,856M  Operating Expense: $5,497M  Operating Income: $359M  EBITDA: $751M S Bay Area Hospital Ambulatory Surgery Center Care Center Outreach Center Operations of most Sutter Health affiliates recently consolidated from five regions into two distinct Northern California geographic operating units. It is anticipated that the legal consolidation of these Sutter Health affiliates will be complete by Fiscal Year ending 2017
  • 16.
    15 One Sutter TeamSuccess Confidential
  • 17.
    End of Life Complex Case Management AcuteCase Management Chronic Disease Management Wellness Management 16
  • 18.
    …Celebrating AIM (Advanced IllnessManagement) Within 90 days of entering the program, AIM patients experience: 56% reduction in hospital stays 19% reduction in ER visits 59% reduction in time spent in ICU
  • 19.
    Jeff Sprague Sr. VicePresident and Chief Financial Officer Sutter Health
  • 20.
    Revenue Diversification 19 2013 2014 Confidential Hospital Inpatient 39% Hospital Outpatient 20% Medical Foundations 28% JointVentures 2% SPS 1% Home Health 2% Investment Income 3% RetirementPlans 5% Hospital Inpatient 40% Hospital Outpatient 21% Medical Foundations 32% Joint Ventures 3% SPS 2% Home Health 2% Investment Income 0% RetirementPlans 0% Medical Foundations, Joint Ventures and Sutter Physician Services represent 37% of revenues in 2014, up from 31% in the previous year
  • 21.
    Cash Flow Diversification 20 20132014 Confidential ($100) $0 $100 $200 $300 $400 $500 $600 $700 $800 $900 $1,000 Hospitals Medical Foundations Surgicenters Health Plan Other Ops Investment Income Retirement Plans Diversified portfolio of non correlated assets supports expectation of a steady source of cash flow to continue to invest in transformation, EHR and retirement plans
  • 22.
    21 Liquidity Remains Strong Confidential 0 20 40 60 80 100 120 140 160 180 200 220 $0 $500 $1,000 $1,500 $2,000 $2,500 $3,000 $3,500 $4,000 $4,500 $5,000 $5,500 20052006 2007 2008 2009 2010 2011 2012 2013 2014 TotalDaysCashonHand TotalCash&InvestmentsinMillions Total Liquidity Cash & Investments Days Cash on Hand Source: Audited Financial Statements 2005 - 2010 adjusted to reflect FASB ASU No. 2011-07, Healthcare Entities Topic 954
  • 23.
    22 Growth in NetAssets Reflects Our Low Risk Profile Confidential 0 35 70 105 140 175 210 245 280 315 350 $0 $1,000 $2,000 $3,000 $4,000 $5,000 $6,000 $7,000 $8,000 $9,000 $10,000 2005 2006 2007 2008 2009 2010 2011 2012 2013 2014 DaysNetAssets NetAssetsinMillions Net Asset Net Assets Days Net Assets Source: Audited Financial Statements 2005 - 2010 adjusted to reflect FASB ASU No. 2011-07, Healthcare Entities Topic 954
  • 24.
    23 Hospital Replacements UnderWay Using Integrated Lean Project Delivery Method Sacramento San Francisco Van Ness Geary San Francisco St. Luke’s
  • 25.
    $0 $150 $300 $450 $600 $750 $900 $1,050 $1,200 $1,350 2004 2005 2006 2007 2008 2009 2010 2011 2012 2013 2014 2015 2016 2017 2018 2019 2020 2021 2022 2023 $inMillions Capital Investment Forecast Additionsto PP&E Routine Discretionary IT Regulatory 24 Sufficient Sources of Capital On Hand to Complete SB1953 Mandate Long term thinking. Flexibility forward Future Flexibility Confidential --------------- Projection ----------------
  • 26.
    0.0% 1.5% 3.0% 4.5% 6.0% 7.5% 9.0% 10.5% 12.0% 13.5% 15.0% 2005 2006 20072008 2009 2010 2011 2012 2013 2014 Operating Cash Flow Margin Source: Audited Financial Statements 2005 - 2010 adjusted to reflect FASB ASU No. 2011-07, Healthcare Entities Topic 954 25 Impact on operating cash flow margin -2.1% in 2013 from cost of investments that must be expensed due to GAAP Confidential Transformation Investments and Strong Operations are Favorably Impacting Operating Cash Flows * *
  • 27.
    0.0% 1.2% 2.4% 3.6% 4.8% 6.0% 7.2% 8.4% 9.6% 10.8% 2005 2006 20072008 2009 2010 2011 2012 2013 2014 Net Income Margin Source: Audited Financial Statements 2005 - 2010 adjusted to reflect FASB ASU No. 2011-07, Healthcare Entities Topic 954 26 Even during periods of financial market distress (2008) and heavy transformation investment (2013) net margins still exceeded 2% Confidential Impact on operating cash flow margin -2.1% in 2013 from cost of investments that must be expensed due to GAAP *
  • 28.
    27 Affordability* Confidential $- $2,000 $4,000 $6,000 $8,000 $10,000 $12,000 $14,000 - 50,000 100,000 150,000 200,000 250,000 300,000 2011 2012 20132014 Discharges Net Revenueper CMI Adjusted Discharge 3 year = -2.7% 3 year = 0.1% *Small revenue increase per discharge translates to lower cost increase to payers
  • 29.
    28 Affordability* Confidential $- $2,000 $4,000 $6,000 $8,000 $10,000 $12,000 2011 2012 20132014 Cost per CMI and WI Adjusted Discharge 3 year = 0.5% *Small revenue increase per discharge is a result of low increase in underlying costs
  • 30.
    Medical Foundation Transparencyand Affordability 29 Confidential • Website posting-Consumer Facing Basket of Service  ~200 services – anticipate posting January 2016 • Patient Interactive Tool Self service web application allowing patients with My Health Online to determine the total allowed amount and patient responsibility (anticipate implementation in early 2016)
  • 31.
    30 Balance Sheet StrikeZone Continued focus on a rational capital plan that matches the performance from operations is having the desired outcome on our balance sheet Confidential 22% 24% 26% 28% 30% 32% 34% 36% 38% 40% 42% 130 145 160 175 190 205 220 235 250 265 280 2005 2006 2007 2008 2009 2010 2011 2012 2013 2014 UnrestrictedSystemDebtLeverage TotalDaysCash Total Days Cash and System Debt Leverage Total Days Cash Unrestricted System Debt Leverage
  • 32.
    31 Permanent Capital Base NoPuttable Debt, No Swaps Confidential $0 $1,250 $2,500 $3,750 $5,000 $6,250 $7,500 $8,750 $10,000 $11,250 $12,500 $13,750 2005 2006 2007 2008 2009 2010 2011 2012 2013 2014 inMillions Capital (Long Term Debt + Net Assets) Net Assets Fixed Debt Variable Debt Line of Credit Source: Audited Financial Statements
  • 33.
    A strong pensionplan is highly valued by employees 32 Keeping the Pension Plan Fully Funded Keeps the Cost Manageable $0 $100 $200 $300 $400 $500 $600 600 800 1,000 1,200 1,400 1,600 1,800 2,000 2,200 S&P500 Major Funding inDown Markets Biasto Buy Low Produces Stronger Returns Funding S&P500
  • 34.
    2014 Highlights $ inMillions • Profit & Loss – Operating income $419 – Income attributable to Sutter $402 • Infrastructure Investments – Capital expenditures $983 – Healthcare diversification investments $55 – Operations investments • Balance Sheet – Net assets $8.0 billion – Cash and investments $4.9 billion – 198 total days on hand (170 days unrestricted) 33
  • 35.
    Don Wreden, M.D. SeniorVice President, Patient Experience Sutter Health
  • 36.
    0% 2% 4% 6% 8% 10% 12% 14% 16% 18% 20% Elective Delivery< 39Weeks: Sutter Health System Sys P90 P50 OB Care: Elective Delivery < 39 Weeks Better Benchmark is based on Leapfrog Group 2011 U.S. Goal and 2010 P50. Target = 5.0% Threshold = 9.0%
  • 37.
    Sepsis Mortality ReductionInitiative 36 UCL LCL CL Rolling 12 month sepsis mortality rate
  • 38.
    ICU IV Liberation ImprovementProcess Interprofessional Team Development eICU Telemedicine data collection Interprofessional Rounding A- Awake B-Breathing C-Coordination D-Delirium E-Exercise F-Family Results
  • 39.
    ICU Liberation Improving PatientOutcomes • ICU acquired delirium • ICU and hospital length of stay • 1.11 ventilator day reduction • ICU and 6-month mortality post discharge
  • 40.
    Variation Reduction: Doctorsagree to avoid ordering labs as “Repeat Daily” 39 47%  35% September 2014: 40 doctors meet and review differences Impact in one hospital: 2,964 blood draws avoided $95,000 saved
  • 41.
    How did SutterHospitals perform compared to other hospitals nationally? Source: http://www.hospitalsafetyscore.org/media/file/ExplanationofSafetyScoreGrades_April2015.pdf and www.hospitalsafetyscore.org 0% 10% 20% 30% 40% 50% 60% 70% A B C D F Percent of All Hospitals Percent of Sutter Hospitals Better Worse
  • 42.
    End of Life Complex Case Management AcuteCase Management Chronic Disease Management Wellness Management 41
  • 43.