Download as PDF, PPTX


![2.00
2.50
3.00
3.50
4.00
4.50
5.00
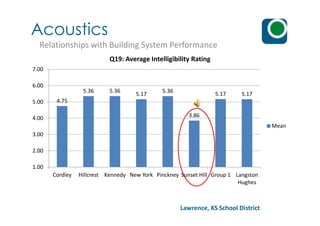
Indoor Air Quality (IAQ)
Construction Impacts on IAQ
Classroom Teacher: the trains leave their engines
[idling] and the smoke enters the classroom
Fall Winter Spring Summer
Teachers & Staff 3.30 3.22 3.67 3.63
Standard Deviation 1.42 1.39 0.87 1.06
0.50
1.00
1.50
2.00
Teachers/Admin/Staff average ratings of IAQ
in their primary classroom or work area
(standard deviation also shown)
Gap between screen frame and window
frame](https://image.slidesharecdn.com/sustainablebuildingfundamentalsclass-140527082415-phpapp01/85/Sustainable-building-fundamentals-class-2013-30-320.jpg)
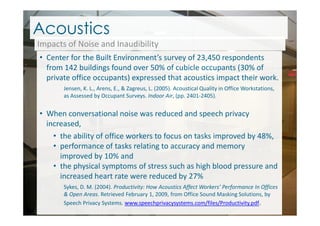

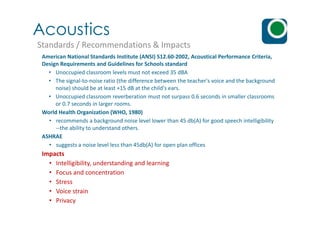
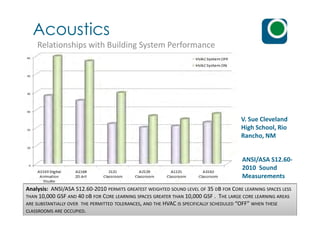
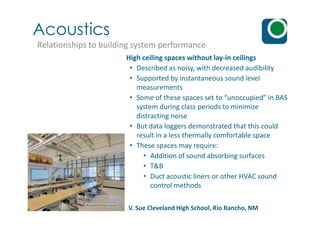


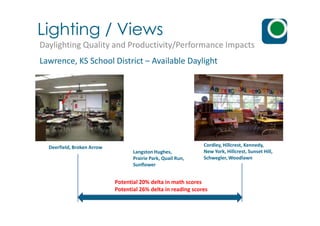

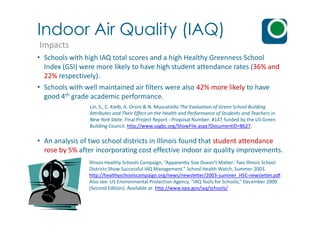
The document discusses the importance of indoor environmental quality (IEQ) in buildings, emphasizing its impact on productivity, health, and educational performance. It highlights that improved IEQ can enhance student test scores and reduce absenteeism while outlining significant cost savings associated with better air quality and personal environmental control. The text includes data on the effects of temperature, air quality, and acoustics on occupant comfort and productivity, calling for attention to these factors in building design and operation.


