Sushil Finance present their daily update on the commodity markets. Read about the latest commodity news, outlook and technical strategies on Gold, Silver, Crude Oil.
St. Louis Fire Insurance Maps Digital Collectionsinglesoliloquy
The 19th century St. Louis fire insurance maps provide an important visual record of the growing and developing built environment of post-Civil War St. Louis from 1870 to 1898. Originally created for the fire insurance industry, these maps document commercial, industrial, and residential neighborhoods and are regularly consulted by urban planners, architects, and historians. Washington University Libraries and the Missouri Historical Society hold approximately 2,500 of these 19th century St. Louis fire insurance maps that are not currently available in any digital collection. Digitizing these maps could increase access and scholarship, allow for experimentation by incorporating the maps with other datasets, and help preserve the original maps.
This document discusses how latest energy efficiency technologies can save 10-30% more on costs compared to older technologies. It highlights technologies like HVAC upgrades, lighting upgrades, and building controls that can reduce energy use by 25-50% and pay for themselves within 3 years. The document provides examples of organizations that achieved significant savings and payback periods from various efficiency projects involving HVAC, lighting, and building control upgrades.
La Guerra Fría comenzó al final de la Segunda Guerra Mundial y duró décadas, caracterizada por tensiones entre Estados Unidos y la Unión Soviética. Ambas potencias formaron alianzas militares opuestas (OTAN y Pacto de Varsovia) y compitieron por influencia a nivel global e ideológico durante la segunda mitad del siglo XX. Eventos como la crisis de los misiles en Cuba llevaron a la Guerra Fría a su punto máximo, pero eventualmente las tensiones disminuyeron con la llegada de líderes que promov
Robert Geoffrey Edwards fue un fisiólogo pionero en la investigación en medicina reproductiva que nació en Manchester en 1925 y estudió en la Universidad de Gales y la Universidad de Edimburgo, obteniendo su licenciatura en biología en 1955. En 1968 realizó la primera fertilización de un óvulo humano fuera del organismo de la mujer, dando lugar al nacimiento de Louise Brown en 1978, el primer bebé probeta. Desde entonces, cuatro millones de personas han nacido en el mundo utilizando este método desarrollado por Edwards, que revol
Nifty futures/Bank Nifty futures market closed on 8540/ 18680. According to technical analysis if Nifty future sand Bank Nifty future moves down-word in tomorrow treading session then 8456 will be small support for Nifty futures and 18512 will be small support for Bank Nifty futures.
Nifty futures/Bank Nifty futures market closed on 8569/ 18835. According to technical analysis if Nifty futures and Bank Nifty future moves down-word in tomorrow treading session then 8449 will be small support for Nifty futures and 18367 will be small support for Bank Nifty futures.
The document summarizes financial information for GlaxoSmithKline Consumer Healthcare Ltd for quarters ending June 2015 and September 2015E. Key highlights include:
- For Q1 FY16 ending June 2015, net profit increased 19.13% YoY to Rs. 1550.10 million, net sales grew 8.18% YoY, and operating profit rose 20.64% YoY.
- Estimates for Q2 FY16 ending September 2015 show net sales growth to Rs. 11850.30 million and net profit increasing to Rs. 1775.02 million.
- At the current market price of Rs. 6270.20, the stock trades at a P/E ratio of 40.
Apollo Tyres approves further expansion of the Truck & Bus radial tyre capacityIndiaNotes.com
Apollo Tyres reported a 12.4% decrease in net sales but a 27.5% increase in net profit for Q1 FY16 compared to Q1 FY15. EBITDA rose 15.4% and profit margins increased 319 and 447 basis points respectively. Apollo Tyres approved expanding its Chennai truck and bus radial tire capacity and raising Rs. 20,000 million in debt for ongoing expansions. Analyst estimates see Apollo Tyres' operating profit and PAT growing at a CAGR of 13% and 23% from FY14 to FY17 respectively.
Grasim Industries reports improved performance in Q1FY16IndiaNotes.com
Grasim Industries reported improved performance for the quarter ended June 2015, with consolidated net sales up 7% to Rs. 8,599 crore. Operating margin improved 130 basis points to 16.5% due to lower raw material and power costs. However, operating profit grew only 16% to Rs. 1,417 crore due to higher interest and depreciation costs. Net profit declined 1% to Rs. 484.67 crore. Key segments like viscose staple fibre saw revenue increase 15% and EBITDA surge 72% on higher sales volumes and lower input costs. The cement subsidiary UltraTech reported 7% revenue growth but net profit fell 5% to Rs. 591 crore.
The document provides a technical analysis recommendation for buying Lupin stock. It recommends buying between price levels of 1790 and 1820 with a stop-loss of 1660. The analysis notes that shorter term moving averages have converged and the RSI oscillator is showing a positive signal in the mid-range, indicating buy signals on both technical indicators.
Indoco Remedies reported quarterly results slightly below expectations due to restructuring of its domestic business. Sales grew 9% to Rs 216 crore while margins improved. Exports grew 23% but was offset by weak 2% domestic growth. The company expects the domestic segment to recover in the second half of the year. For the full year, sales are expected to grow 19% overall. While the quarter saw short-term impacts of domestic restructuring, the analyst maintains a HOLD recommendation based on the company's business model and expectations for profitability and returns to further expand.
Thermax Limited is a leading energy and environment solutions provider operating globally. In Q1 FY2016, the company's net sales increased 19.27% to Rs. 10011.90 million and net profit increased 48.96% to Rs. 616.78 million compared to the same period last year. The order balance on June 30, 2015 stood at Rs. 42750 million, down 18% from the previous year. The company plans to set up new manufacturing facilities. Analysts recommend buying the stock with a target price of Rs. 1145, citing expected growth in earnings.
Calculation of compliance cost: Veterinary and sanitary control of aquatic bi...Alexander Belyaev
Calculation of compliance cost in the fishing industry of Russia after extended SCM model (Veterinary and sanitary control of aquatic biological resources (ABR) - Preparation of documents, passing expertise)
What Lessons Can New Investors Learn from Newman Leech’s Success?Newman Leech
Newman Leech's success in the real estate industry is based on key lessons and principles, offering practical advice for new investors and serving as a blueprint for building a successful career.
The Rise and Fall of Ponzi Schemes in America.pptxDiana Rose
Ponzi schemes, a notorious form of financial fraud, have plagued America’s investment landscape for decades. Named after Charles Ponzi, who orchestrated one of the most infamous schemes in the early 20th century, these fraudulent operations promise high returns with little or no risk, only to collapse and leave investors with significant losses. This article explores the nature of Ponzi schemes, notable cases in American history, their impact on victims, and measures to prevent falling prey to such scams.
Understanding Ponzi Schemes
A Ponzi scheme is an investment scam where returns are paid to earlier investors using the capital from newer investors, rather than from legitimate profit earned. The scheme relies on a constant influx of new investments to continue paying the promised returns. Eventually, when the flow of new money slows down or stops, the scheme collapses, leaving the majority of investors with substantial financial losses.
Historical Context: Charles Ponzi and His Legacy
Charles Ponzi is the namesake of this deceptive practice. In the 1920s, Ponzi promised investors in Boston a 50% return within 45 days or 100% return in 90 days through arbitrage of international reply coupons. Initially, he paid returns as promised, not from profits, but from the investments of new participants. When his scheme unraveled, it resulted in losses exceeding $20 million (equivalent to about $270 million today).
Notable American Ponzi Schemes
1. Bernie Madoff: Perhaps the most notorious Ponzi scheme in recent history, Bernie Madoff’s fraud involved $65 billion. Madoff, a well-respected figure in the financial industry, promised steady, high returns through a secretive investment strategy. His scheme lasted for decades before collapsing in 2008, devastating thousands of investors, including individuals, charities, and institutional clients.
2. Allen Stanford: Through his company, Stanford Financial Group, Allen Stanford orchestrated a $7 billion Ponzi scheme, luring investors with fraudulent certificates of deposit issued by his offshore bank. Stanford promised high returns and lavish lifestyle benefits to his investors, which ultimately led to a 110-year prison sentence for the financier in 2012.
3. Tom Petters: In a scheme that lasted more than a decade, Tom Petters ran a $3.65 billion Ponzi scheme, using his company, Petters Group Worldwide. He claimed to buy and sell consumer electronics, but in reality, he used new investments to pay off old debts and fund his extravagant lifestyle. Petters was convicted in 2009 and sentenced to 50 years in prison.
4. Eric Dalius and Saivian: Eric Dalius, a prominent figure behind Saivian, a cashback program promising high returns, is under scrutiny for allegedly orchestrating a Ponzi scheme. Saivian enticed investors with promises of up to 20% cash back on everyday purchases. However, investigations suggest that the returns were paid using new investments rather than legitimate profits. The collapse of Saivian l
Monthly Market Risk Update: June 2024 [SlideShare]Commonwealth
Markets rallied in May, with all three major U.S. equity indices up for the month, said Sam Millette, director of fixed income, in his latest Market Risk Update.
For more market updates, subscribe to The Independent Market Observer at https://blog.commonwealth.com/independent-market-observer.
Navigating Your Financial Future: Comprehensive Planning with Mike Baumannmikebaumannfinancial
Learn how financial planner Mike Baumann helps individuals and families articulate their financial aspirations and develop tailored plans. This presentation delves into budgeting, investment strategies, retirement planning, tax optimization, and the importance of ongoing plan adjustments.
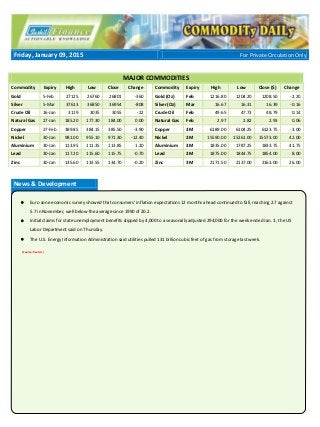
1. Friday, January 09, 2015 For Private Circulation Only
MAJOR COMMODITIES
Commodity Expiry High Low Close Change Commodity Expiry High Low Close ($) Change
Gold 5-Feb 27125 26760 26801 -360 Gold (Oz) Feb 1216.80 1204.20 1208.50 -2.20
Silver 5-Mar 37613 36850 36954 -808 Silver (Oz) Mar 16.67 16.31 16.39 -0.16
Crude Oil 16-Jan 3119 3035 3055 -22 Crude Oil Feb 49.65 47.73 48.79 0.14
Natural Gas 27-Jan 185.20 177.30 184.00 0.00 Natural Gas Feb 2.97 2.82 2.93 0.06
Copper 27-Feb 389.85 384.15 385.50 -3.90 Copper 3M 6189.00 6104.25 6123.75 -3.00
Nickel 30-Jan 981.00 955.10 971.30 -12.40 Nickel 3M 15590.00 15261.00 15573.00 42.00
Aluminium 30-Jan 113.95 111.35 113.85 1.20 Aluminium 3M 1835.00 1787.25 1833.75 41.75
Lead 30-Jan 117.20 115.60 115.75 -0.70 Lead 3M 1875.00 1844.75 1854.00 8.00
Zinc 30-Jan 135.60 133.55 134.70 -0.20 Zinc 3M 2171.50 2137.00 2163.00 26.00
News & Development
Euro zone economic survey showed that consumers' inflation expectations 12 months ahead continued to fall, reaching 2.7 against
5.7 in November, well below the average since 1990 of 20.2.
Initial claims for state unemployment benefits slipped by 4,000 to a seasonally adjusted 294,000 for the week ended Jan. 3, the US
Labor Department said on Thursday.
The U.S. Energy Information Administration said utilities pulled 131 billion cubic feet of gas from storage last week.
(Source: Reuters)
2. Page 2
Commodity Daily
Gold
Gold fell for the second straight day on Thursday, in a choppy session
weighed down by a stronger dollar and rising stock markets after being
buoyed by expectations the Federal Reserve will be patient in raising
interest rates.
Minutes from the Federal Reserve's latest policy meeting released on
Wednesday reassured markets that the central bank was in no hurry to
raise interest rates, lifting European shares.
Among currencies, the dollar hit a 9-year high against the euro, as
investors ramped up bets the European Central Bank was getting closer
to loosening monetary policy to ward off deflation.
Analysts are awaiting the release of U.S. non-farm payrolls data for
December on Friday, a key barometer of the health of the U.S. economy.
An upbeat report is likely to support the view that the Fed will raise rates
sooner rather than later.
Outlook
We expect gold prices are likely to trade on negative note on the back of
US interest rate outlook.
Technical Outlook
Gold Strategy S2 S1 Close R1 R2
Feb Sell @ R1 26600 26700 26801 26900 27000
*Investors can use S2/R2 as Stop Loss/Target depending upon the strategy advised
Silver
Silver was down 1 percent at $16.35 an ounce.
The number of Americans filing new claims for unemployment benefits
fell last week and job cuts declined sharply in December, suggesting
the labor market is tightening.
Thursday's reports support views of faster growth this year, driven by
consumer spending, despite a faltering global economy.
Outlook
We expect Silver prices are likely to trade negative note on the back of
US interest rate outlook.
Technical Outlook
Silver Strategy S2 S1 Close R1 R2
Mar Sell @ R1 36500 36800 36954 37400 37800
*Investors can use S2/R2 as Stop Loss/Target depending upon the strategy advised
3. Page 3
Commodity Daily
Crude Oil
Global oil prices were little changed for a second straight day on
Thursday after better-than-expected U.S. jobs data helped the market
hold ground after a 10 percent loss earlier in the week.
But support for oil was likely to be short-lived as market bears continue
hunting for a bottom to the second-biggest price rout in crude's history,
traders said.
Some traders think oil prices could be at a crossroads after losing over
half their value from June highs, and that could explain benchmark
Brent's stalling at above $50 since Wednesday. Others believe the
market has just been handed a reprieve before being hammered lower.
Data on Thursday showed jobless claims in the United States fell last
week, while a separate report said U.S. employers announced a total of
483,171 job cuts in 2014. That was 5 percent fewer than in 2013 and the
smallest number since 1997.
Expectations the European Central Bank could resort to stimulus
measures after a rash of weak economic data and record crude imports
by China in December, possibly due to attractive pricing, also helped
sentiment, traders said.
But the world's largest oil traders have also started hiring supertankers
to store crude at sea, marking a milestone in the build-up of the global
glut of supplies, freight brokers and shipping sources said.
Outlook
We expect crude oil prices likely to trade on negative note on the back of
increasing supply and decreasing demand is likely to keep crude oil
prices under pressure.
Technical Outlook
Crude Oil Strategy S2 S1 Close R1 R2
Jan Sell @ R1 3000 3030 3055 3120 3160
*Investors can use S2/R2 as Stop Loss/Target depending upon the strategy advised
Natural Gas
U.S. natural gas futures gained 2 percent on Thursday after the
government reported a bigger-than-expected storage draw and on
colder-than-normal forecasts for the next two weeks.
The U.S. Energy Information Administration said utilities pulled 131
billion cubic feet of gas from storage last week.
As on Wednesday, the latest weather models for the lower 48 U.S.
states on Thursday called for colder-than-normal temperatures over
the next two weeks, with an expected 502 heating degree days.
Outlook
We expect Natural gas prices to trade on negative note on the back of
lesser cold temperature forecast over the next few days.
Technical Outlook
Nat Gas Strategy S2 S1 Close R1 R2
Jan Sell @ R1 175 180 184 186 190
*Investors can use S2/R2 as Stop Loss/Target depending upon the strategy advised
4. Page 4
Commodity Daily
LME Inventories Copper Lead Zinc Aluminium Nickel
Current Stock
179225 221975 676375 4175750 415842
Change
550 0 -4475 -8650 30
% Change
0.31% 0.00% -0.66% -0.21% 0.01%
Base Metals
Aluminium rebounded from lows on Thursday as some investors
bought back short positions to lock in profits, but more losses were
expected for copper and zinc ahead of the new year holiday in top
metals consumer China.
Copper, burdened by worries about oversupply, failed to sustain a
bounce from 4-1/2 year lows the previous day, ending in the red
again.
At its lows on Wednesday, aluminium had shed 15 percent since
late November as investors worried about smelters restarting
capacity they had shut down.
Also weighing on copper was more evidence of higher supplies as
LME inventories rose to 179,225 tonnes, bringing the increase
since last August to 27 percent.
Outlook
We expect base metal prices to trade on negative note on the back
of fears of slowdown in China.
Technical Outlook
Jan/Feb Strategy S2 S1 Close R1 R2
Copper Sell @ R1 381 384 385.5 388 391
Nickel Sell @ R1 955 965 971.3 976 989
Alum Sideways 112.5 113.5 113.8 114.2 115
Lead Sell @ R1 114 115 115.7 117 118
Zinc Sell @ R1 132.5 133.5 134.7 135.2 136.2
*Investors can use S2/R2 as Stop Loss/Target depending upon the strategy advised
5. Page 5
Commodity Daily
DATE TIME (IST) COUNTRY ECONOMIC DATA CONSENSUS PREVIOUS IMPACT
Fri, Jan 9 7:00am China CPI y/y 1.50% 1.40% High
7:00am China PPI y/y -3.10% -2.70% Medium
1:15pm EUR French Industrial Production m/m 0.40% -0.80% Medium
3:00pm UK Manufacturing Production m/m 0.40% -0.70% High
3:00pm UK Trade Balance -9.5B -9.6B Medium
7:00pm US Non-Farm Employment Change 241K 321K High
7:00pm US Unemployment Rate 5.70% 5.80% High
7:00pm US Average Hourly Earnings m/m 0.20% 0.40% Medium
8:30pm UK NIESR GDP Estimate 0.70% Medium
For Further Assistance Contact: - 022-40934000
Ashish Shah Tejas Nikhar Mohit Agarwal
AVP
ashish.shah@sushilfinance.com
Sr. Research Analyst
tejas.nikhar@sushilfinance.com
Research Analyst
mohit.agarwal@sushilfinance.com
WE / OUR CLIENTS / OUR RELATIVES MAY HAVE PERSONAL TRADING / INVESTMENT INTEREST IN THE STOCKS MENTIONED HERE IN.
STATEMENT OF DISCLAIMER
This report includes information from sources believed to be reliable but no independent verification has been made and we do not guarantee its
accuracy or completeness. Opinions expressed are subject to change without notice. This report cannot be construed as a request to engage in any
transaction involving the purchase or sale of a futures contract. The risk of loss in trading futures contracts can be substantial, and therefore investors
should understand the risks involved in taking leveraged positions and must assume responsibility for the risks associated with such investments and
for their results.
Additional information with respect to any commodities referred to herein will be available on request. Sushil Global Commodities Pvt. Ltd. and its
connected companies, and their respective Directors, Officers and employees, may, from time to time, have a long or short position in the commodities
mentioned and may sell or buy such commodities. Sushil Global may act upon or make use of information contained herein prior to the publication
thereof.
This data sheet is for private circulation only. While utmost care has been taken in preparing the above, we claim no responsibility for its accuracy. We
shall not be liable for any direct or indirect losses arising from the use thereof and the investors are requested to use the information contained herein
at their own risk.
Sushil Global Commodities Private Limited
Member: NCDEX, FMC Regn.No. 00304 | MCX, FMC Regn.No. 12240
Genius, 4th
Road, Khar (W), Mumbai – 400 052.
Tel.: 022-6698 0636 Fax: 022-6698 0606 | E-mail: commodities@sushilfinance.com | www.sushilfinance.com