Download to read offline


![12 MBRcentral.com
Copyright© 2015 Ovivo Inc. All rights reserved.
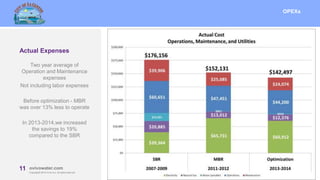
The standard flow-based control equation for permeate set
point:
– Fout = (Fin x Rf) x [Fm + (0.3 x Fc) x (Li-Le)/(Lh-Ll)]
• Fout = process train calculated flow set point
• Fin = time averaged influent flow divided by number of online trains
• Rf = [(Relax Freq – Relax Duration ) / Relax Freq ] -1
• Fm = meter correction factor, 0.85 to 2.0
• Fc = gain for level correction, 0.85 to 2.0
• Li = average or individual controlling basin level
• Le = desired equilibrium level
• Lh = high flow level set point
• Ll = low flow level set point
This was not intuitive to figure out how
changes in the settings would affect the
flow settings.](https://image.slidesharecdn.com/ovivooperatorworkshopd1s6-150707140348-lva1-app6892/85/Sue-Lawrence-12-320.jpg)
![14 MBRcentral.com
Copyright© 2015 Ovivo Inc. All rights reserved.
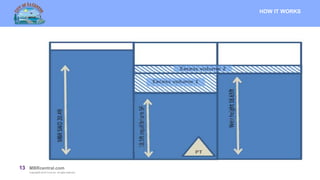
Program Change
Looks at incoming flow and at the difference in the basin level.
• If Li <= Lw, then dflow = ((Li - Le)* Vpa)/10
• If Li > Lw, then dflow = (((Lw - Le)* Vpa) + ((Li - Lw) * Vtot)/10 min)
𝐹𝑜𝑢𝑡 = ( 𝐹𝑖𝑛+(dflow*0.3))* 𝑅𝑓
Fout Calculated permeate flow set point in gpm
Fin Time averaged influent flow in gpm
Rf [(Relax freq – Relax duration) / Relax freq ] – 1 (1.11)
Li Average or individual controlling basin level, ft
Le Target Level, ft (Set by Operator)
Lw Weir Level, ft (Set by Operator)
Vpa Volume Aerated basins, gal/ft (Set by Operator)
Vtot Volume Aerated basins, gal/ft (Set by Operator)](https://image.slidesharecdn.com/ovivooperatorworkshopd1s6-150707140348-lva1-app6892/85/Sue-Lawrence-14-320.jpg)
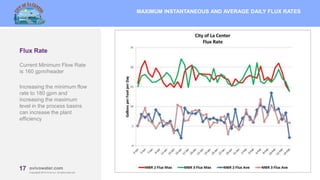
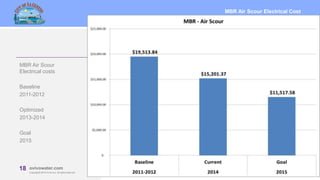


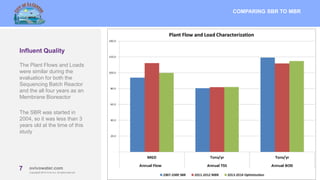
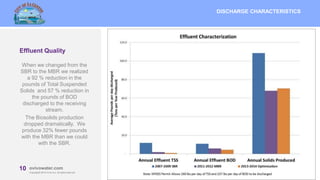
The document summarizes a presentation about the City of La Center WA's wastewater treatment plant which was upgraded from an SBR system to an MBR system. Some key points: 1) The MBR system led to 92% reduction in TSS and 57% reduction in BOD discharged compared to the SBR, and produced 32% less biosolids. 2) Initial O&M costs for the MBR were 13% lower than the SBR, and optimization efforts increased this savings to 19%. 3) Changes to the MBR system programming and control settings helped improve flexibility and efficiency. Increasing the minimum permeate flow rate from 160 gpm to 180 gpm could further boost plant performance.


