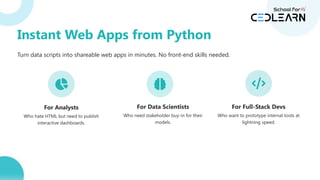
Instant Web Appsfrom Python
Turn data scripts into shareable web apps in minutes. No front-end skills needed.
For Analysts
Who hate HTML but need to publish
interactive dashboards.
For Data Scientists
Who need stakeholder buy-in for their
models.
For Full-Stack Devs
Who want to prototype internal tools at
lightning speed.
5.
Data Analysts
Publish interactivedashboards and EDA
reports.
USE CASE: EDA & Reporting
Data Scientists
Demo models and create prediction
playgrounds for stakeholder buy-in.
USE CASE: Model Playground
Full-Stack Devs
Prototype internal tools and admin panels
rapidly.
USE CASE: Admin Panel
Who Uses Streamlit & For What?
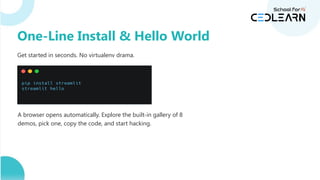
Get started inseconds. No virtualenv drama.
A browser opens automatically. Explore the built-in gallery of 8
demos, pick one, copy the code, and start hacking.
One-Line Install & Hello World
8.
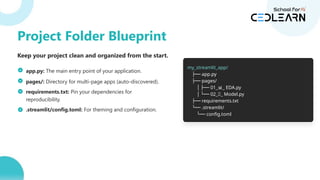
Keep your projectclean and organized from the start.
app.py: The main entry point of your application.
pages/: Directory for multi-page apps (auto-discovered).
requirements.txt: Pin your dependencies for
reproducibility.
.streamlit/config.toml: For theming and configuration.
my_streamlit_app/
├── app.py
├── pages/
│ ├── 01_ _ EDA.py
📊
│ └── 02_🤖_ Model.py
├── requirements.txt
└── .streamlit/
└── config.toml
Project Folder Blueprint
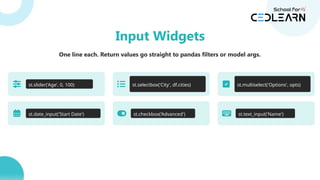
One line each.Return values go straight to pandas filters or model args.
st.slider('Age', 0, 100) st.selectbox('City', df.cities) st.multiselect('Options', opts)
st.date_input('Start Date') st.checkbox('Advanced') st.text_input('Name')
Input Widgets
11.
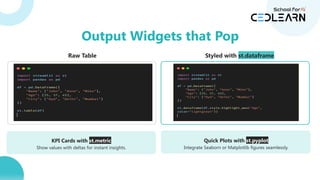
Raw Table Styledwith st.dataframe
KPI Cards with st.metric
Show values with deltas for instant insights.
Quick Plots with st.pyplot
Integrate Seaborn or Matplotlib figures seamlessly.
Output Widgets that Pop
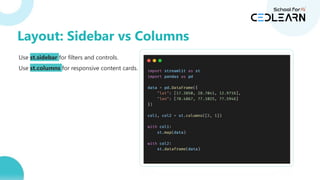
Use st.sidebar forfilters and controls.
Use st.columns for responsive content cards.
with col1:
st.map(data)
with col2:
st.dataframe(data)
Layout: Sidebar vs Columns
14.
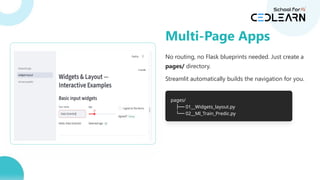
No routing, noFlask blueprints needed. Just create a
pages/ directory.
Streamlit automatically builds the navigation for you.
pages/
├── 01__Widgets_layout.py
└── 02__Ml_Train_Predic.py
Multi-Page Apps
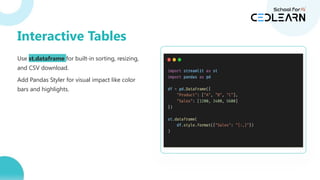
Use st.dataframe forbuilt-in sorting, resizing,
and CSV download.
Add Pandas Styler for visual impact like color
bars and highlights.
Interactive Tables
17.
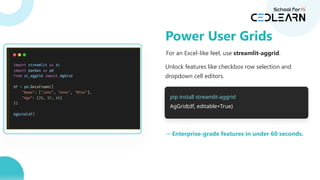
For an Excel-likefeel, use streamlit-aggrid.
Unlock features like checkbox row selection and
dropdown cell editors.
pip install streamlit-aggrid
AgGrid(df, editable=True)
→ Enterprise-grade features in under 60 seconds.
Power User Grids
Matplotlib (Boilerplate)
fig, ax= plt.subplots()
ax.plot(df['date'], df['sales'])
ax.set_xlabel('Date')
ax.set_ylabel('Sales')
ax.set_title('Sales Over Time')
st.pyplot(fig)
Streamlit (Simple)
st.line_chart(df.set_index('date'))
Charts in One Line: Pandas + Streamlit
20.
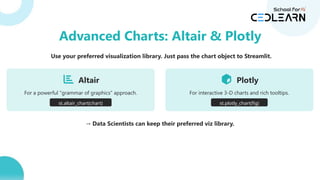
Use your preferredvisualization library. Just pass the chart object to Streamlit.
Altair
For a powerful "grammar of graphics" approach.
st.altair_chart(chart)
Plotly
For interactive 3-D charts and rich tooltips.
st.plotly_chart(fig)
→ Data Scientists can keep their preferred viz library.
Advanced Charts: Altair & Plotly
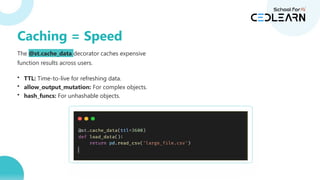
The @st.cache_data decoratorcaches expensive
function results across users.
def load_data():
return pd.read_csv('large_file.csv')
• TTL: Time-to-live for refreshing data.
• allow_output_mutation: For complex objects.
• hash_funcs: For unhashable objects.
Caching = Speed
23.
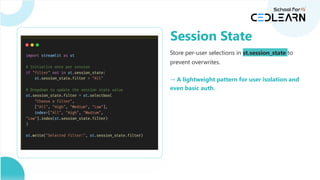
Store per-user selectionsin st.session_state to
prevent overwrites.
if 'filter' not in st.session_state:
st.session_state.filter = 'All'
st.session_state.filter = st.selectbox(...)
→ A lightweight pattern for user isolation and
even basic auth.
Session State
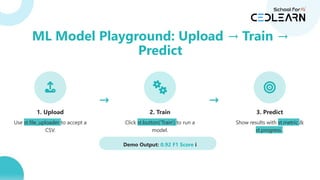
1. Upload
Use st.file_uploaderto accept a
CSV.
→
2. Train
Click st.button('Train') to run a
model.
→
3. Predict
Show results with st.metric &
st.progress .
Demo Output: 0.92 F1 Score i
ML Model Playground: Upload Train
→ →
Predict
26.
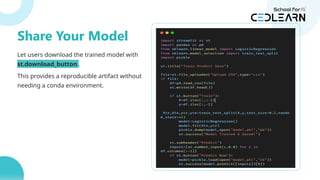
Let users downloadthe trained model with
st.download_button .
This provides a reproducible artifact without
needing a conda environment.
buffer = io.BytesIO()
joblib.dump(model, buffer)
st.download_button(
label="Download Model",
data=buffer.getvalue(),
file_name="model.pkl"
)
Share Your Model
Never hard-code passwords.Use
.streamlit/secrets.toml.
# .streamlit/secrets.toml
db_username = "admin"
db_password = "super_secret"
Access them via st.secrets .
conn = connect(
st.secrets['db_username'],
st.secrets['db_password']
)
→ On Streamlit Cloud, secrets are auto-injected. No .env files needed.
Secrets & Config
29.
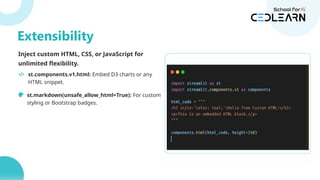
Inject custom HTML,CSS, or JavaScript for
unlimited flexibility.
st.components.v1.html: Embed D3 charts or any
HTML snippet.
st.markdown(unsafe_allow_html=True): For custom
styling or Bootstrap badges.
st.components.v1.html(
'
',
height=600
)
Extensibility
Create a professional,branded look with a simple
config.toml file.
# .streamlit/config.toml
[theme]
primaryColor = '#4AC4C6'
backgroundColor = '#FFFFFF'
secondaryBackgroundColor = '#E1F5FE'
textColor = '#282828'
→ Instant corporate feel, compliant with color-blind
norms.
Polish: Theme Hacks
32.
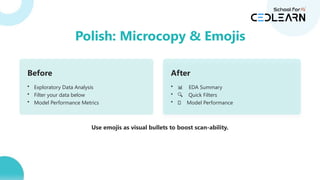
Before
• Exploratory DataAnalysis
• Filter your data below
• Model Performance Metrics
After
• 📊 EDA Summary
• 🔍 Quick Filters
• 🤖 Model Performance
Use emojis as visual bullets to boost scan-ability.
Polish: Microcopy & Emojis
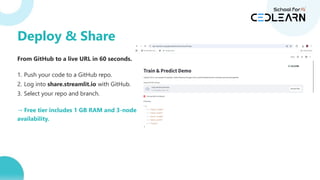
From GitHub toa live URL in 60 seconds.
1. Push your code to a GitHub repo.
2. Log into share.streamlit.io with GitHub.
3. Select your repo and branch.
→ Free tier includes 1 GB RAM and 3-node
availability.
Deploy & Share
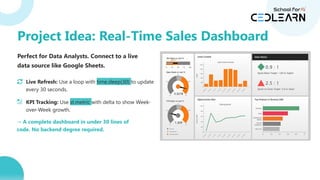
Perfect for DataAnalysts. Connect to a live
data source like Google Sheets.
Live Refresh: Use a loop with time.sleep(30) to update
every 30 seconds.
KPI Tracking: Use st.metric with delta to show Week-
over-Week growth.
→ A complete dashboard in under 30 lines of
code. No backend degree required.
Project Idea: Real-Time Sales Dashboard
37.
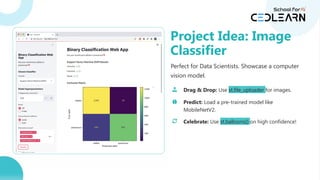
Perfect for DataScientists. Showcase a computer
vision model.
Drag & Drop: Use st.file_uploader for images.
Predict: Load a pre-trained model like
MobileNetV2.
Celebrate: Use st.balloons() on high confidence!
Project Idea: Image
Classifier
38.
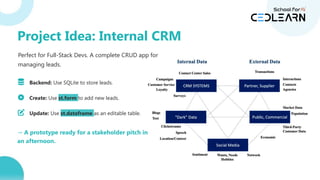
Perfect for Full-StackDevs. A complete CRUD app for
managing leads.
Backend: Use SQLite to store leads.
Create: Use st.form to add new leads.
Update: Use st.dataframe as an editable table.
→ A prototype ready for a stakeholder pitch in
an afternoon.
Project Idea: Internal CRM


![Matplotlib (Boilerplate)
fig, ax = plt.subplots()
ax.plot(df['date'], df['sales'])
ax.set_xlabel('Date')
ax.set_ylabel('Sales')
ax.set_title('Sales Over Time')
st.pyplot(fig)
Streamlit (Simple)
st.line_chart(df.set_index('date'))
Charts in One Line: Pandas + Streamlit](https://image.slidesharecdn.com/streamlitppt-251125071729-7b8a302f/85/Streamlit_-detailed-versions-and-techniquesPPT-pptx-19-320.jpg)


![Never hard-code passwords. Use
.streamlit/secrets.toml.
# .streamlit/secrets.toml
db_username = "admin"
db_password = "super_secret"
Access them via st.secrets .
conn = connect(
st.secrets['db_username'],
st.secrets['db_password']
)
→ On Streamlit Cloud, secrets are auto-injected. No .env files needed.
Secrets & Config](https://image.slidesharecdn.com/streamlitppt-251125071729-7b8a302f/85/Streamlit_-detailed-versions-and-techniquesPPT-pptx-28-320.jpg)

![Create a professional, branded look with a simple
config.toml file.
# .streamlit/config.toml
[theme]
primaryColor = '#4AC4C6'
backgroundColor = '#FFFFFF'
secondaryBackgroundColor = '#E1F5FE'
textColor = '#282828'
→ Instant corporate feel, compliant with color-blind
norms.
Polish: Theme Hacks](https://image.slidesharecdn.com/streamlitppt-251125071729-7b8a302f/85/Streamlit_-detailed-versions-and-techniquesPPT-pptx-31-320.jpg)


![제 23회 보아즈(BOAZ) 빅데이터 컨퍼런스 - [MBOAX] : ABSA를 활용한 소비자 반응 분석 기반 운영 효율화 대시보드 설계](https://cdn.slidesharecdn.com/ss_thumbnails/3-1boaz23rdconferencemboax-260203102709-9d519923-thumbnail.jpg?width=640&height=640&fit=bounds)


