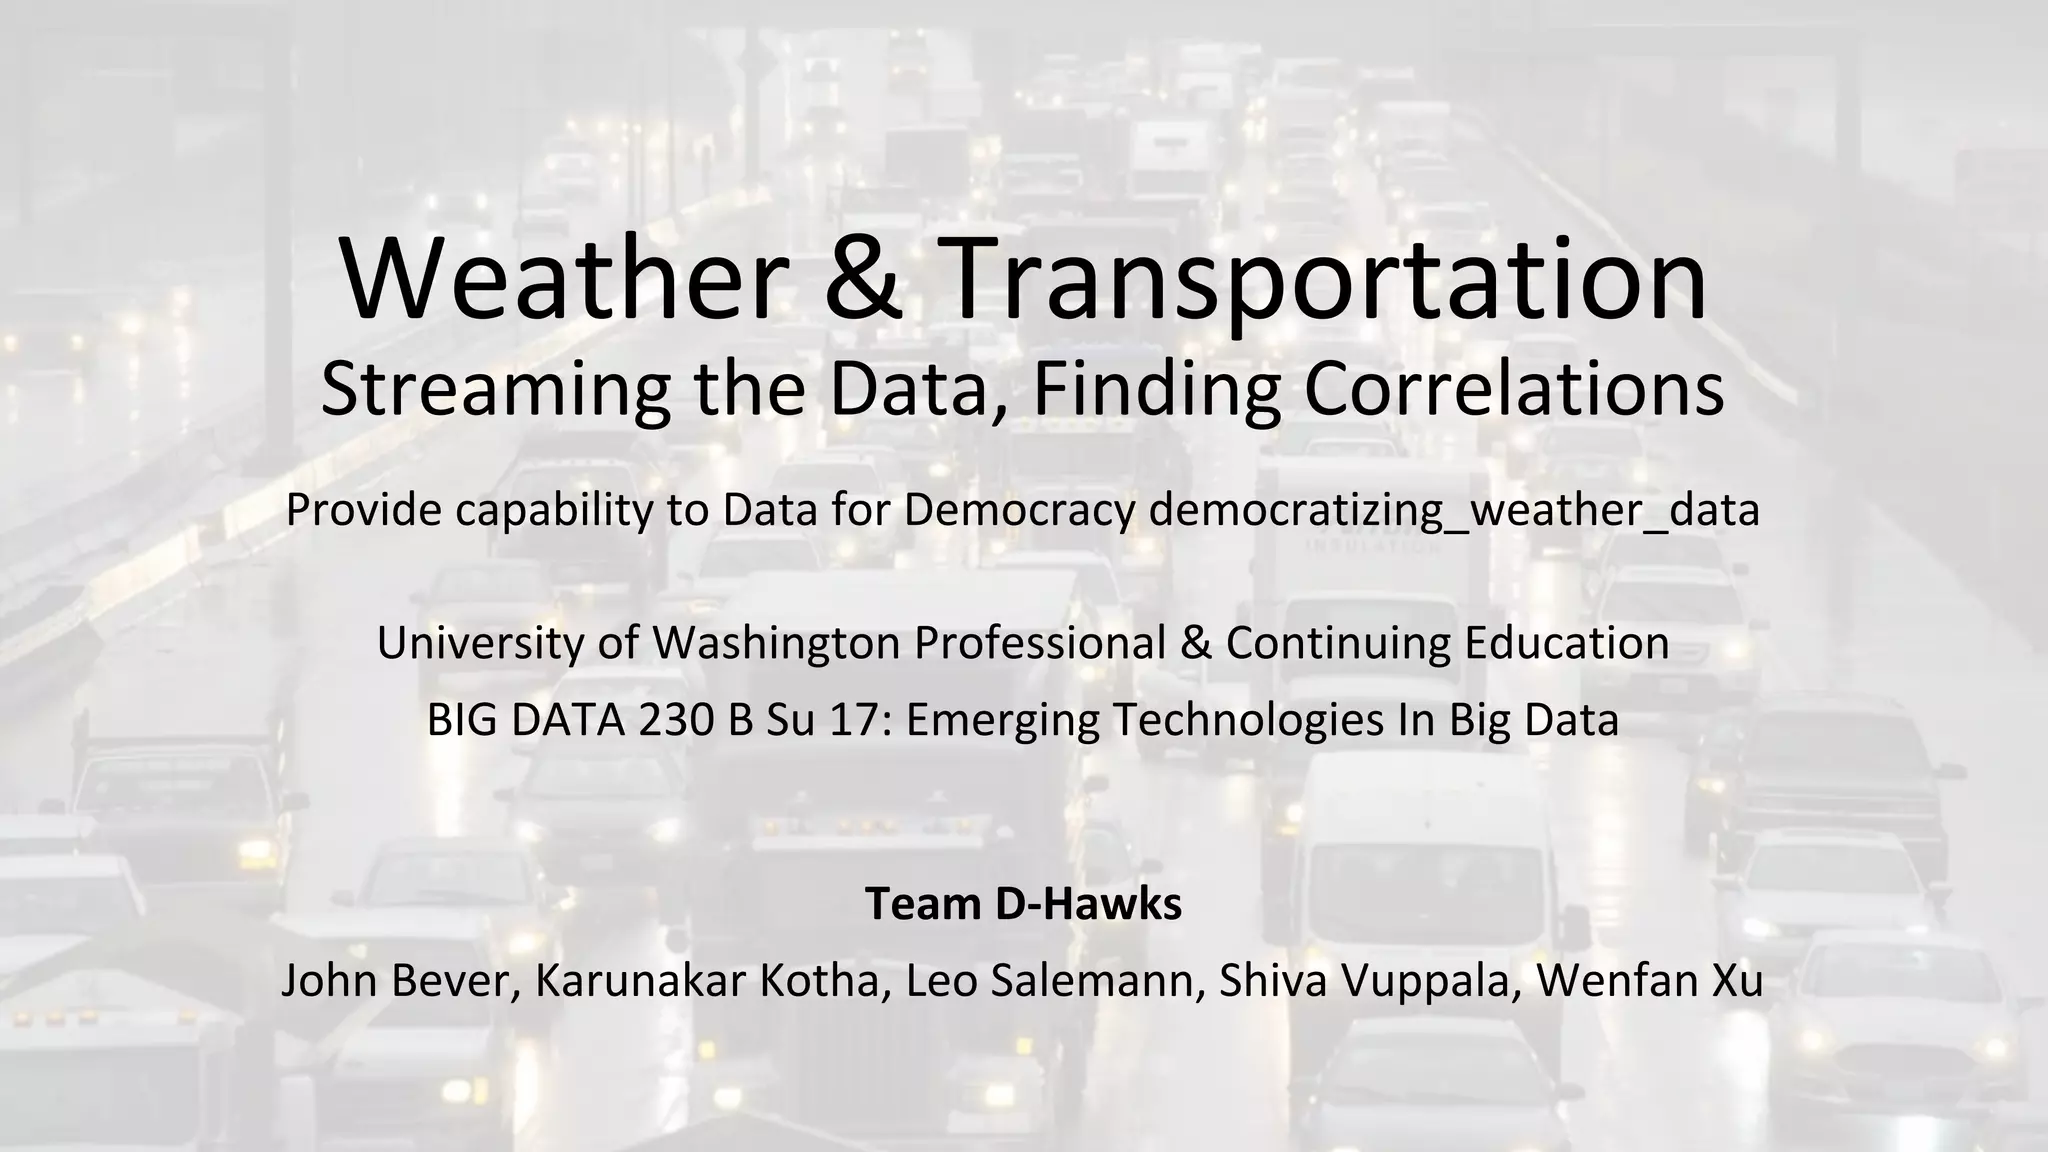
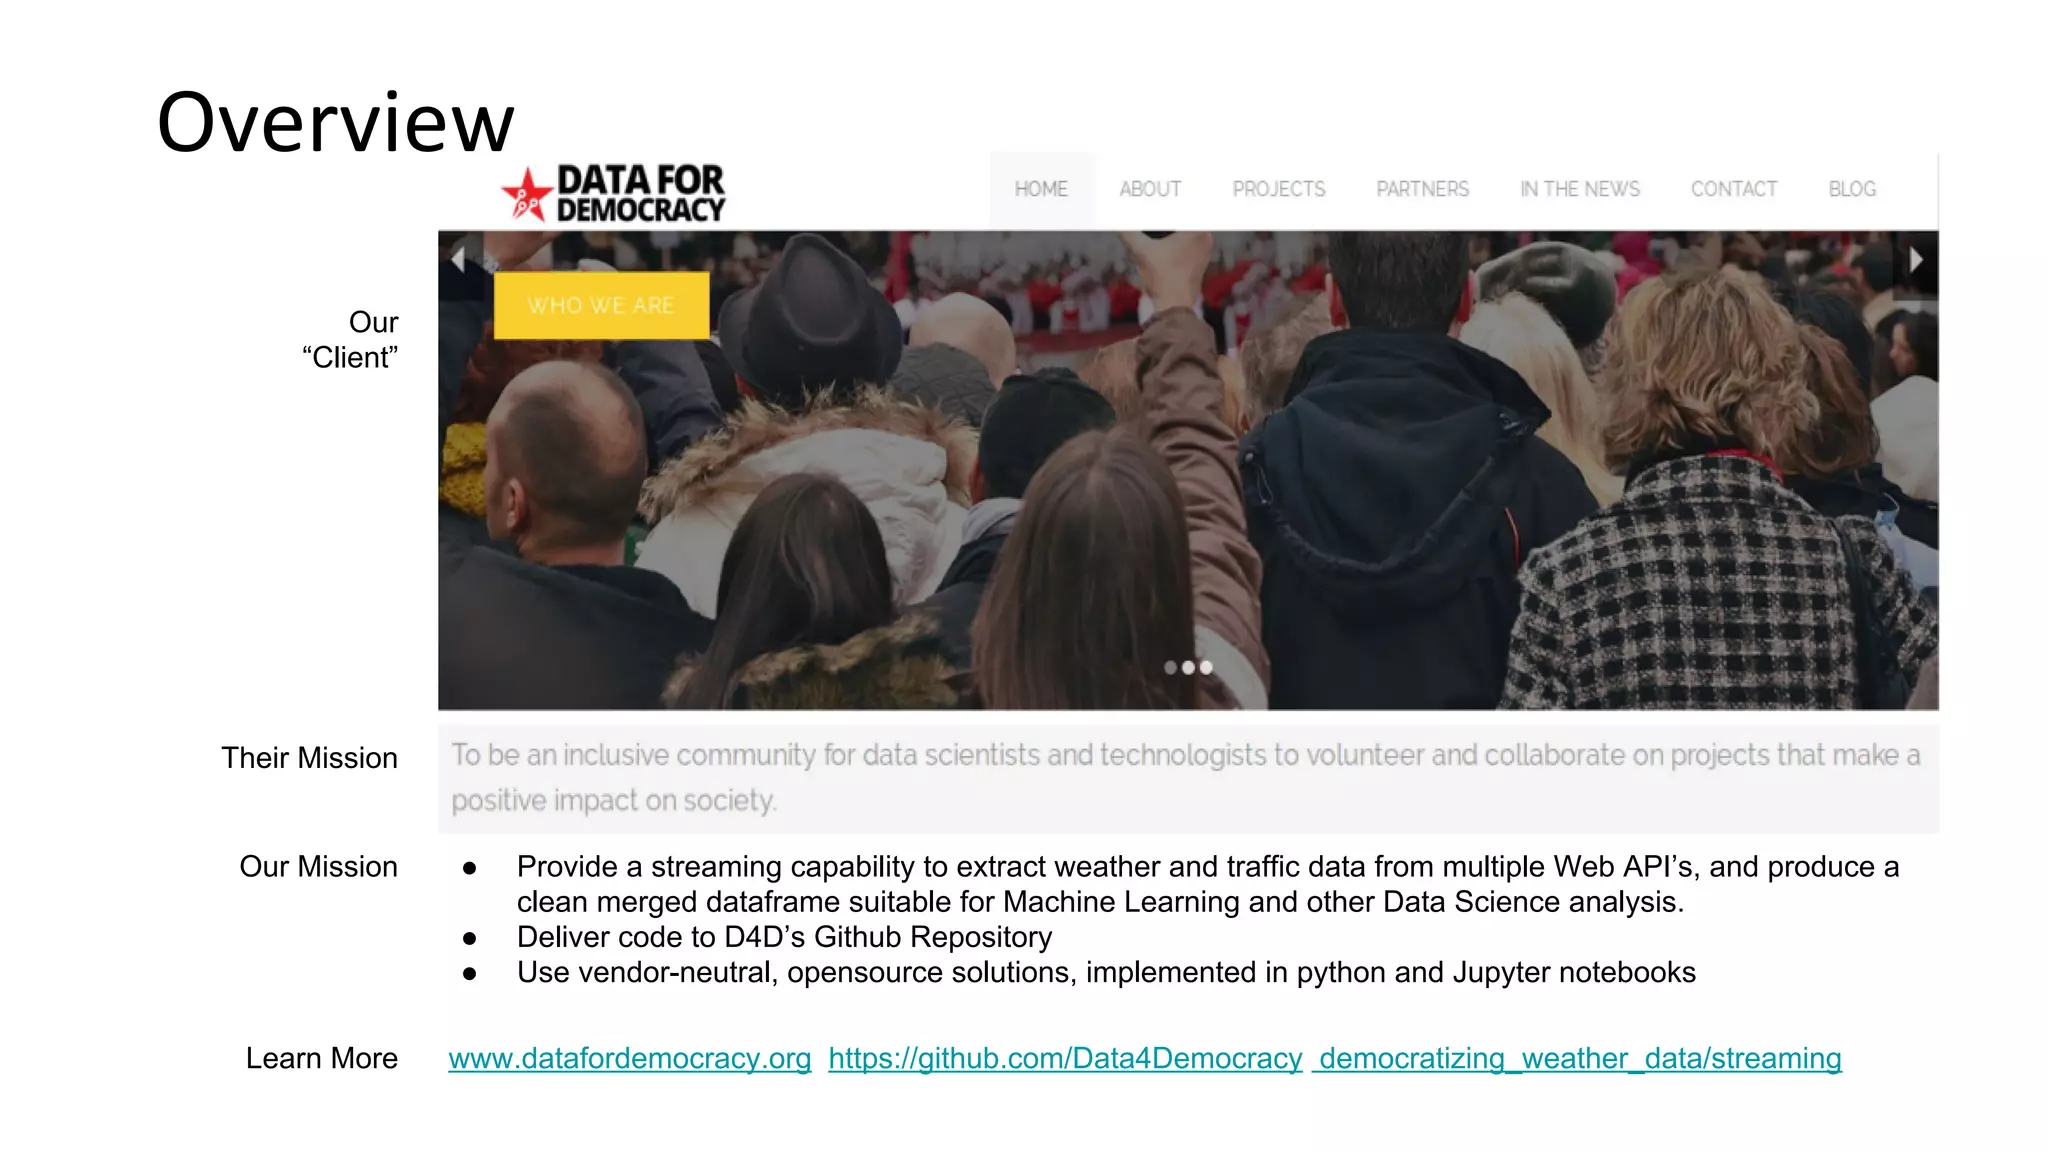
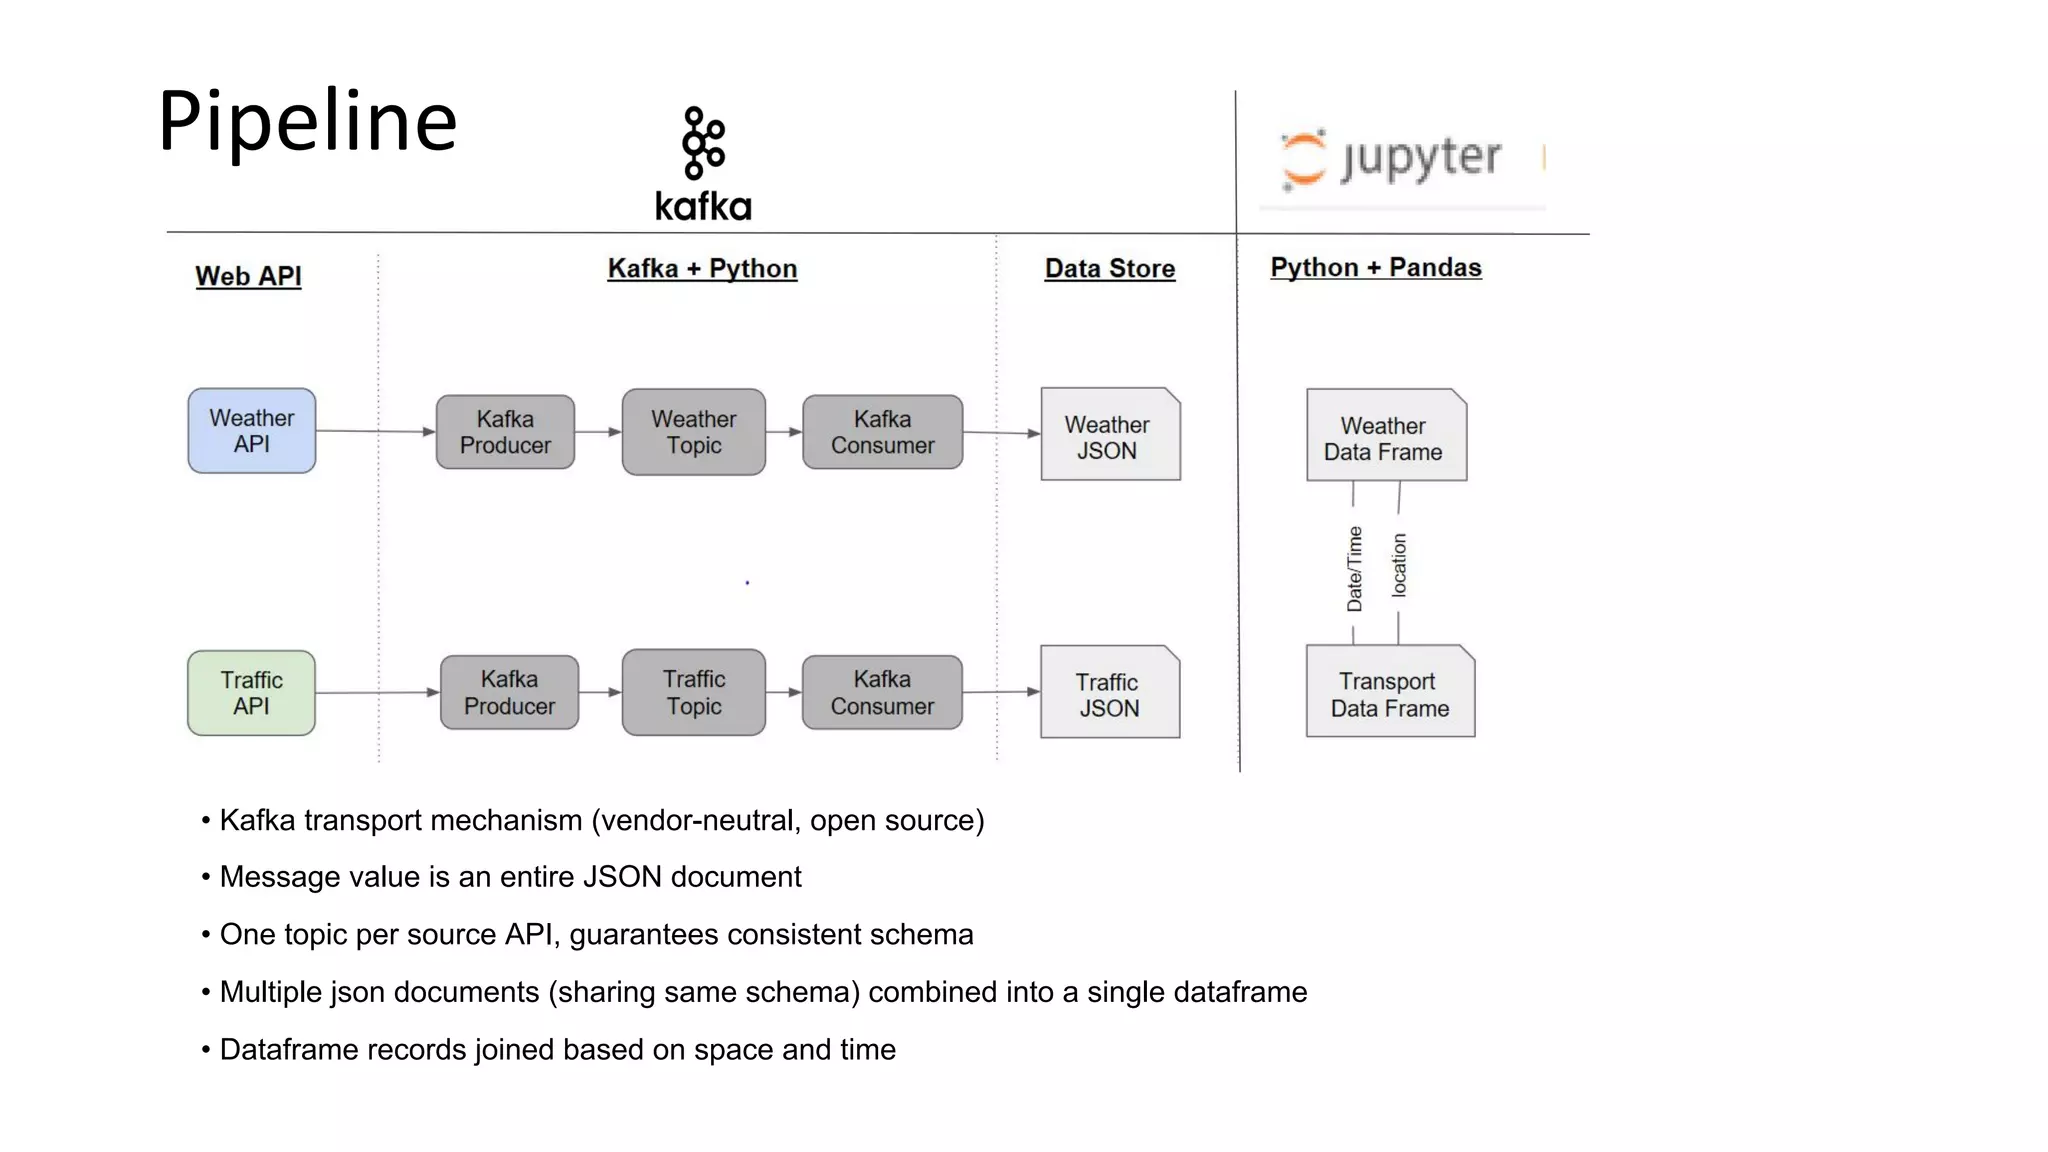
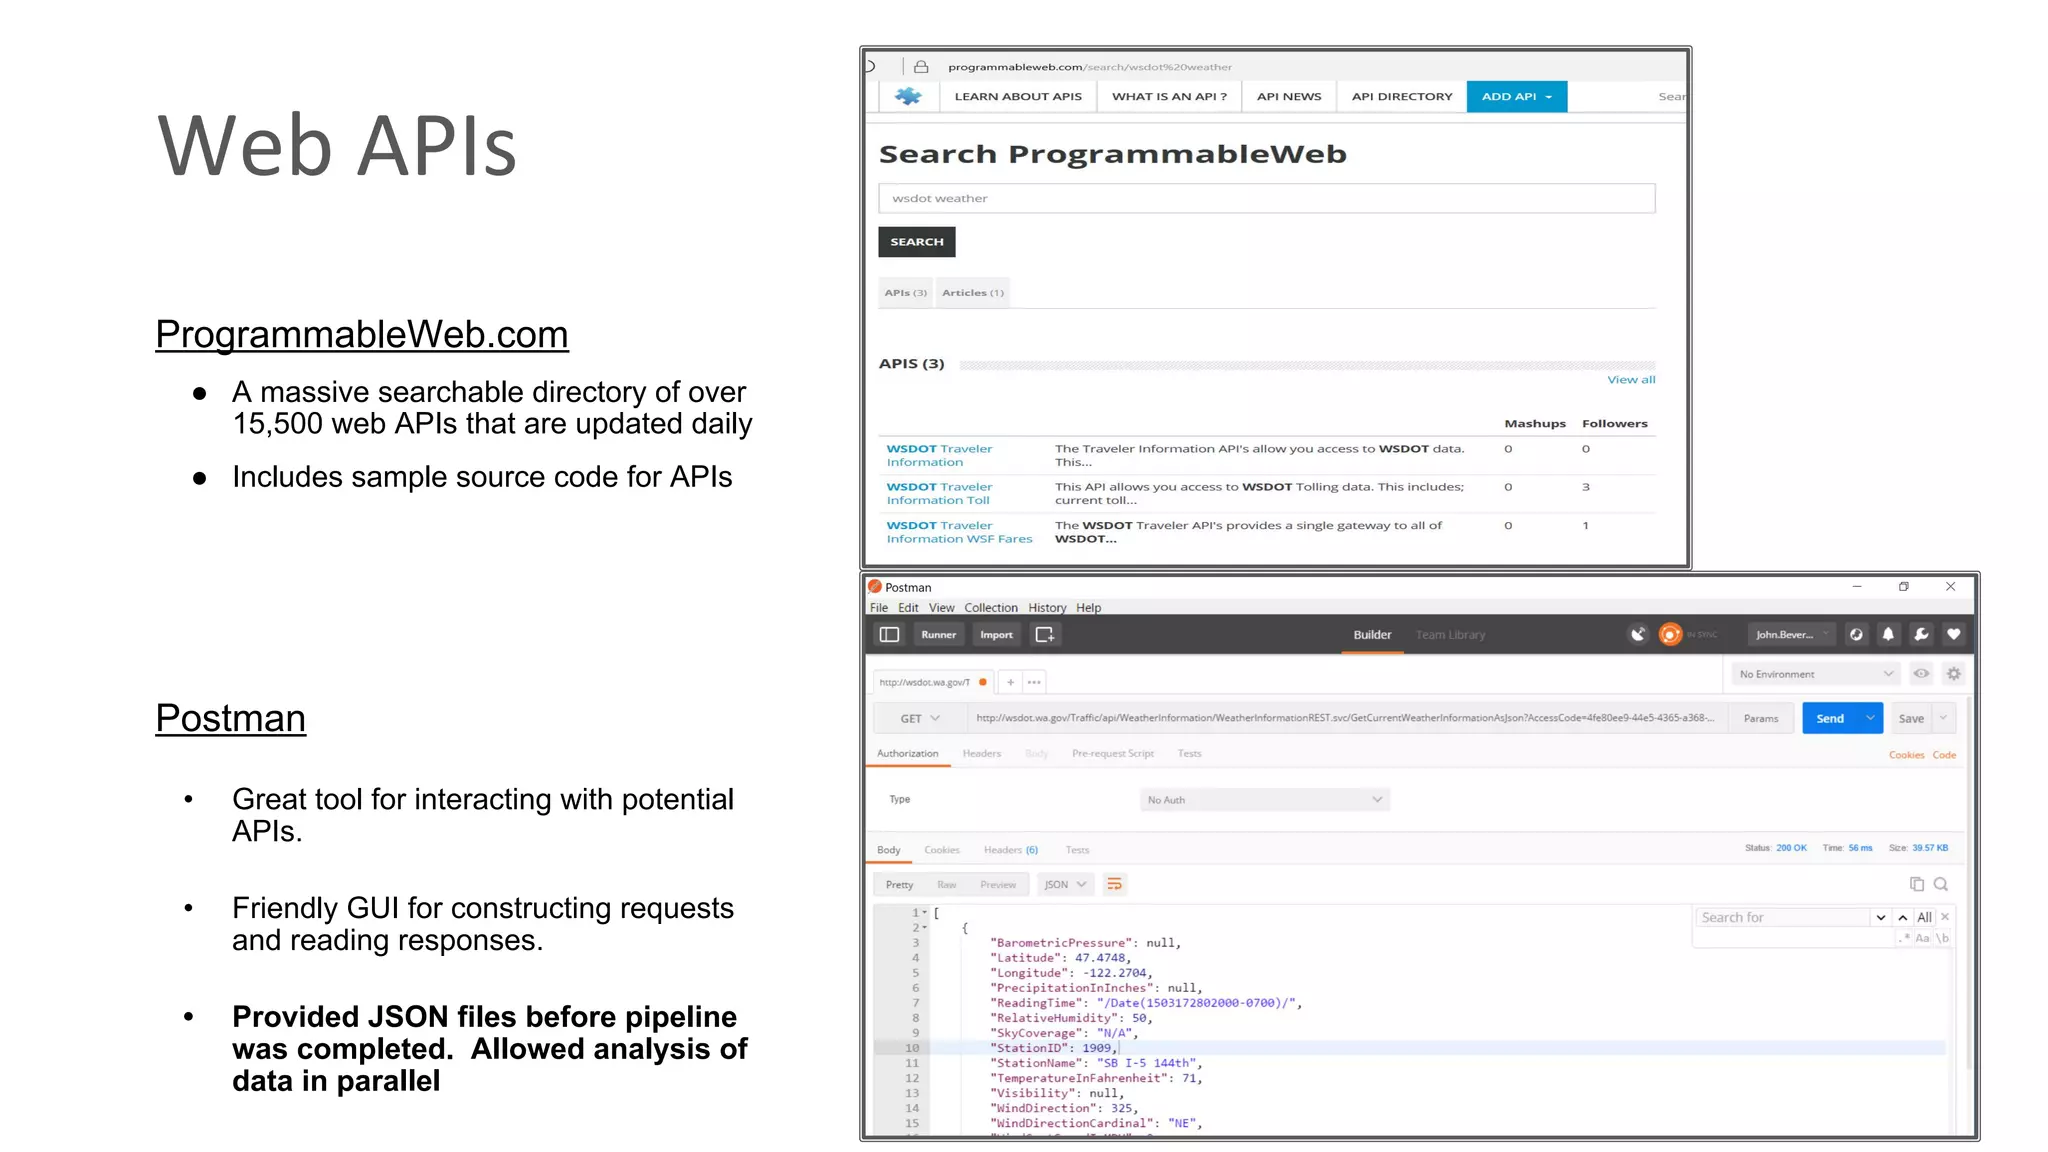
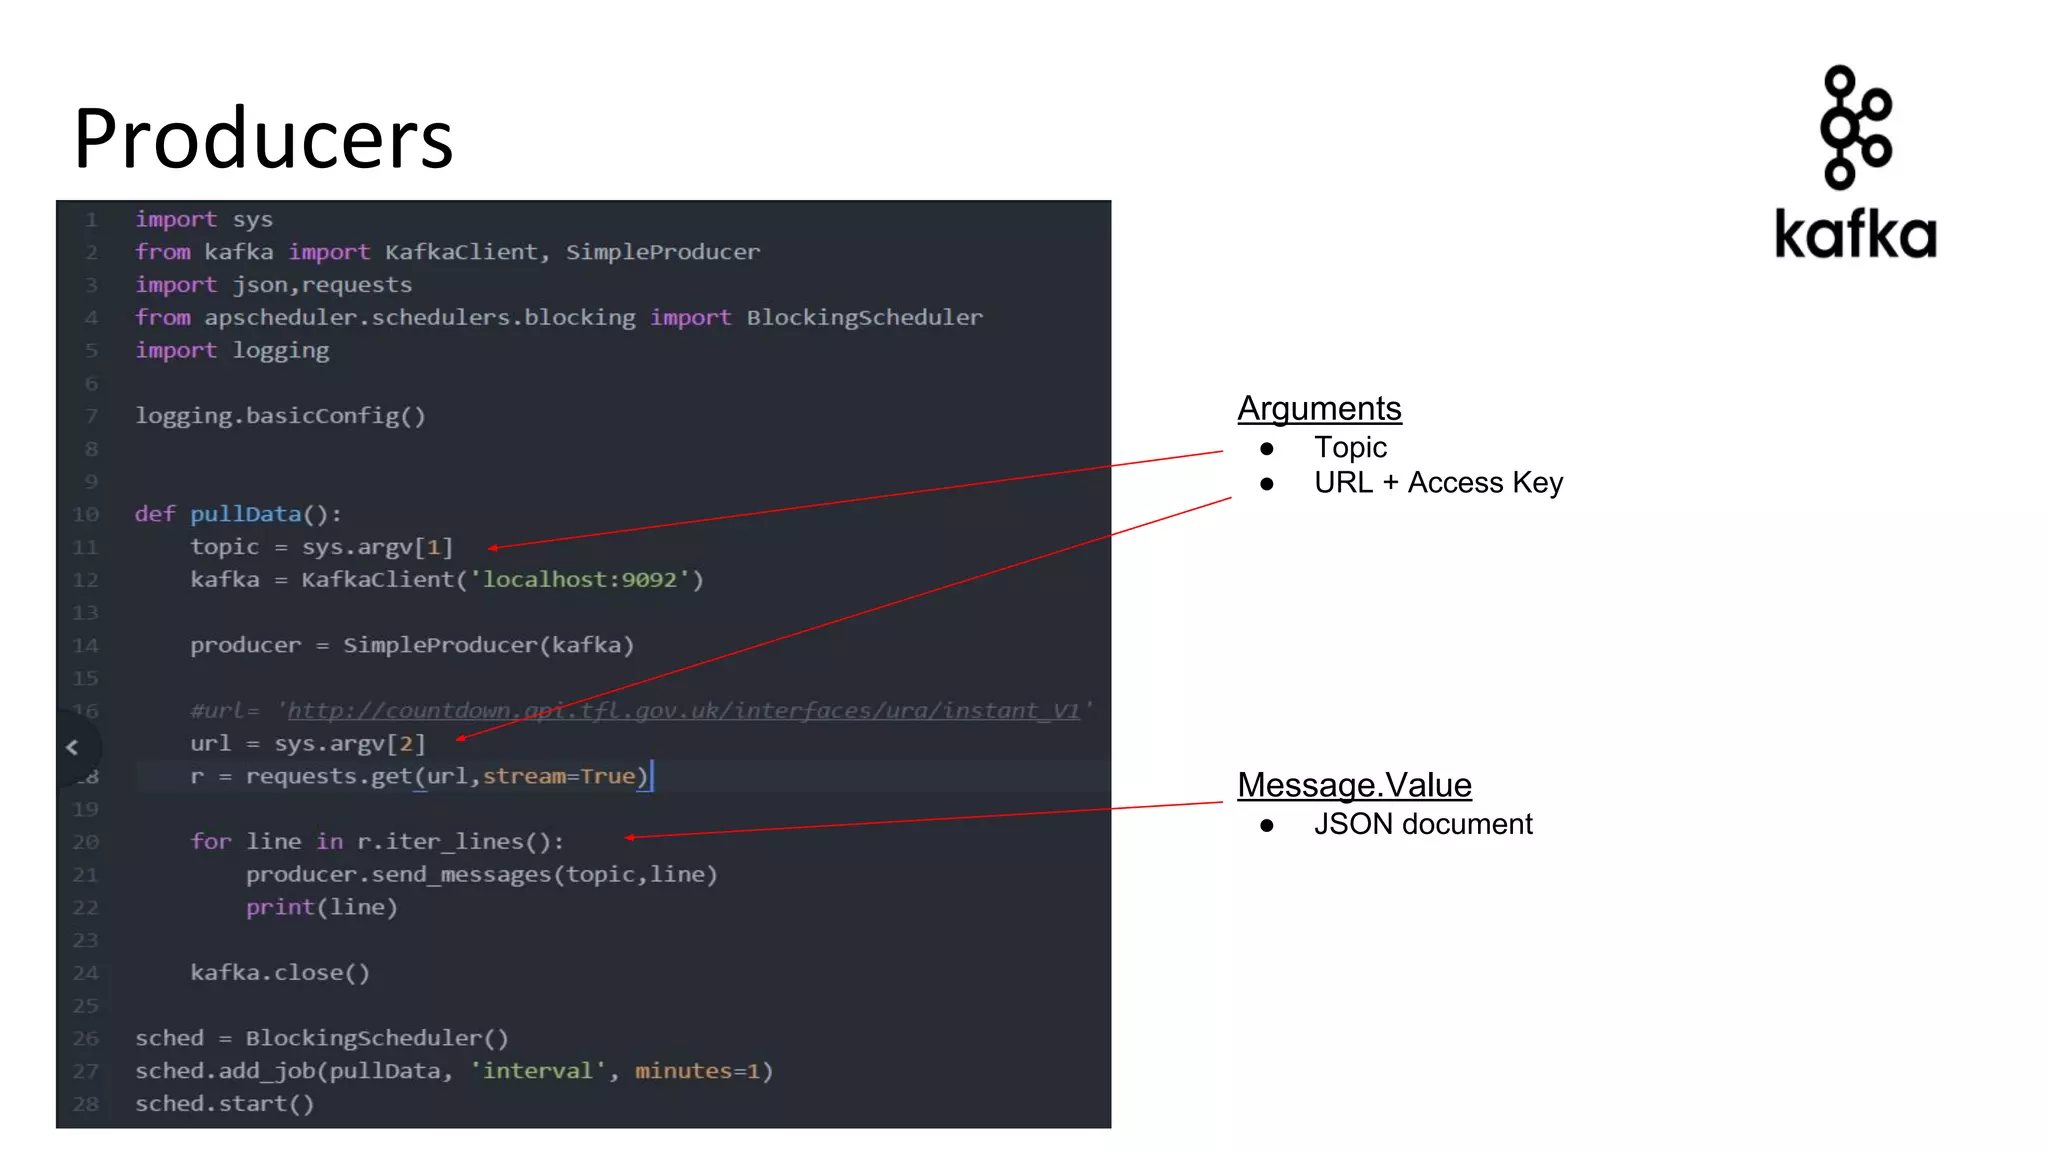
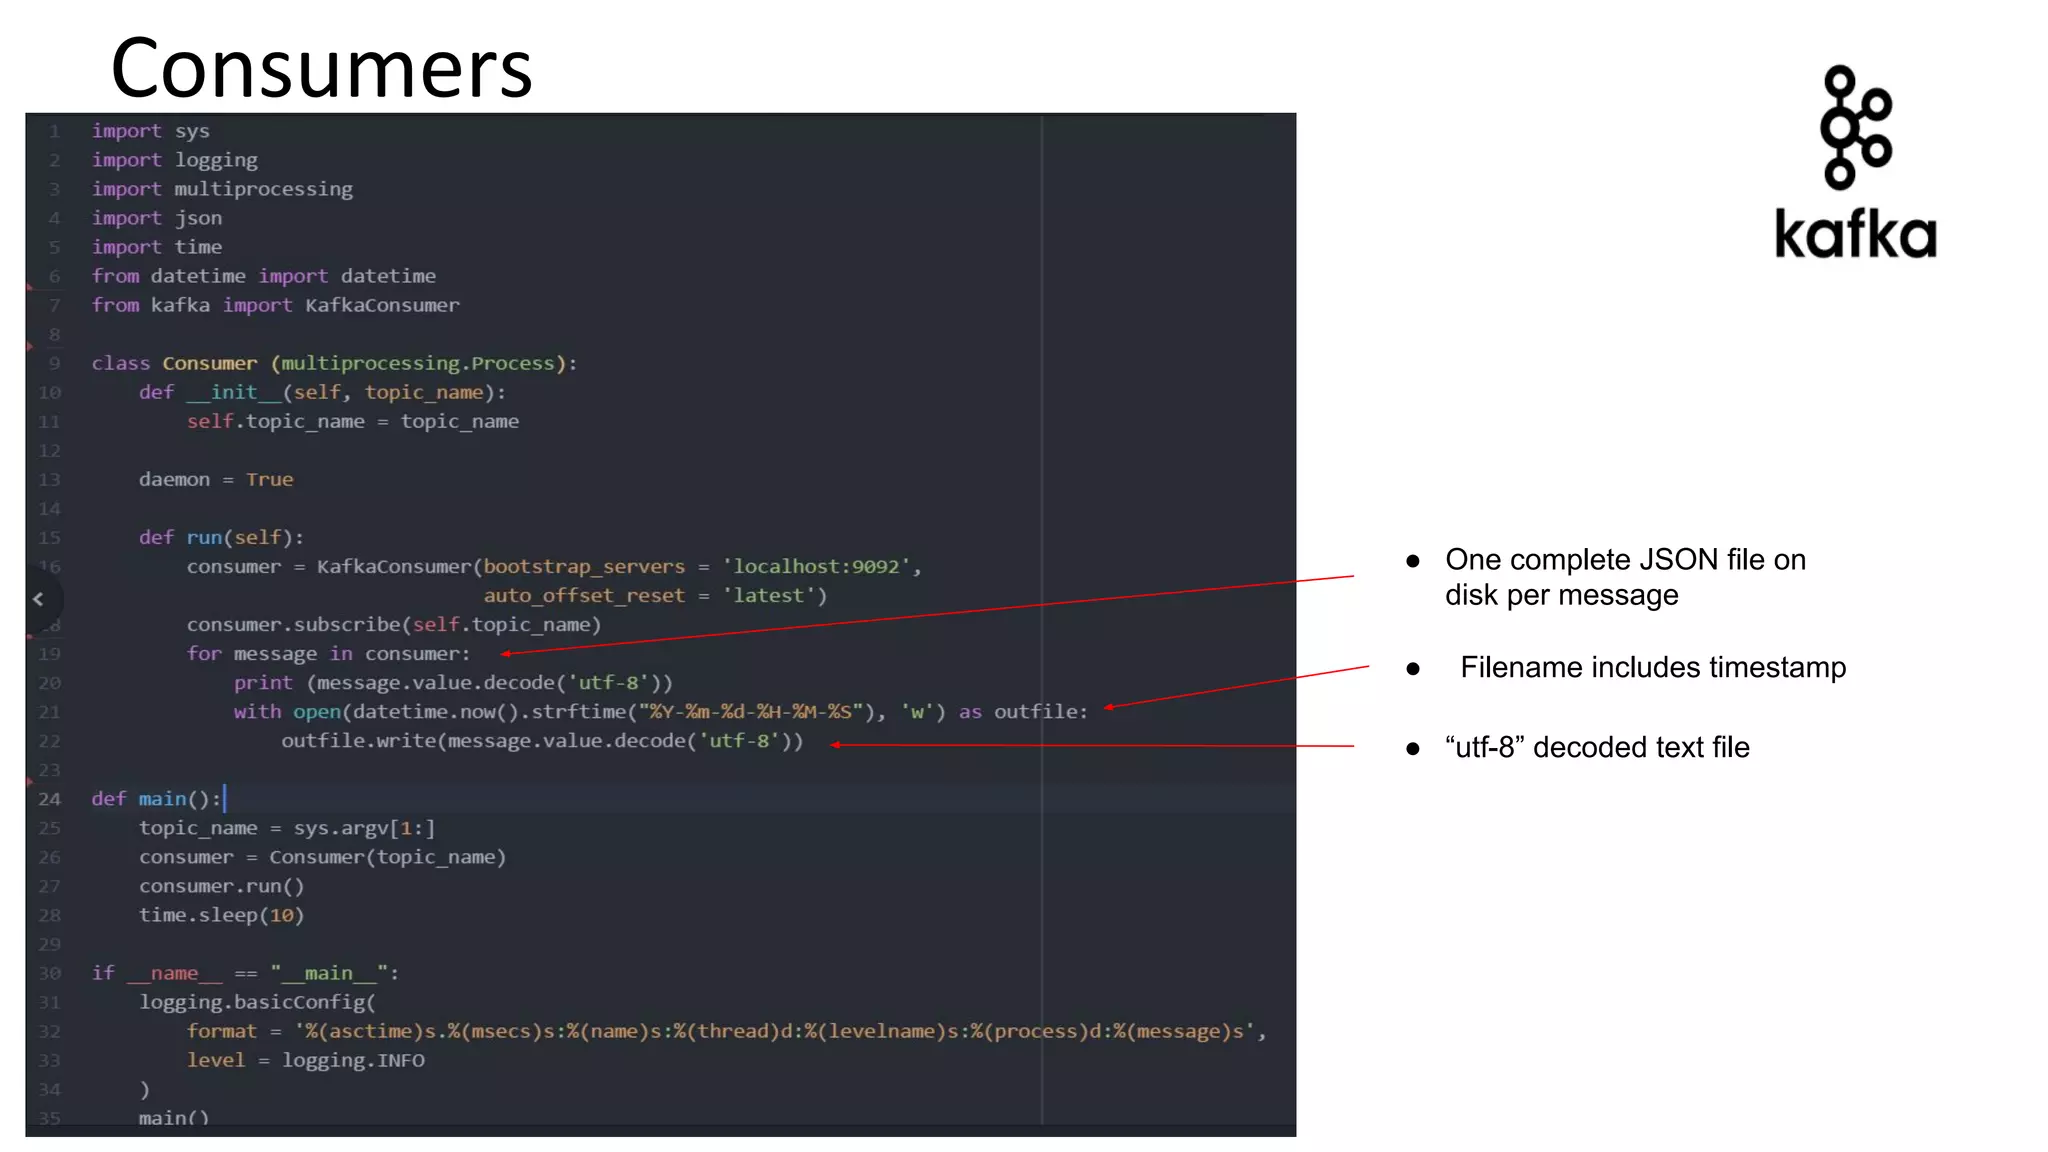
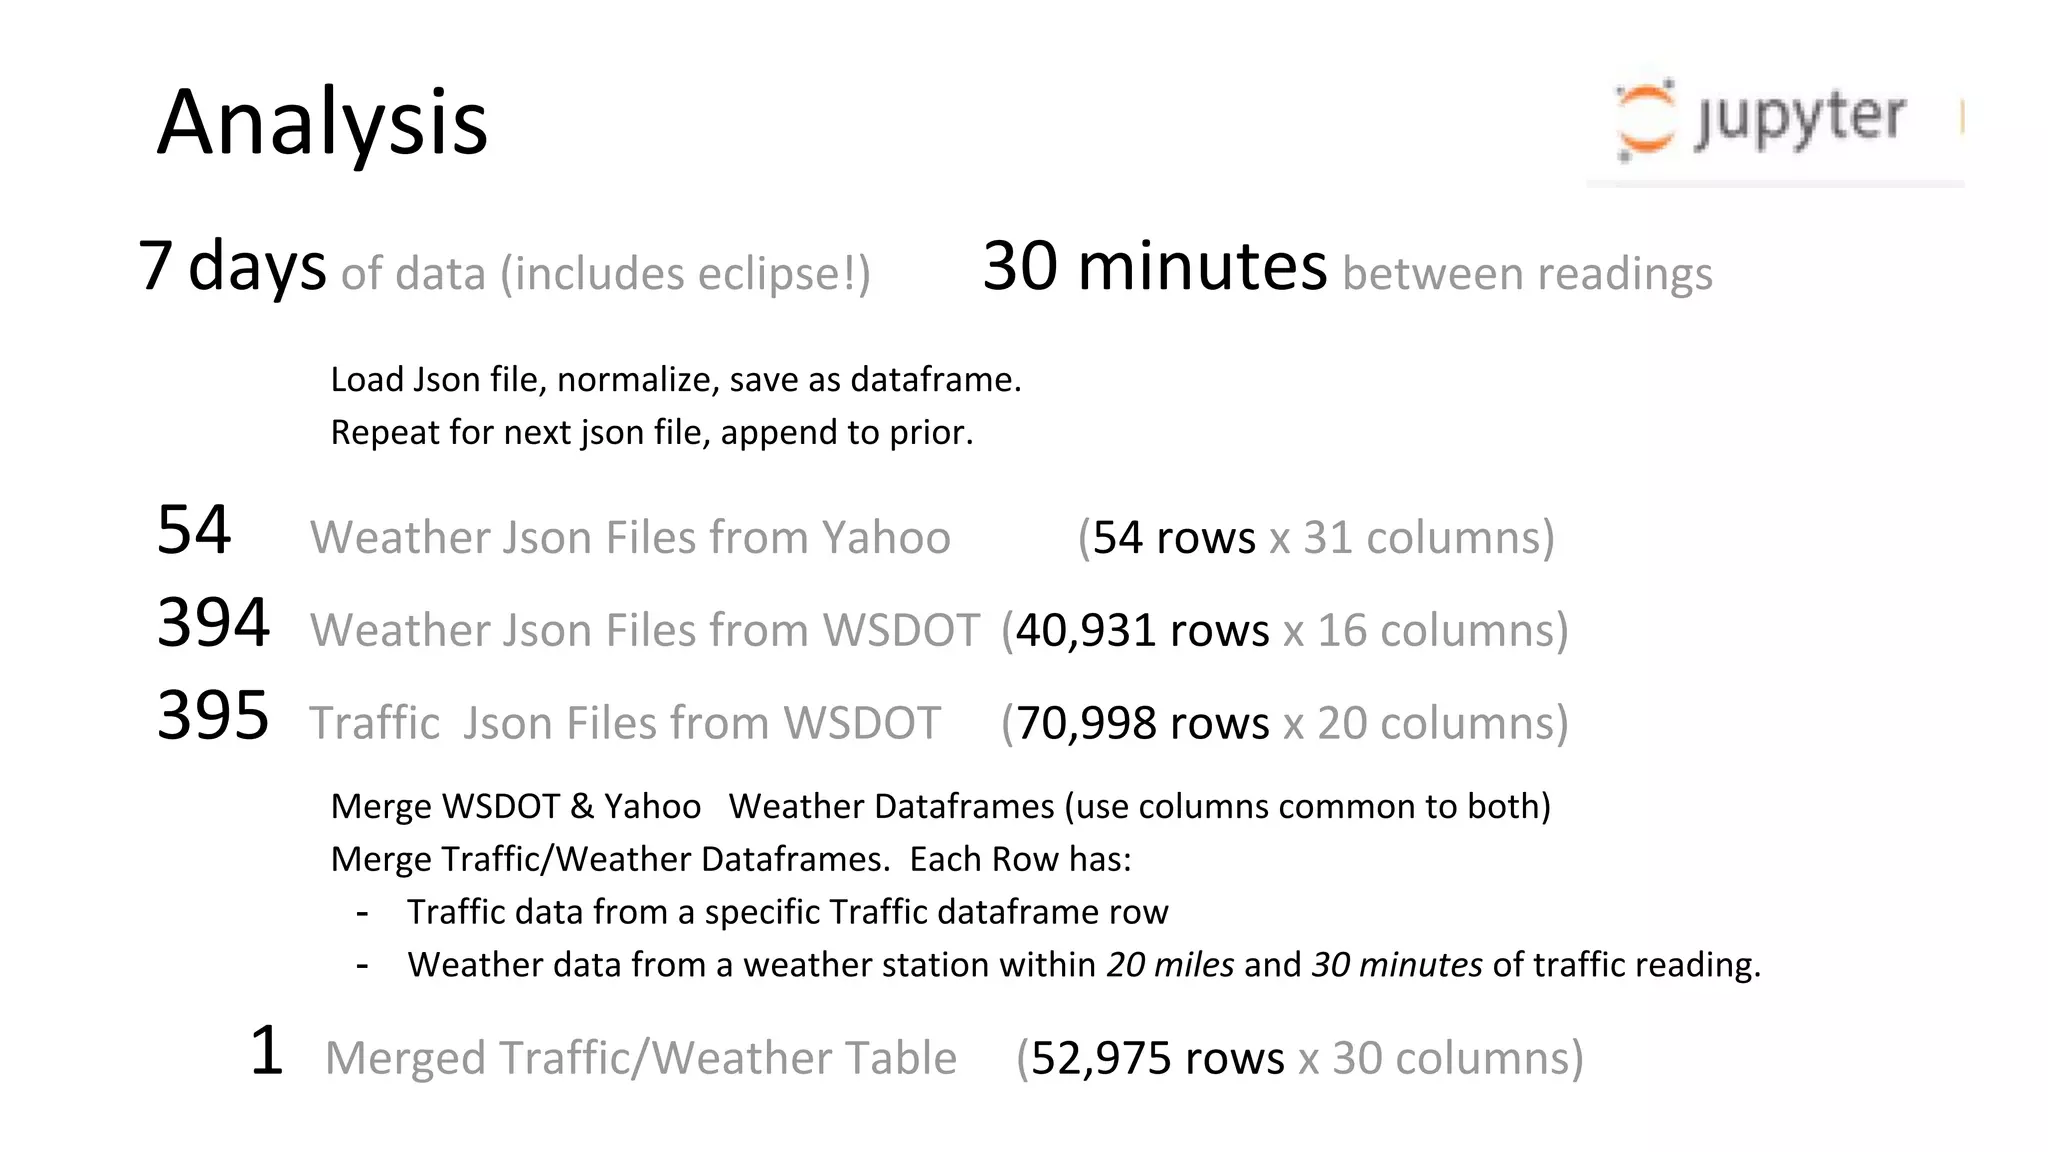
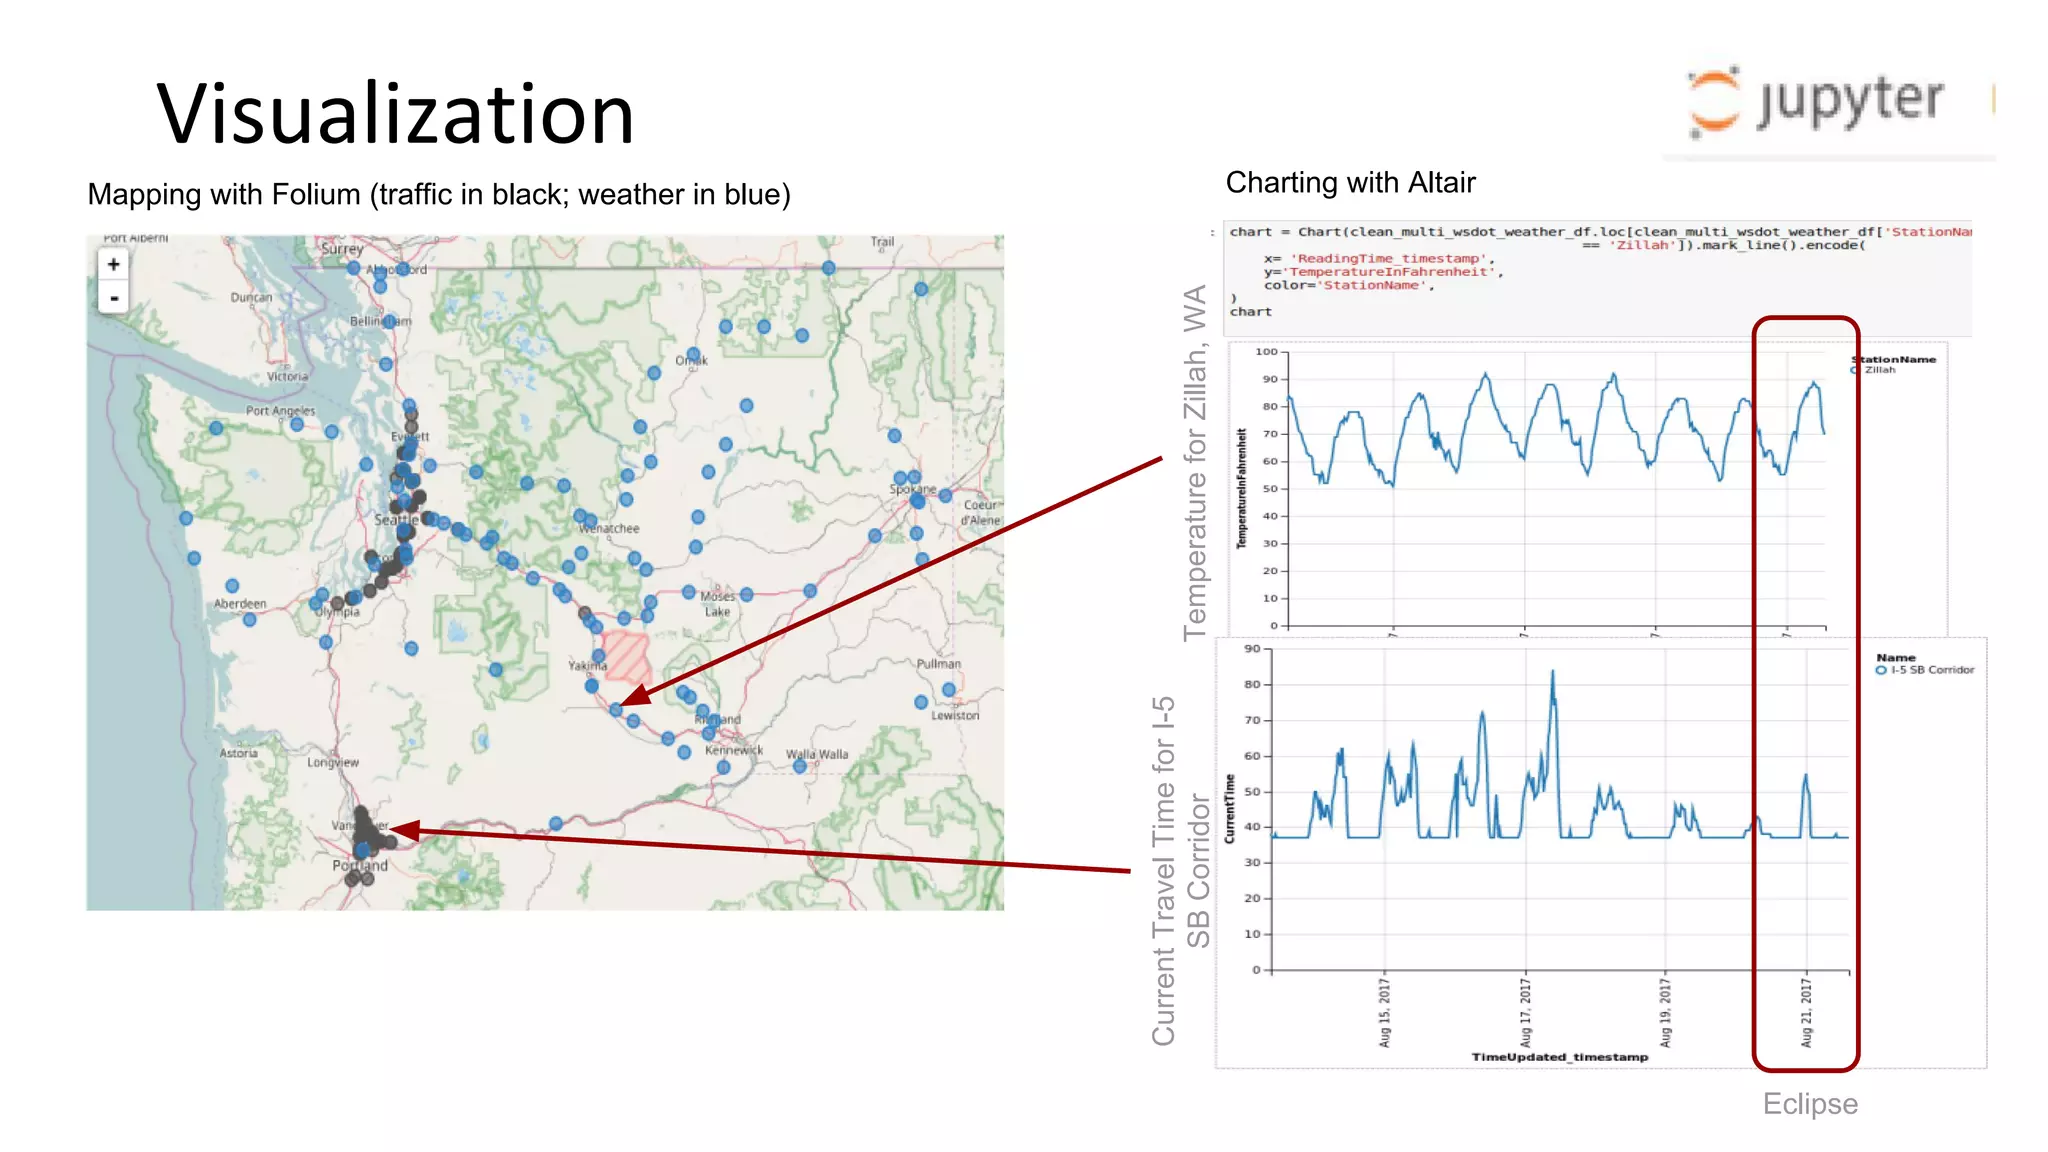
The document outlines a project by the University of Washington's Data for Democracy team to create a streaming capability that combines weather and traffic data from multiple web APIs for machine learning and data science purposes. It details the technical workflow, including the use of Kafka for data transport and the merging of datasets, resulting in a comprehensive dataframe for analysis. Key takeaways emphasize the careful selection of Python libraries and the methodology for data handling and visualization.
![Wrapping Up ...
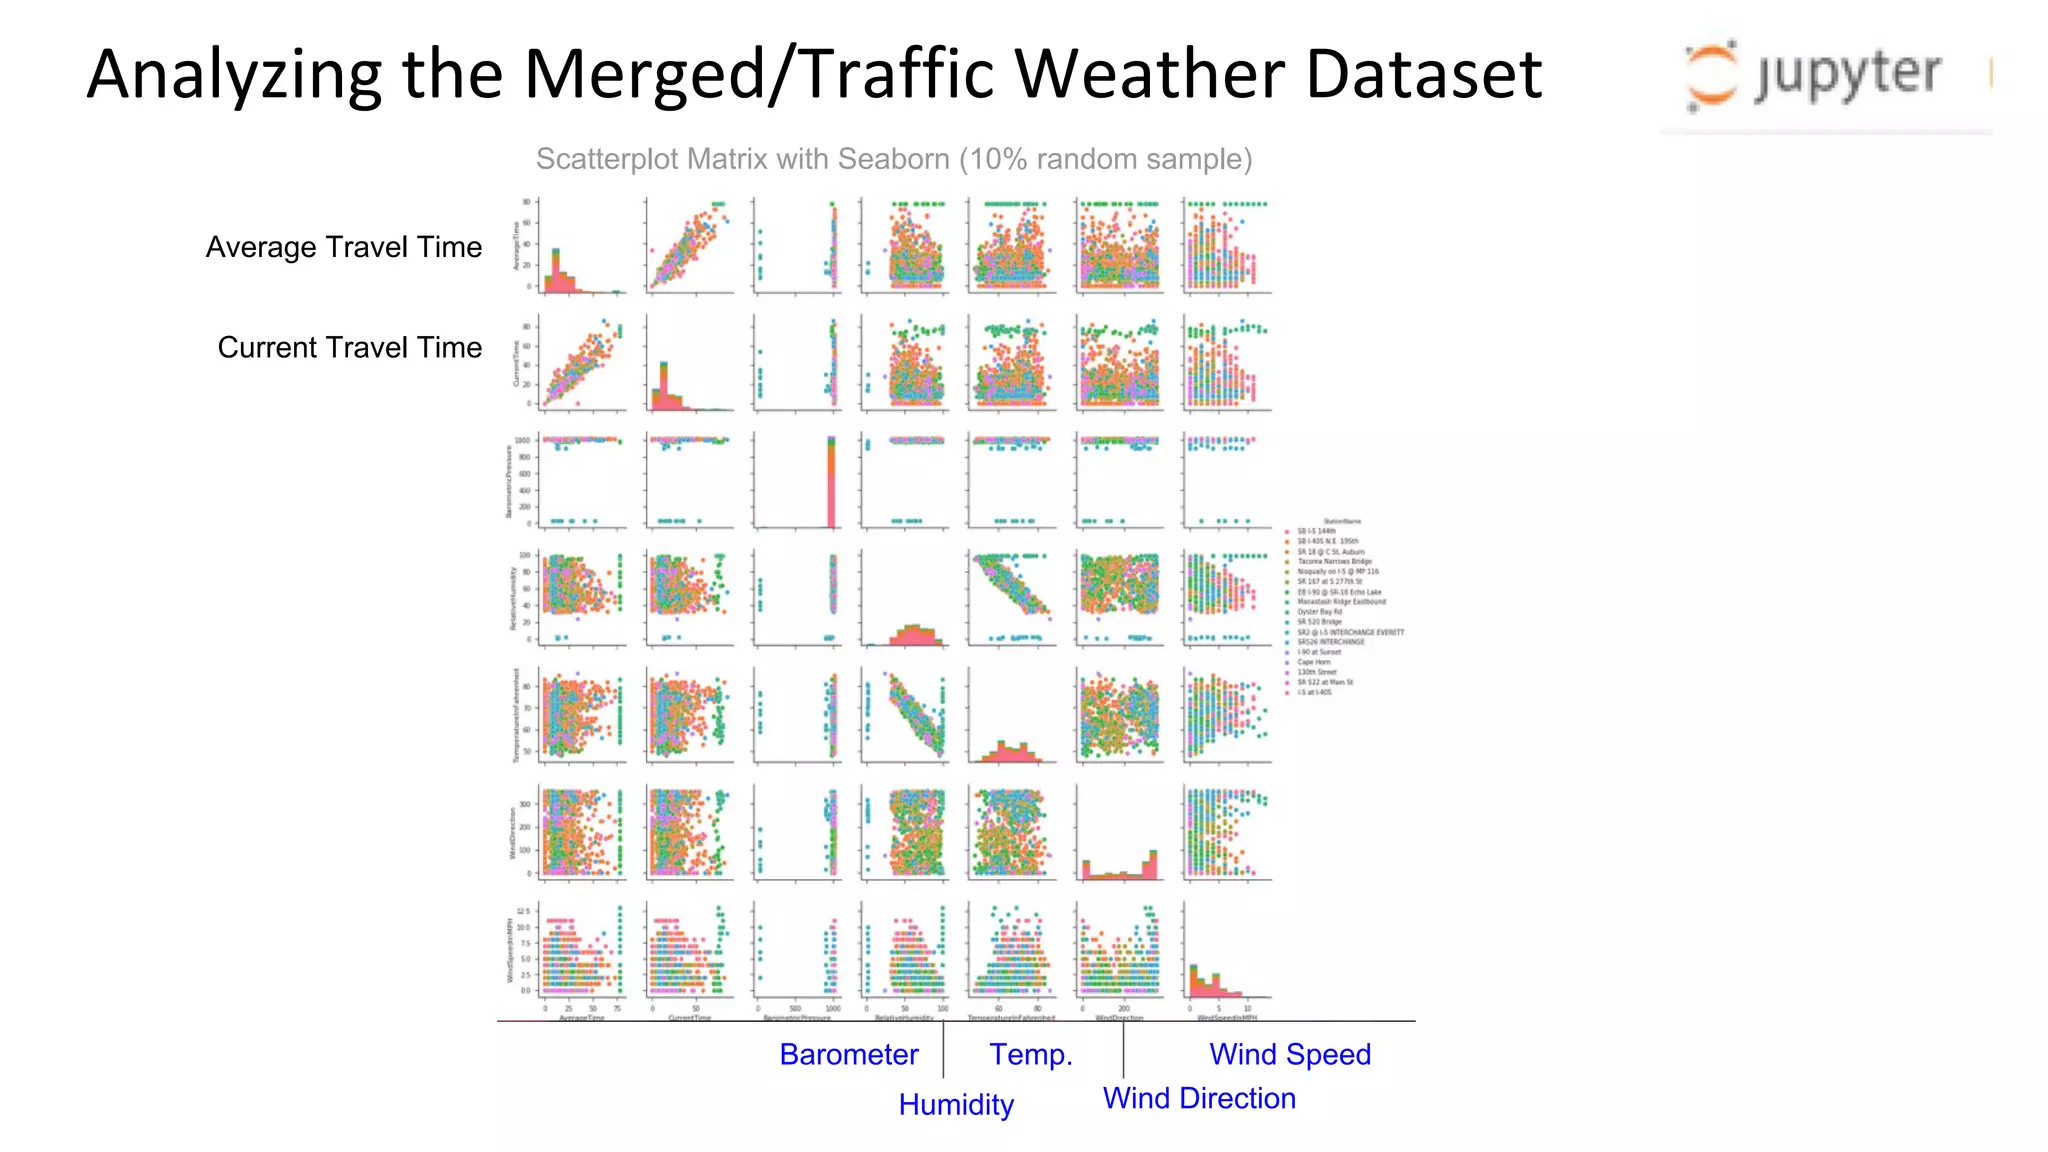
Key Takeaways
• Choose your python libraries carefully (2 lines of code for a fully-labeled lineplot vs. dozens)
• Spatial plots first, data-joins later (I-5 traffic data vs. statewide weather, also Portland)
• The fastest way to count records in a dataframe is df.shape[0]
Conclusion
• Data for Democracy has a repeatable way to extract weather and transportation data from WSDOT and Yahoo
• Jupyter Notebook provides a teaching/coding environment
• Bitnami provides low-cost simple Kafka infrastructure
Further Work
• Upload csv and zipped json’s to data.world
• Better parameters for Producer scripts (ex. Longitude, Latitude, Date, Time)
• Config files for access keys
• More matrix plots, Data Science, Machine Learning
•Gather data for longer time frames (fewer readings per day?)
•Isolate matrix plots to specific locations and/or time.](https://image.slidesharecdn.com/bigdatasu17outbrief-171006045609-171012053400/75/Streaming-Weather-Data-from-Web-APIs-to-Jupyter-through-Kafka-10-2048.jpg)


![Test-driven Assessment of [R2]RML Mappings to Improve Dataset Quality](https://cdn.slidesharecdn.com/ss_thumbnails/poster2-151007084849-lva1-app6892-thumbnail.jpg?width=640&height=640&fit=bounds)


![[DSC Europe 25] Vid Stimac - Policy Parsimony: Between Oversimplifying and Ov...](https://cdn.slidesharecdn.com/ss_thumbnails/eqlepagzqp2rhg3gbluh-dsc-stimac-251120-251205090438-059e7f54-thumbnail.jpg?width=640&height=640&fit=bounds)

![[DSC Europe 25] Goran Obradovic - The Rise of Sovereign AI: Building the Regi...](https://cdn.slidesharecdn.com/ss_thumbnails/7nw2xxixrxqdxvrb5wca-6-251205085714-ab09a2ac-thumbnail.jpg?width=640&height=640&fit=bounds)


![[DSC Europe 25] Jim Sterne - Adopting Generative AI Capabilities Into the Ent...](https://cdn.slidesharecdn.com/ss_thumbnails/sxhpofuorcagxsaulkmt-3-251204082258-7e66bc48-thumbnail.jpg?width=640&height=640&fit=bounds)
![[DSC Europe 25] Dragan Vucic - Building the Learning Organization - How AI Tr...](https://cdn.slidesharecdn.com/ss_thumbnails/8brigo2sbu6qur6gxrra-7-251205085715-6ae07d24-thumbnail.jpg?width=640&height=640&fit=bounds)


![[DSC Europe 25] Andy Cotgreave - Nothing is new in analytics.pptx](https://cdn.slidesharecdn.com/ss_thumbnails/mba4vzcurvoh5lfrd5zw-6-251205194645-341bbbbe-thumbnail.jpg?width=640&height=640&fit=bounds)

