Download to read offline

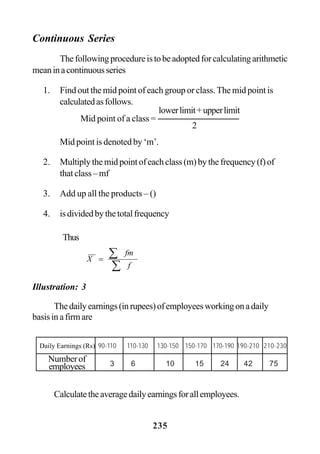
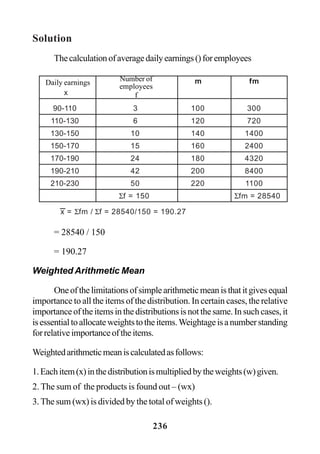
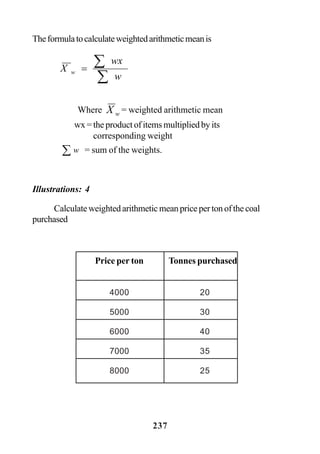
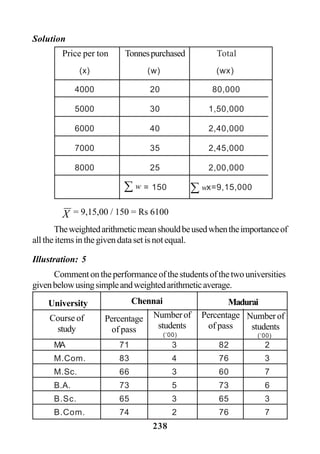
![63
Thus national income is the aggregate summation of income or
expendituremadethroughthesefourcomponents,consumers(C),investors
(I), government (G) and foreign trade (Exports [X] – Imports [M] )
Methods of Calculating National Income
There are three different methods of calculating national income.
Theyare
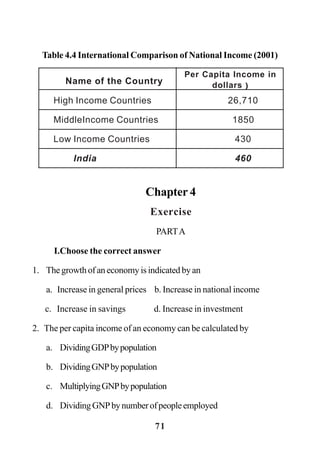
1. Product or Output Method
2. Income Method
3. Expenditure Method
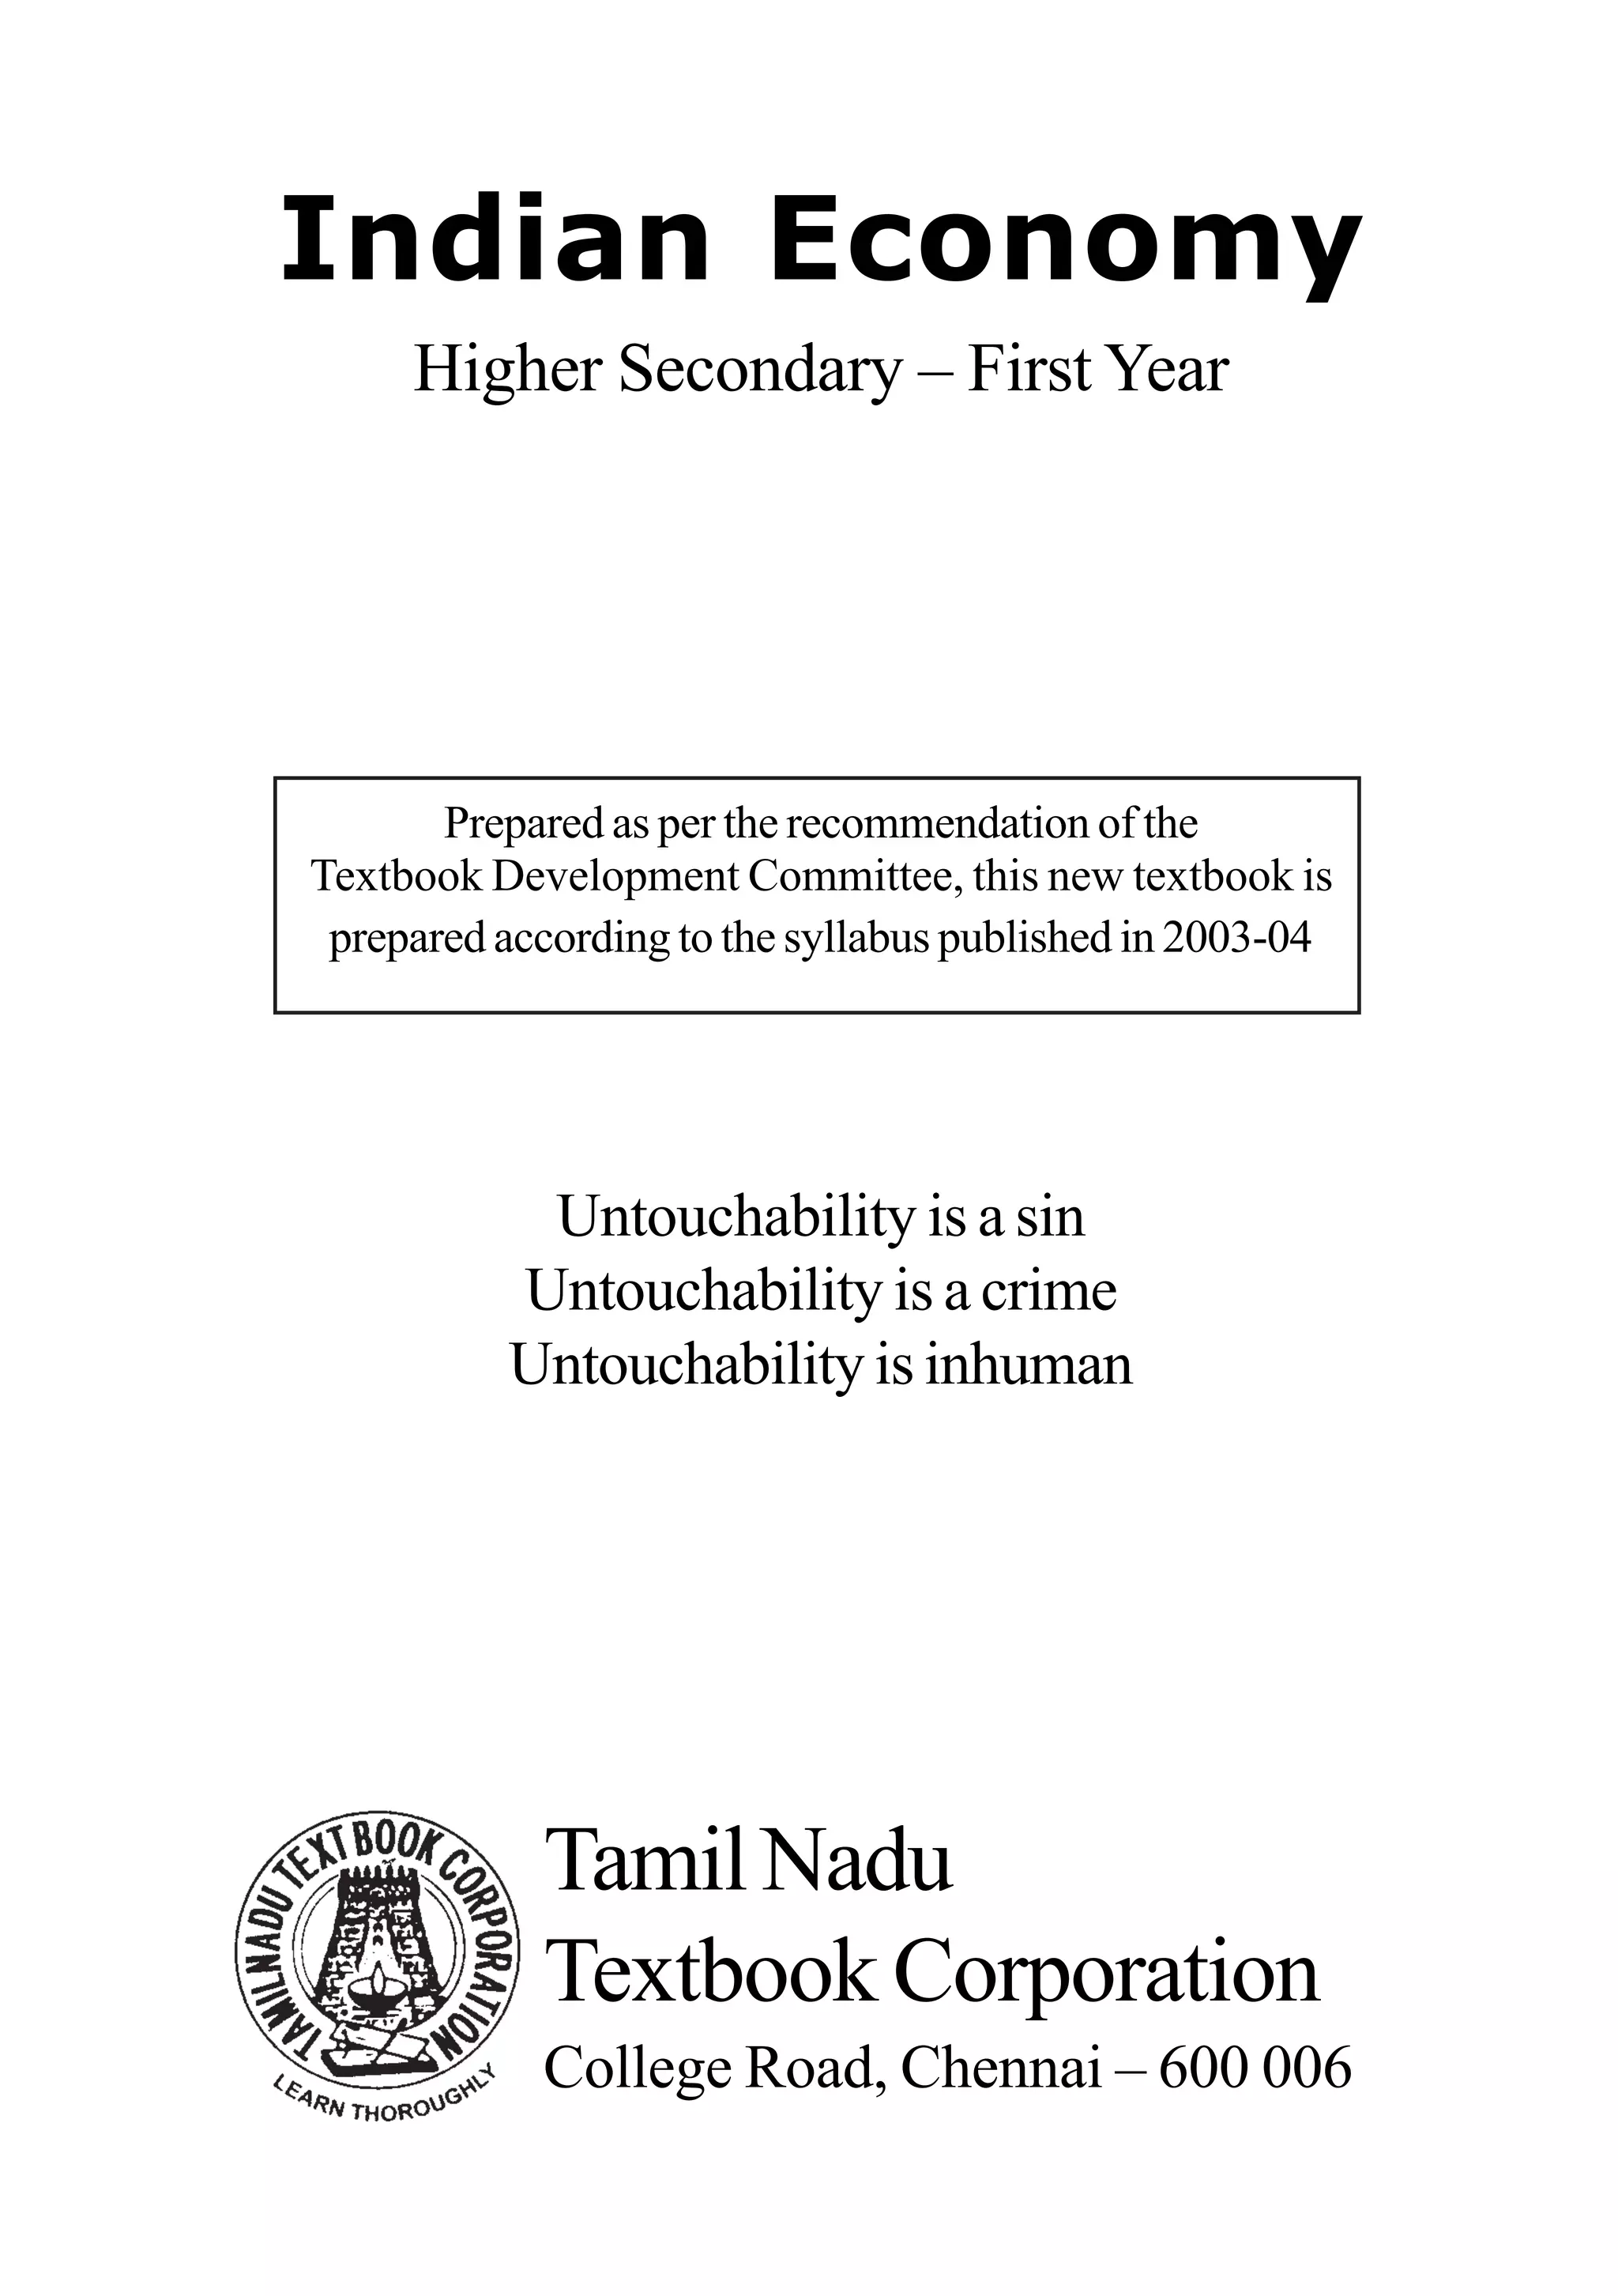
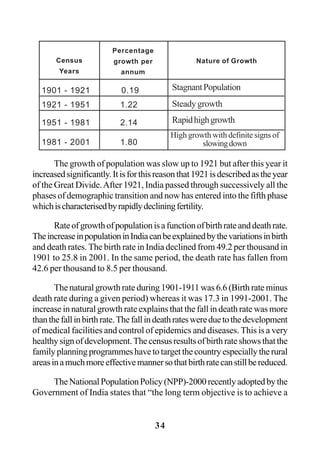
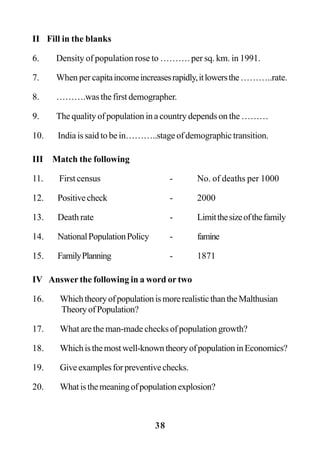
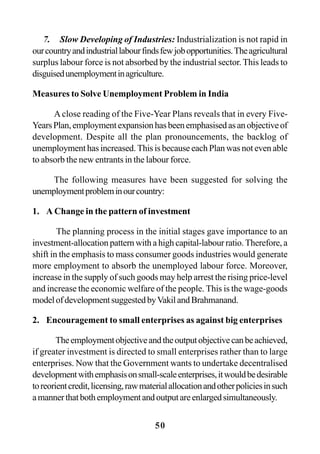
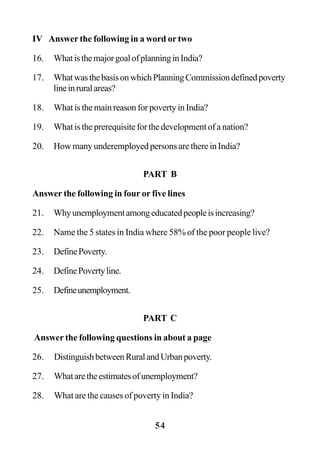
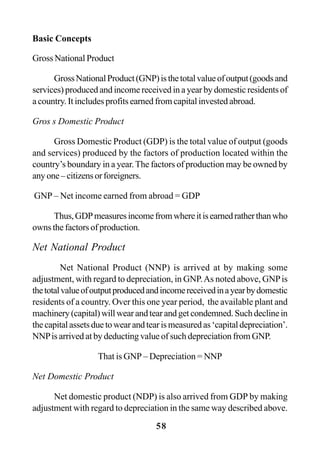
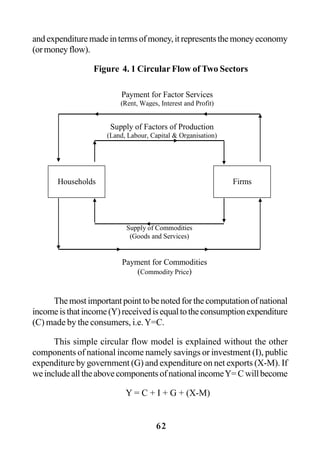
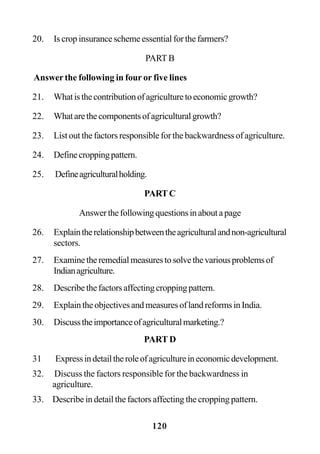
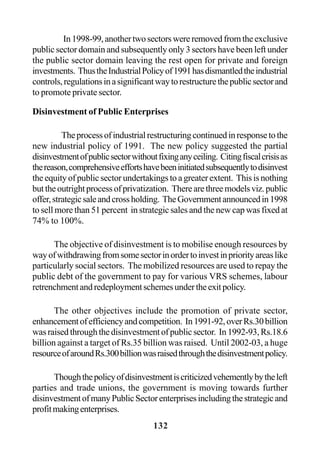
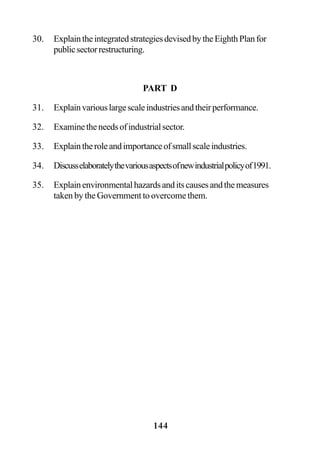
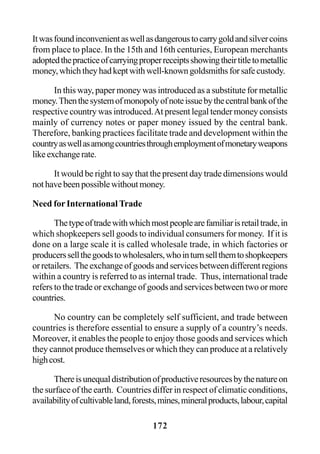
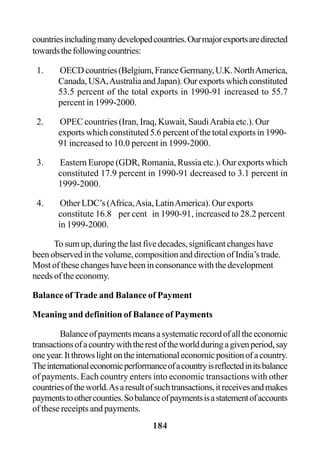
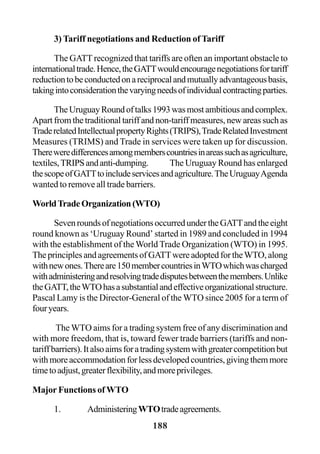
As noted above, GDPis the measure of an economy’s total output. It
is also used as a measure of total income and total expenditure in that
economy.Figure4.1clearlyshowsthatfactorincomesreceivedbythepublic
is being spent to buy the output of goods and services produced.
Hence, income is equal to expenditure and expenditure is equal to
the value of output produced in the economy.
Income = expenditure = output
Y = E = O
The model can further be extended by adding the other components
ofnationalincomenamelyinvestment(I),government(G),andforeigntrade
(X-M).Intheextendedmodel,savingsofpublic,taxesandimportpayments
willbedeductedfromtheincome.Hence,theyarecalledleakagesfromthe
circularflow.Similarly,investmentexpenditure,governmentexpenditureand
netexpenditureontradewillbeaddedintothecircularflow.Theseadditions
arecalledinjections.However,afteraggregatingallleakages(outflow)and
injections (inflow) in any one year, the total income components of the](https://image.slidesharecdn.com/std11-econ-em-171216070827/85/Std11-econ-em-70-320.jpg)


This chapter discusses the evolution of economic thought from ancient civilizations to modern times. It covers the economic ideas found in ancient Hebrew, Indian, Greek, and Roman writings. Some key points include: 1) The ancient Hebrews emphasized religion, ethics, and agriculture. They had rules against usury, monopolies, and unjust prices. 2) Ancient Indian economic thought is found in texts like the Arthashastra and Thirukkural. Professions formed the basis of the caste system initially. Agriculture was highly respected. 3) Greek thought and Roman law formed the basis of European culture. Economic ideas continued developing through the middle ages to modern times.


