Download to read offline
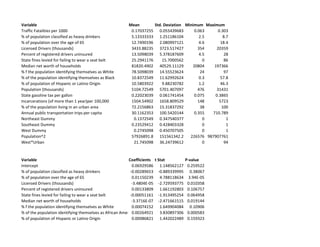


This document contains statistical data for various variables related to traffic fatalities and demographics for US states. It includes the mean, standard deviation, minimum and maximum values for variables like traffic fatalities per 1000 people, percentage of heavy drinkers, elderly population, number of licensed drivers, uninsured drivers, seat belt fines, household wealth, racial demographics, population size, gas taxes, incarceration rates, urbanization, and public transit usage. It also shows the coefficients, t-statistics and p-values from a regression analysis with traffic fatalities as the dependent variable and the other variables as predictors.


