Download to read offline
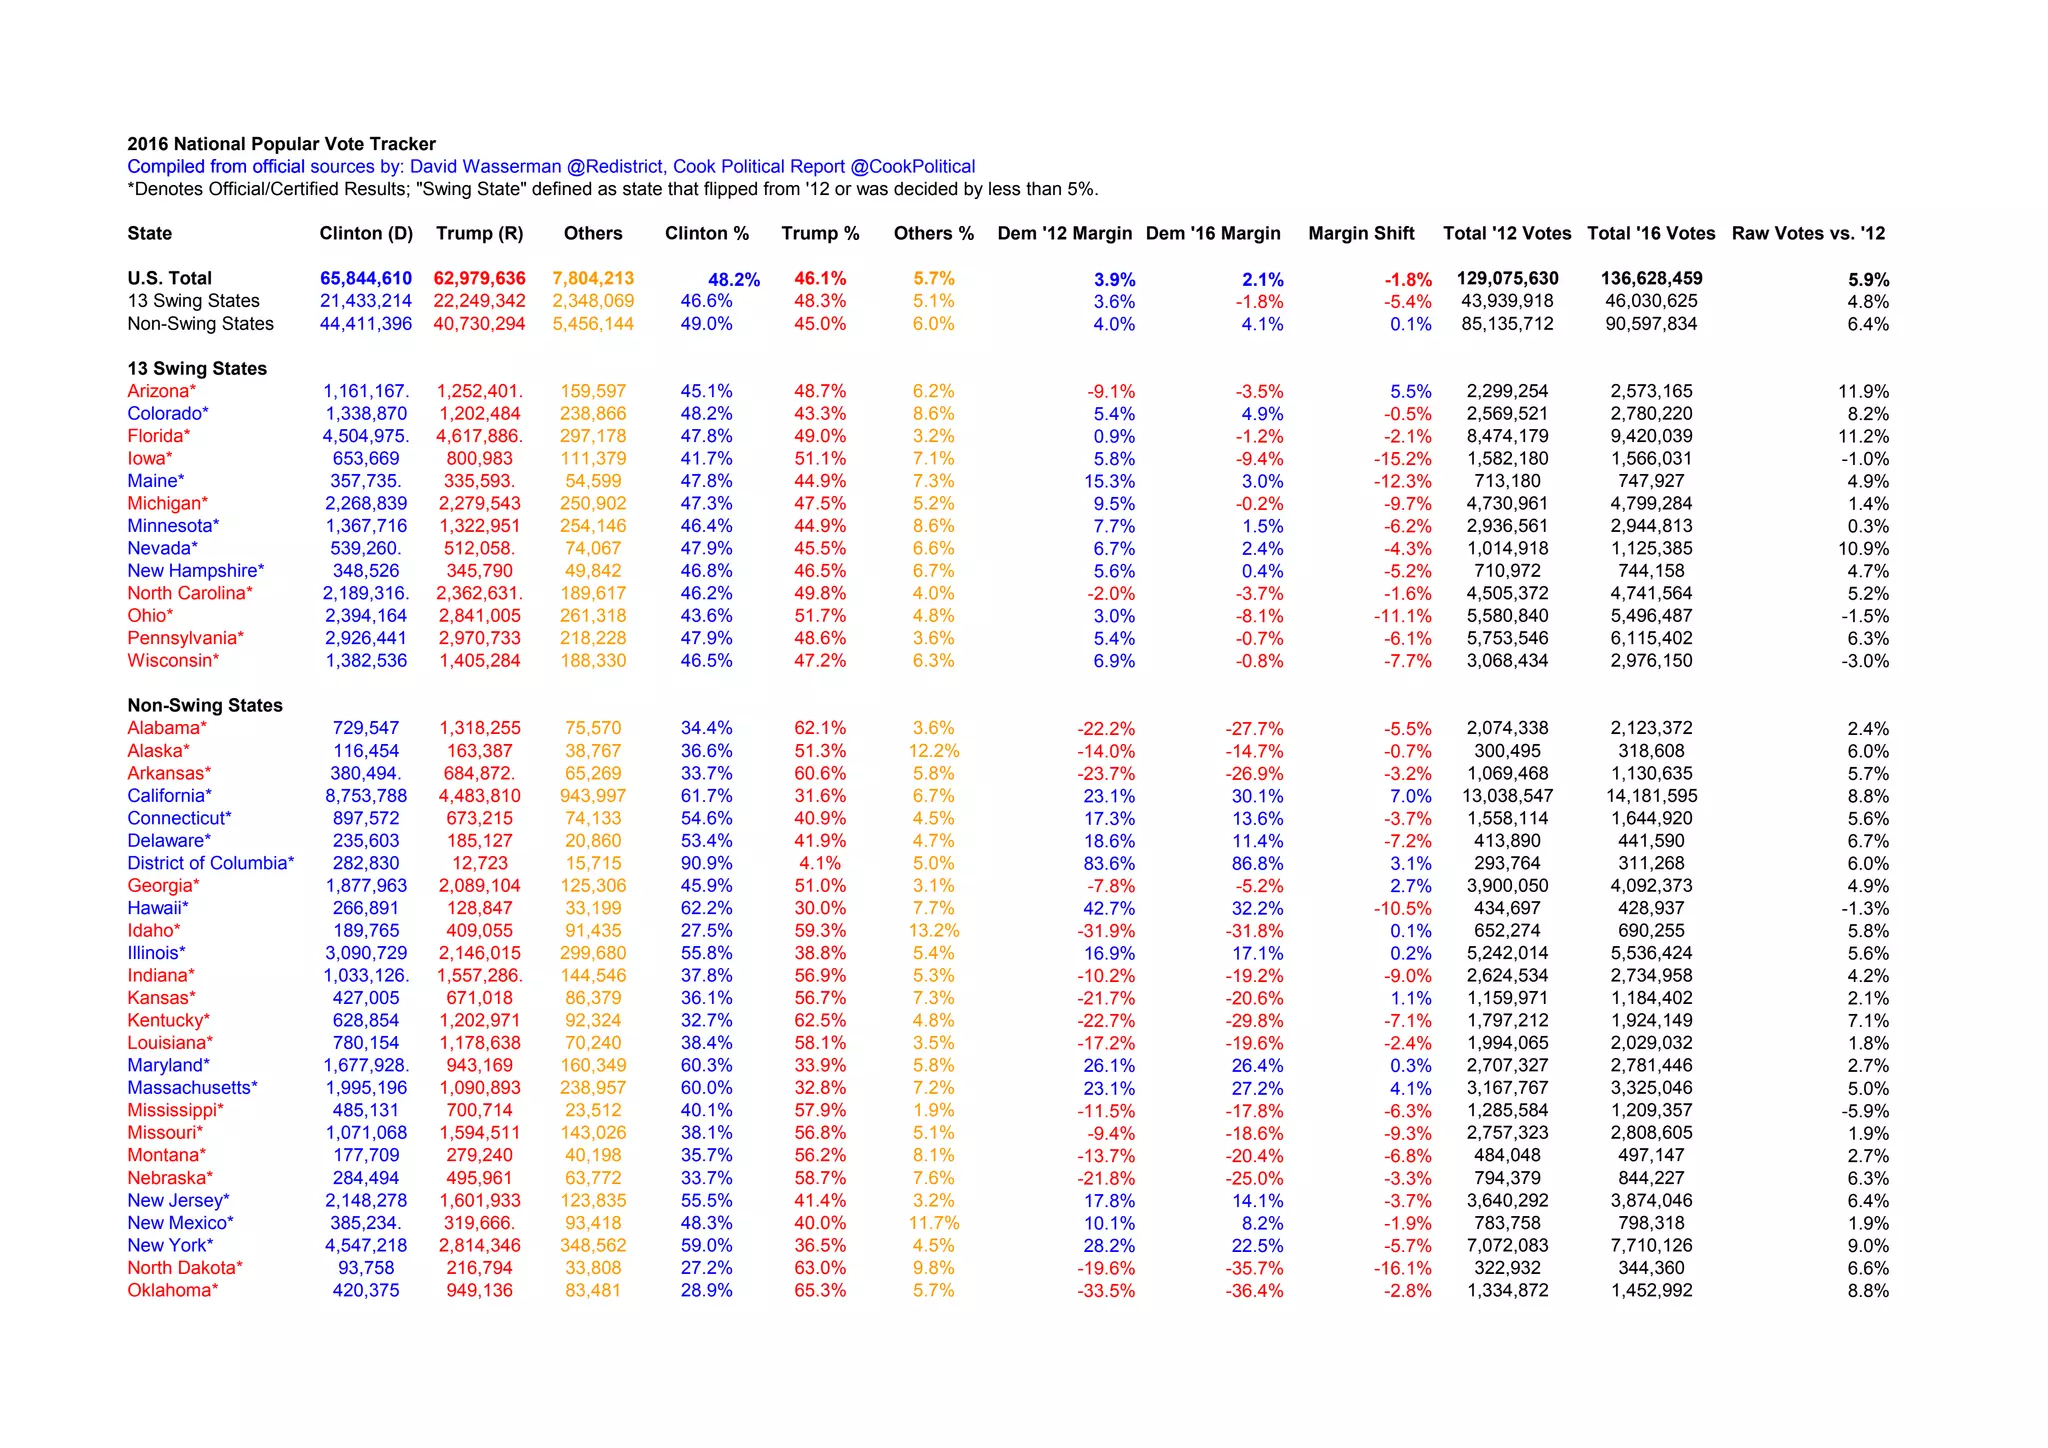


- The document provides the official 2016 presidential election results for all 50 U.S. states and the District of Columbia, comparing votes for Clinton, Trump, and others as well as margins from the 2012 election. - Thirteen states are identified as "swing states" that were decided by less than 5% or flipped from Democratic to Republican or vice versa between elections. Clinton won the national popular vote by over 2 million votes but Trump won the electoral college. - Clinton received the majority of votes in the non-swing states, totaling over 44 million votes compared to Trump's 40.7 million. However, Trump won the majority of swing states, totaling over 22 million votes to Clinton's 21.4 million.