1) The document is the 2008 Statistical Abstract published by the Directorate of Economics & Statistics of the Government of NCT Delhi.
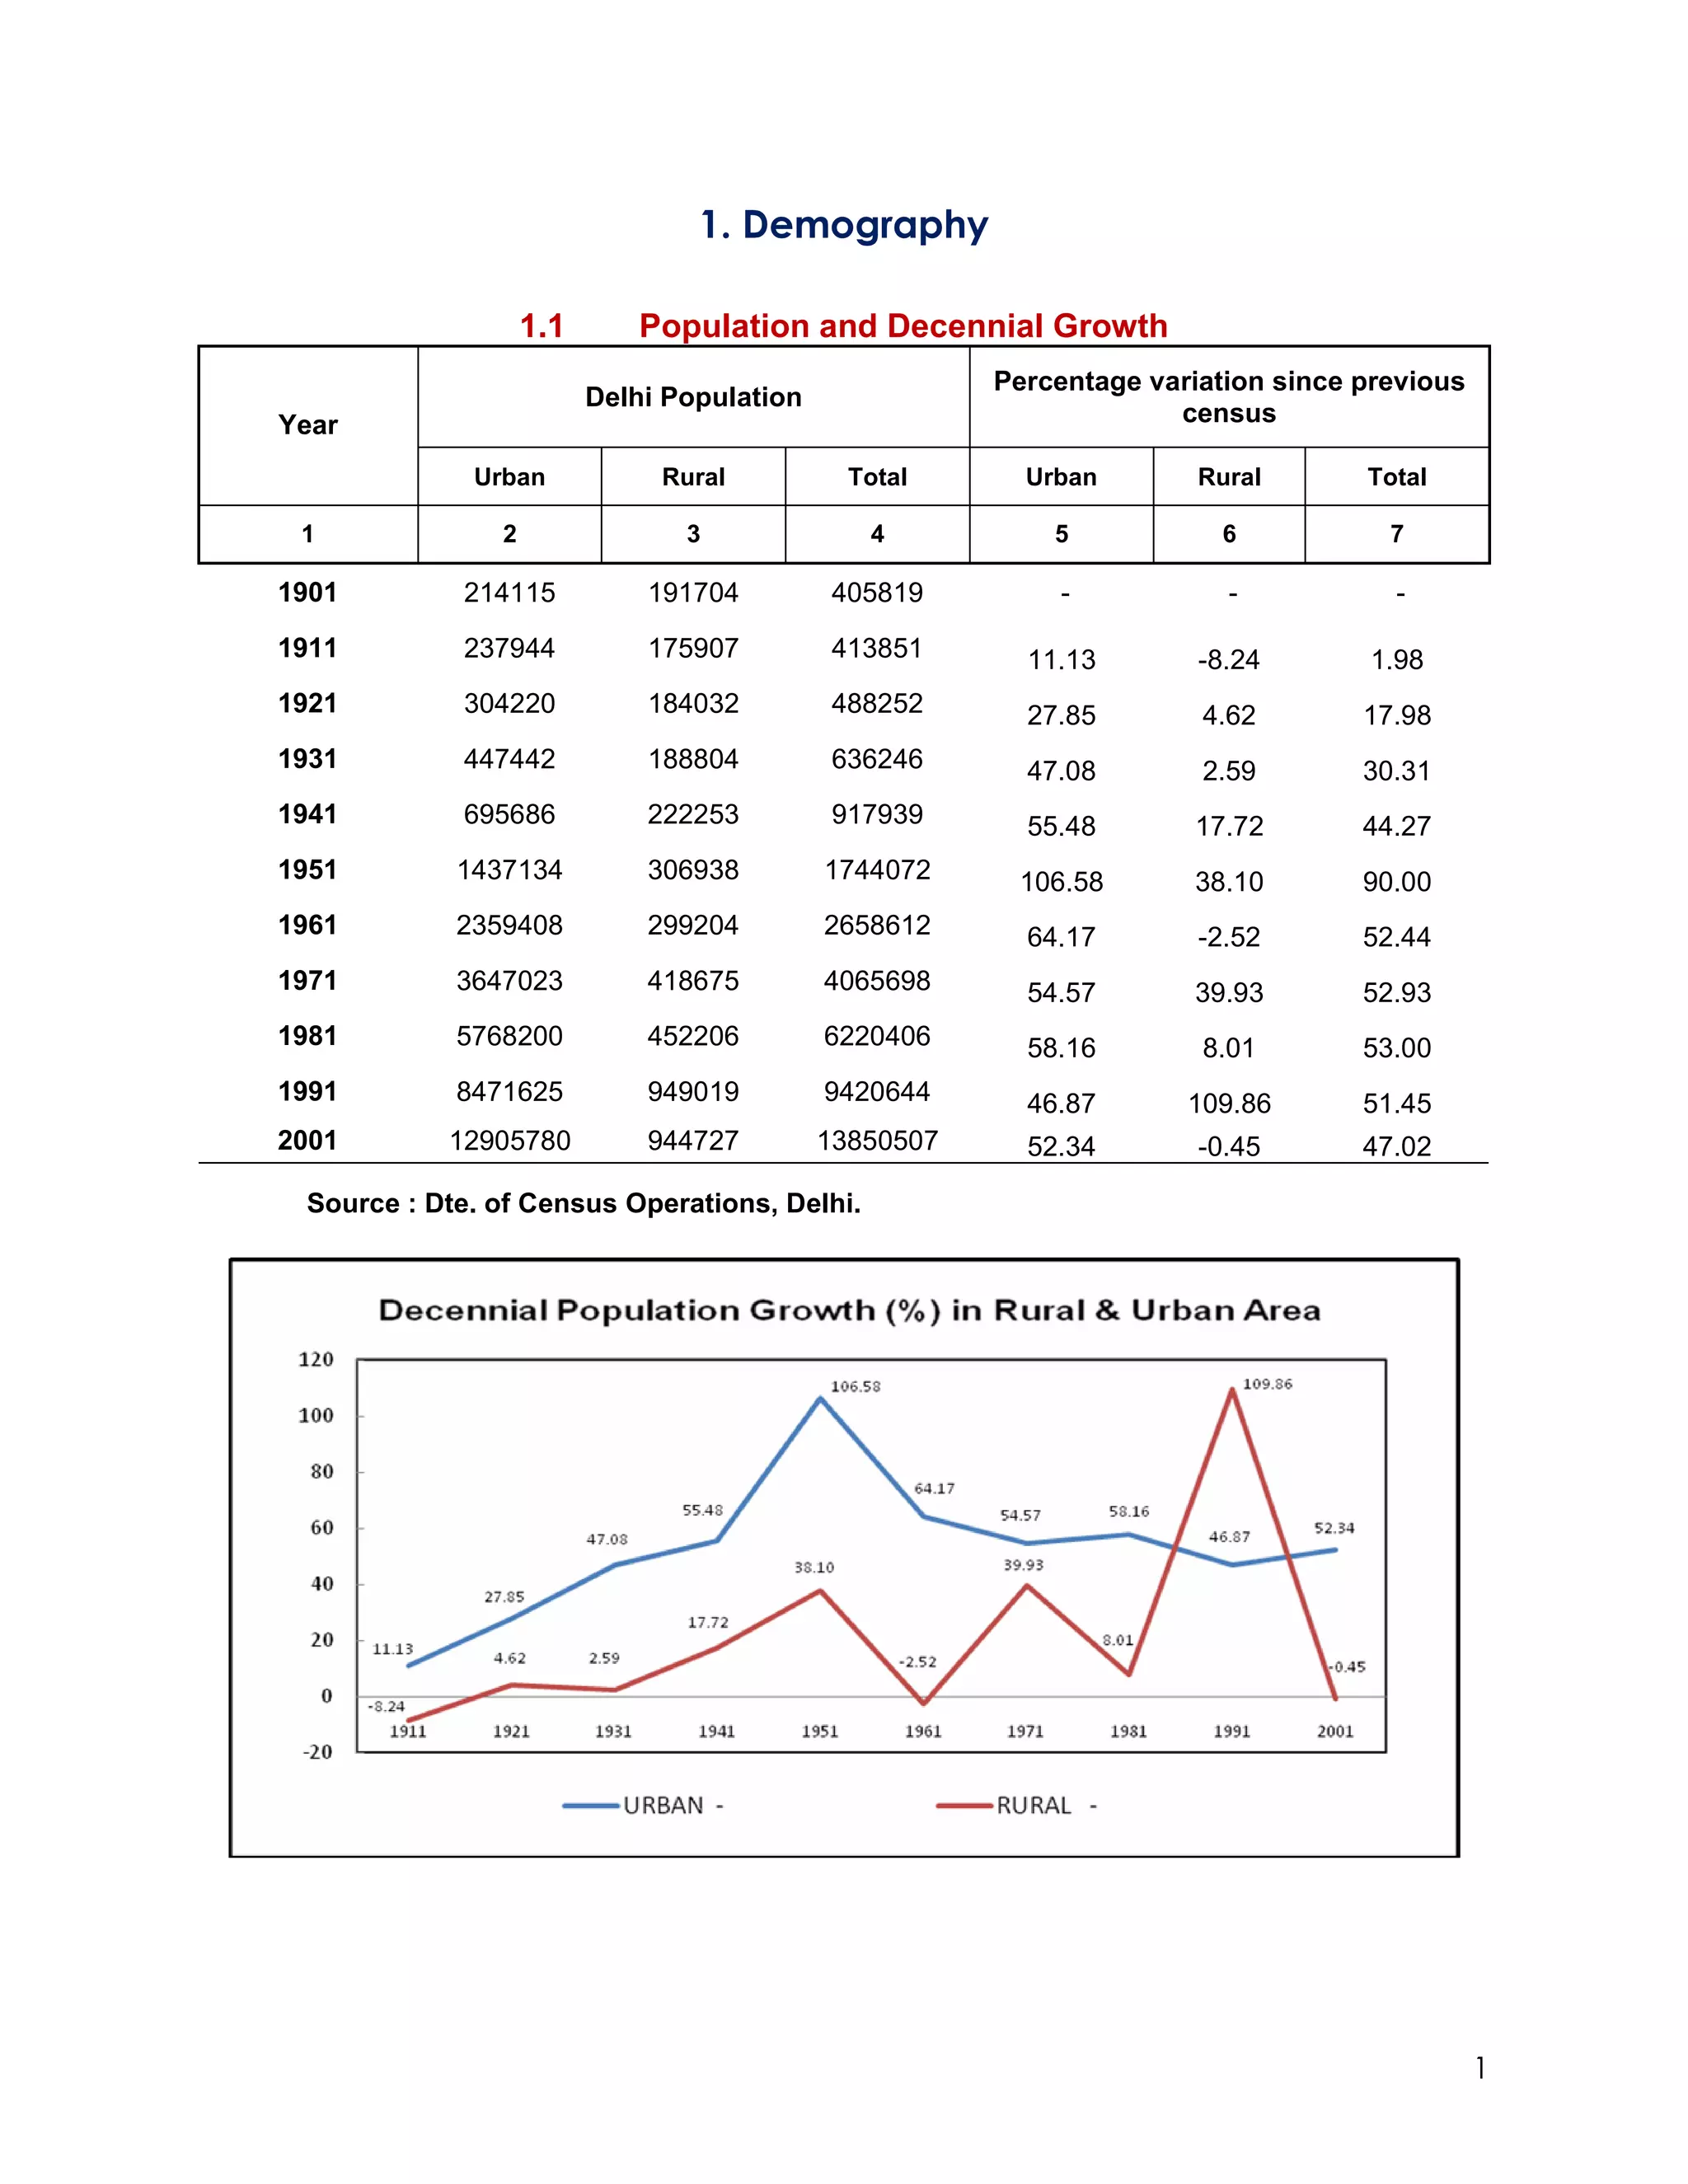
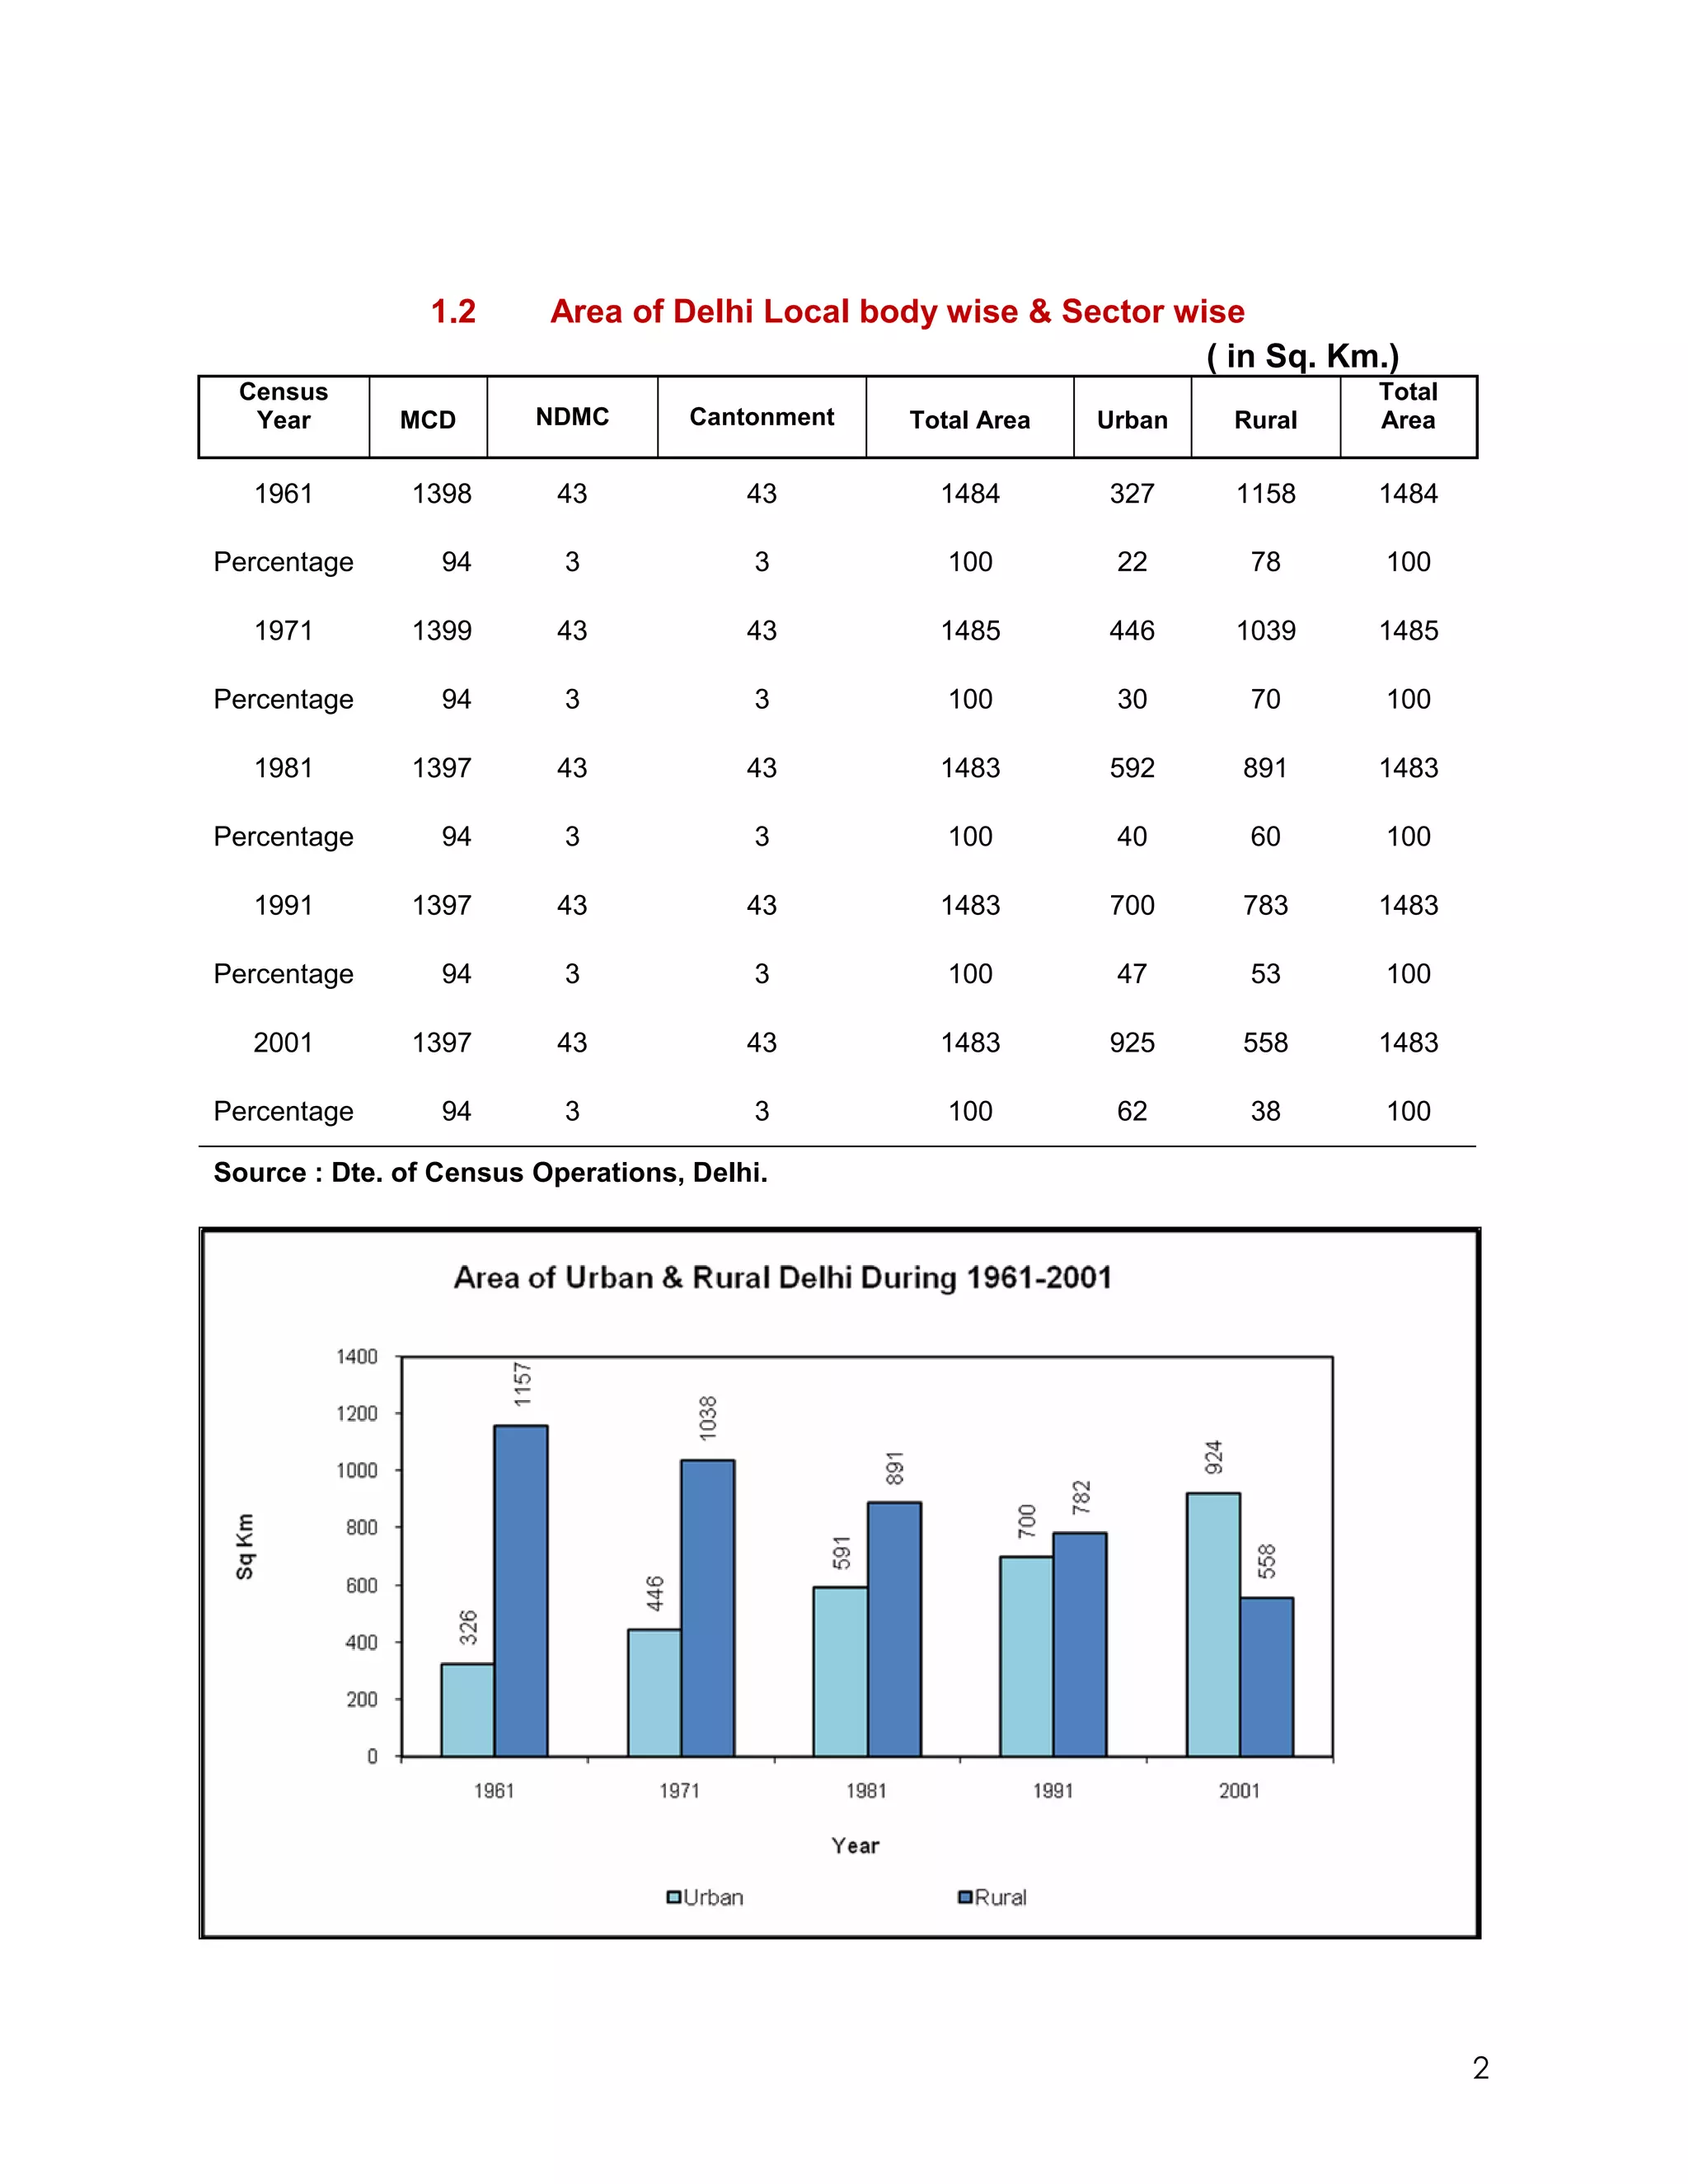
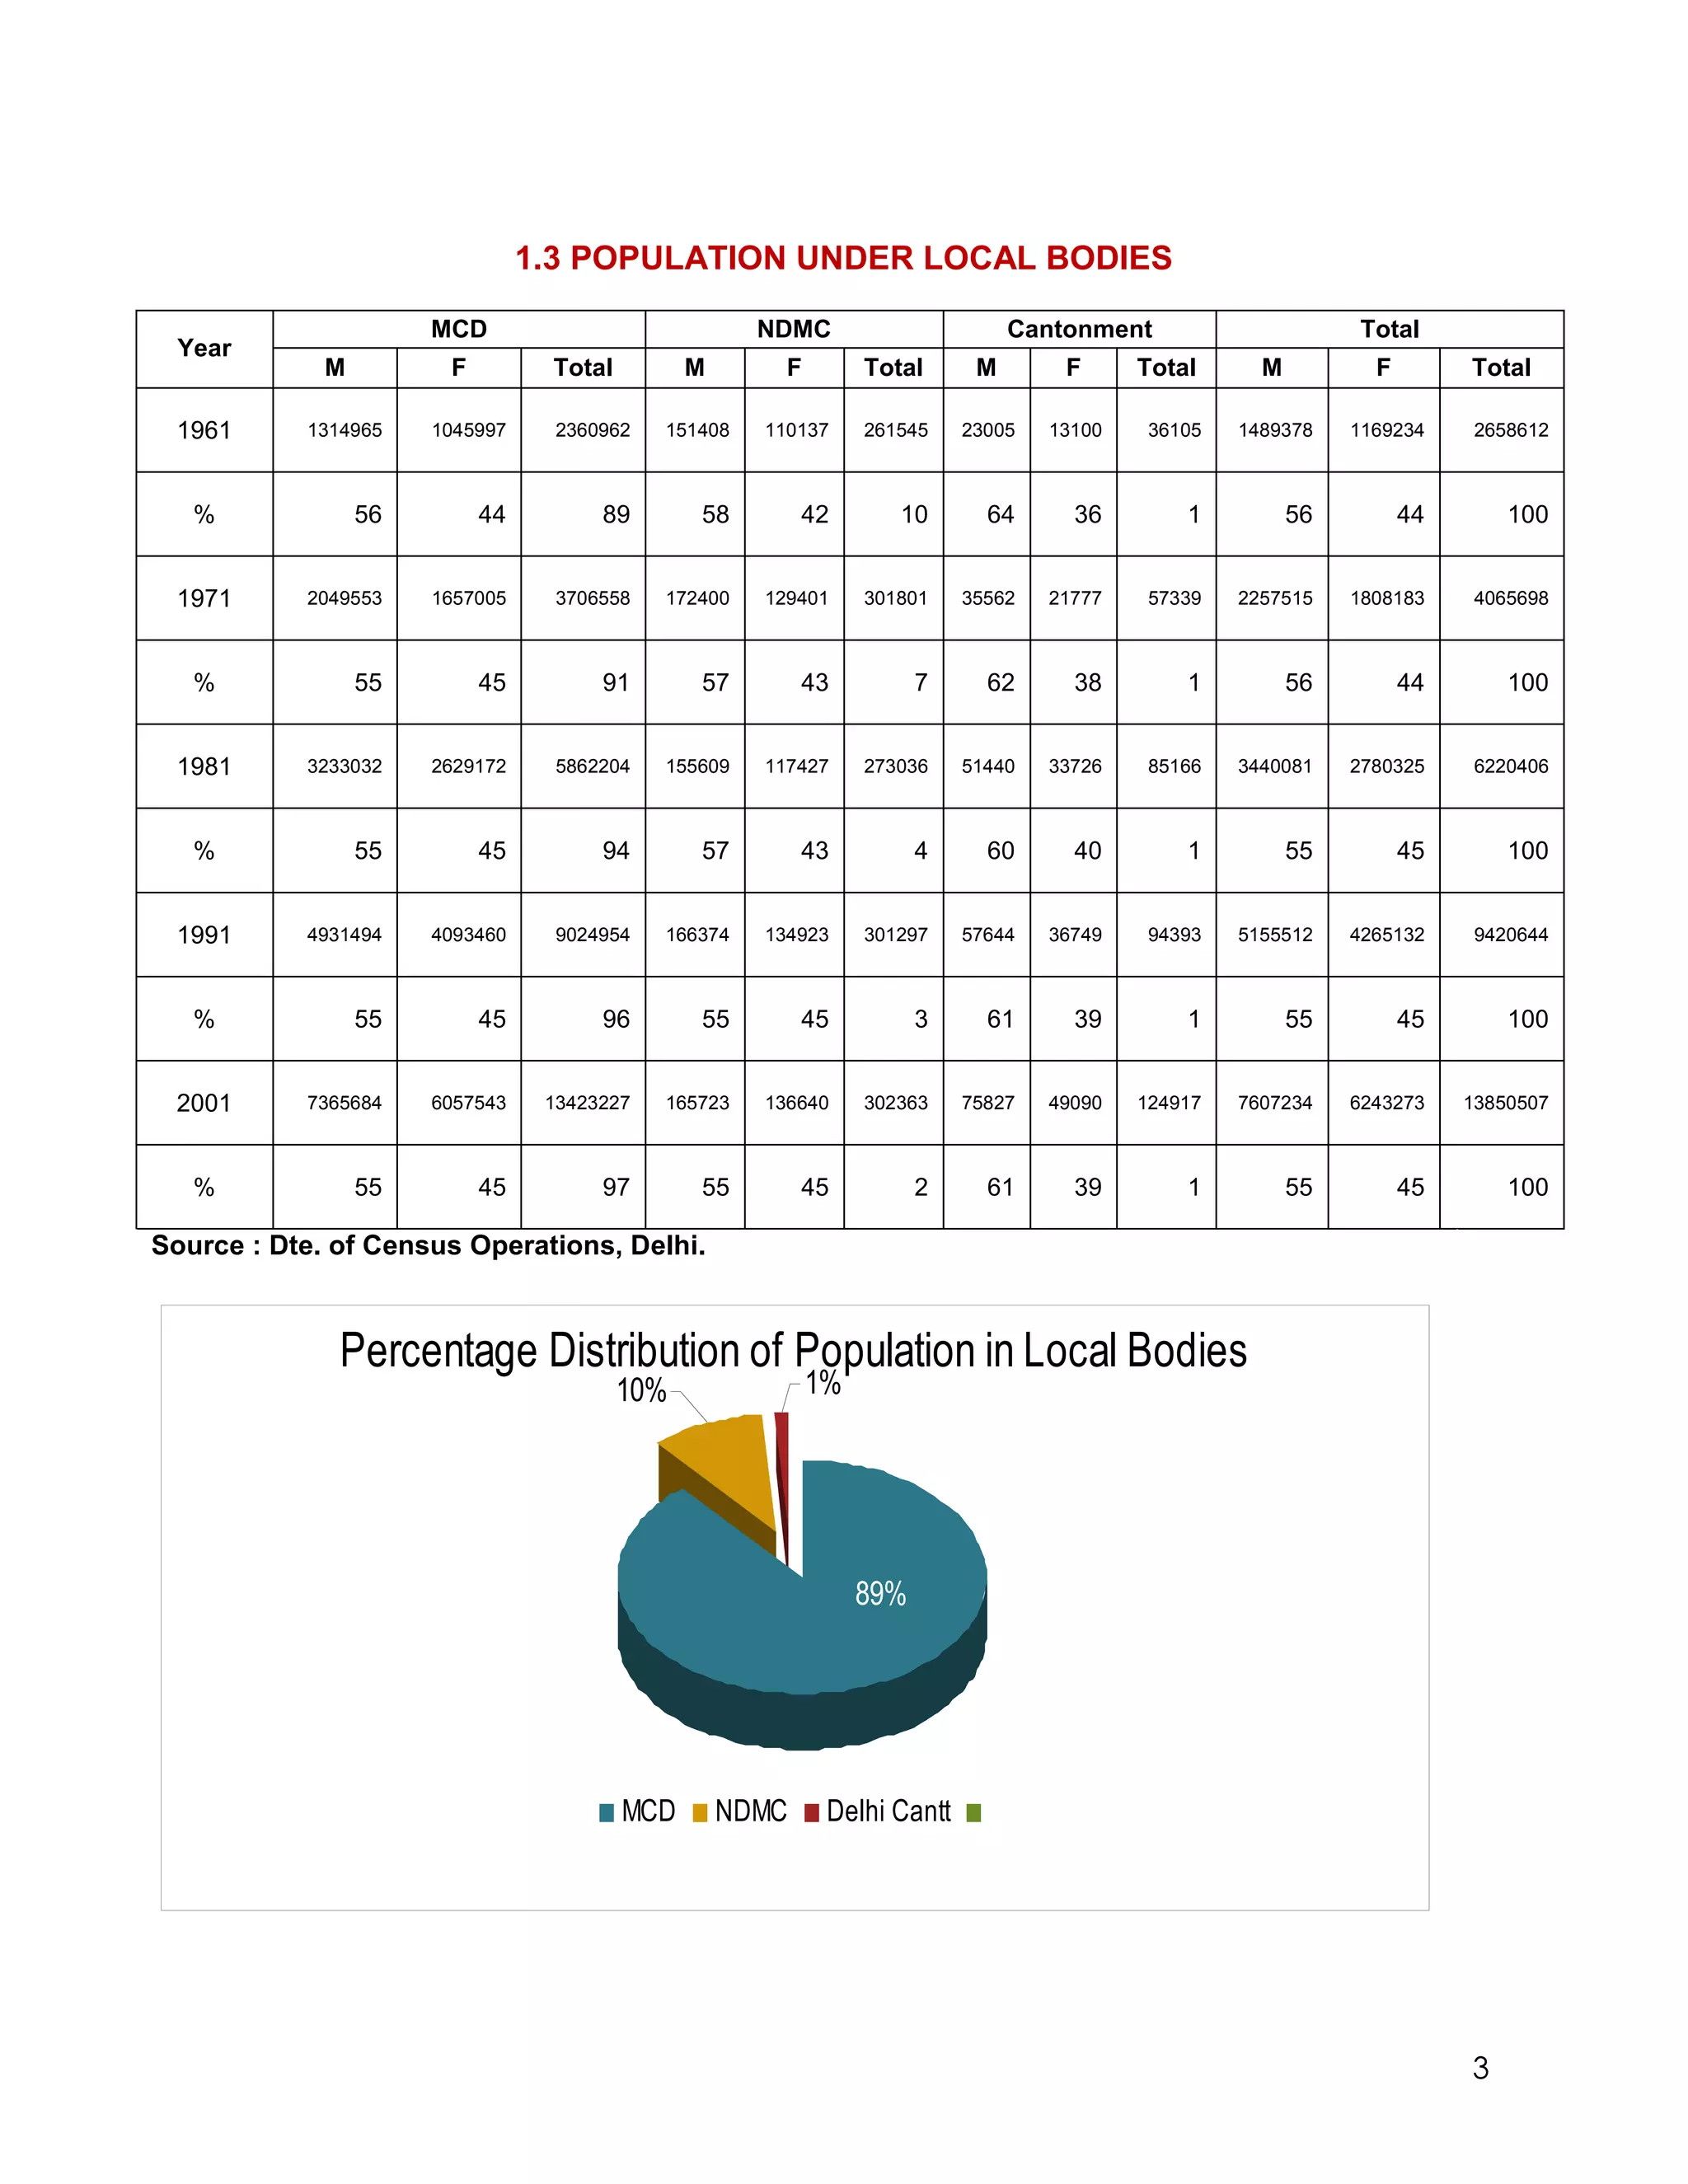
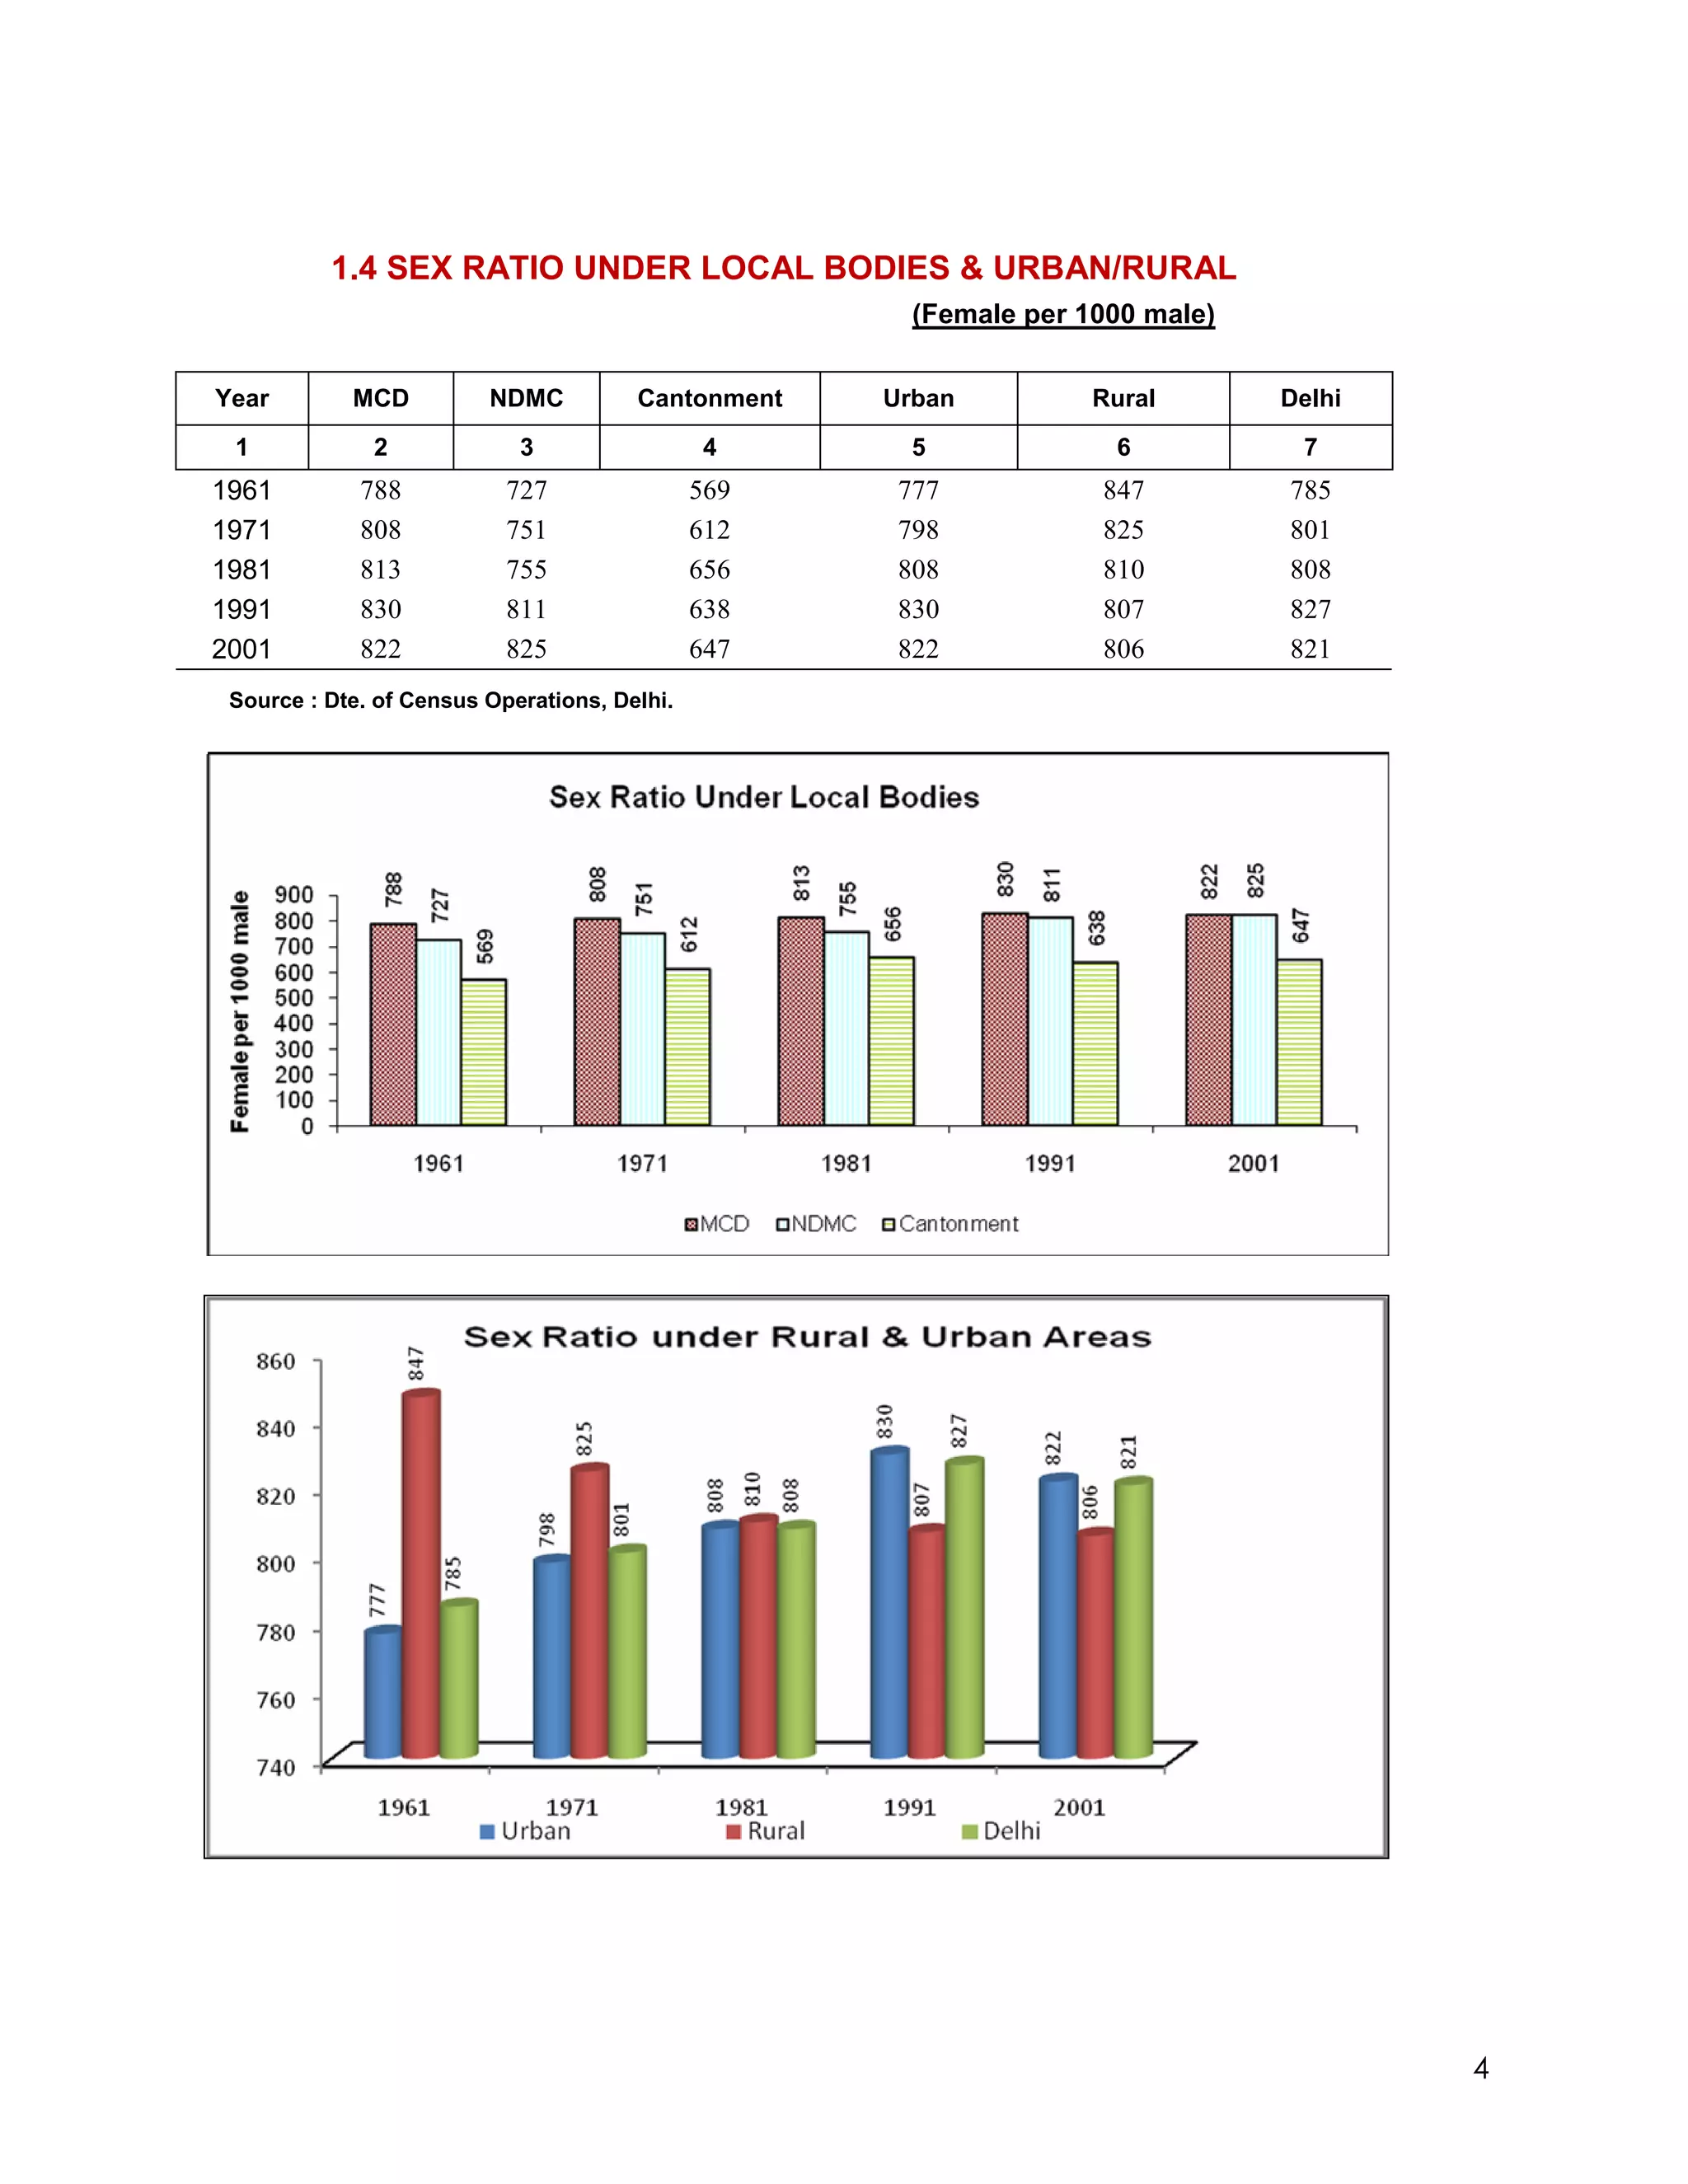
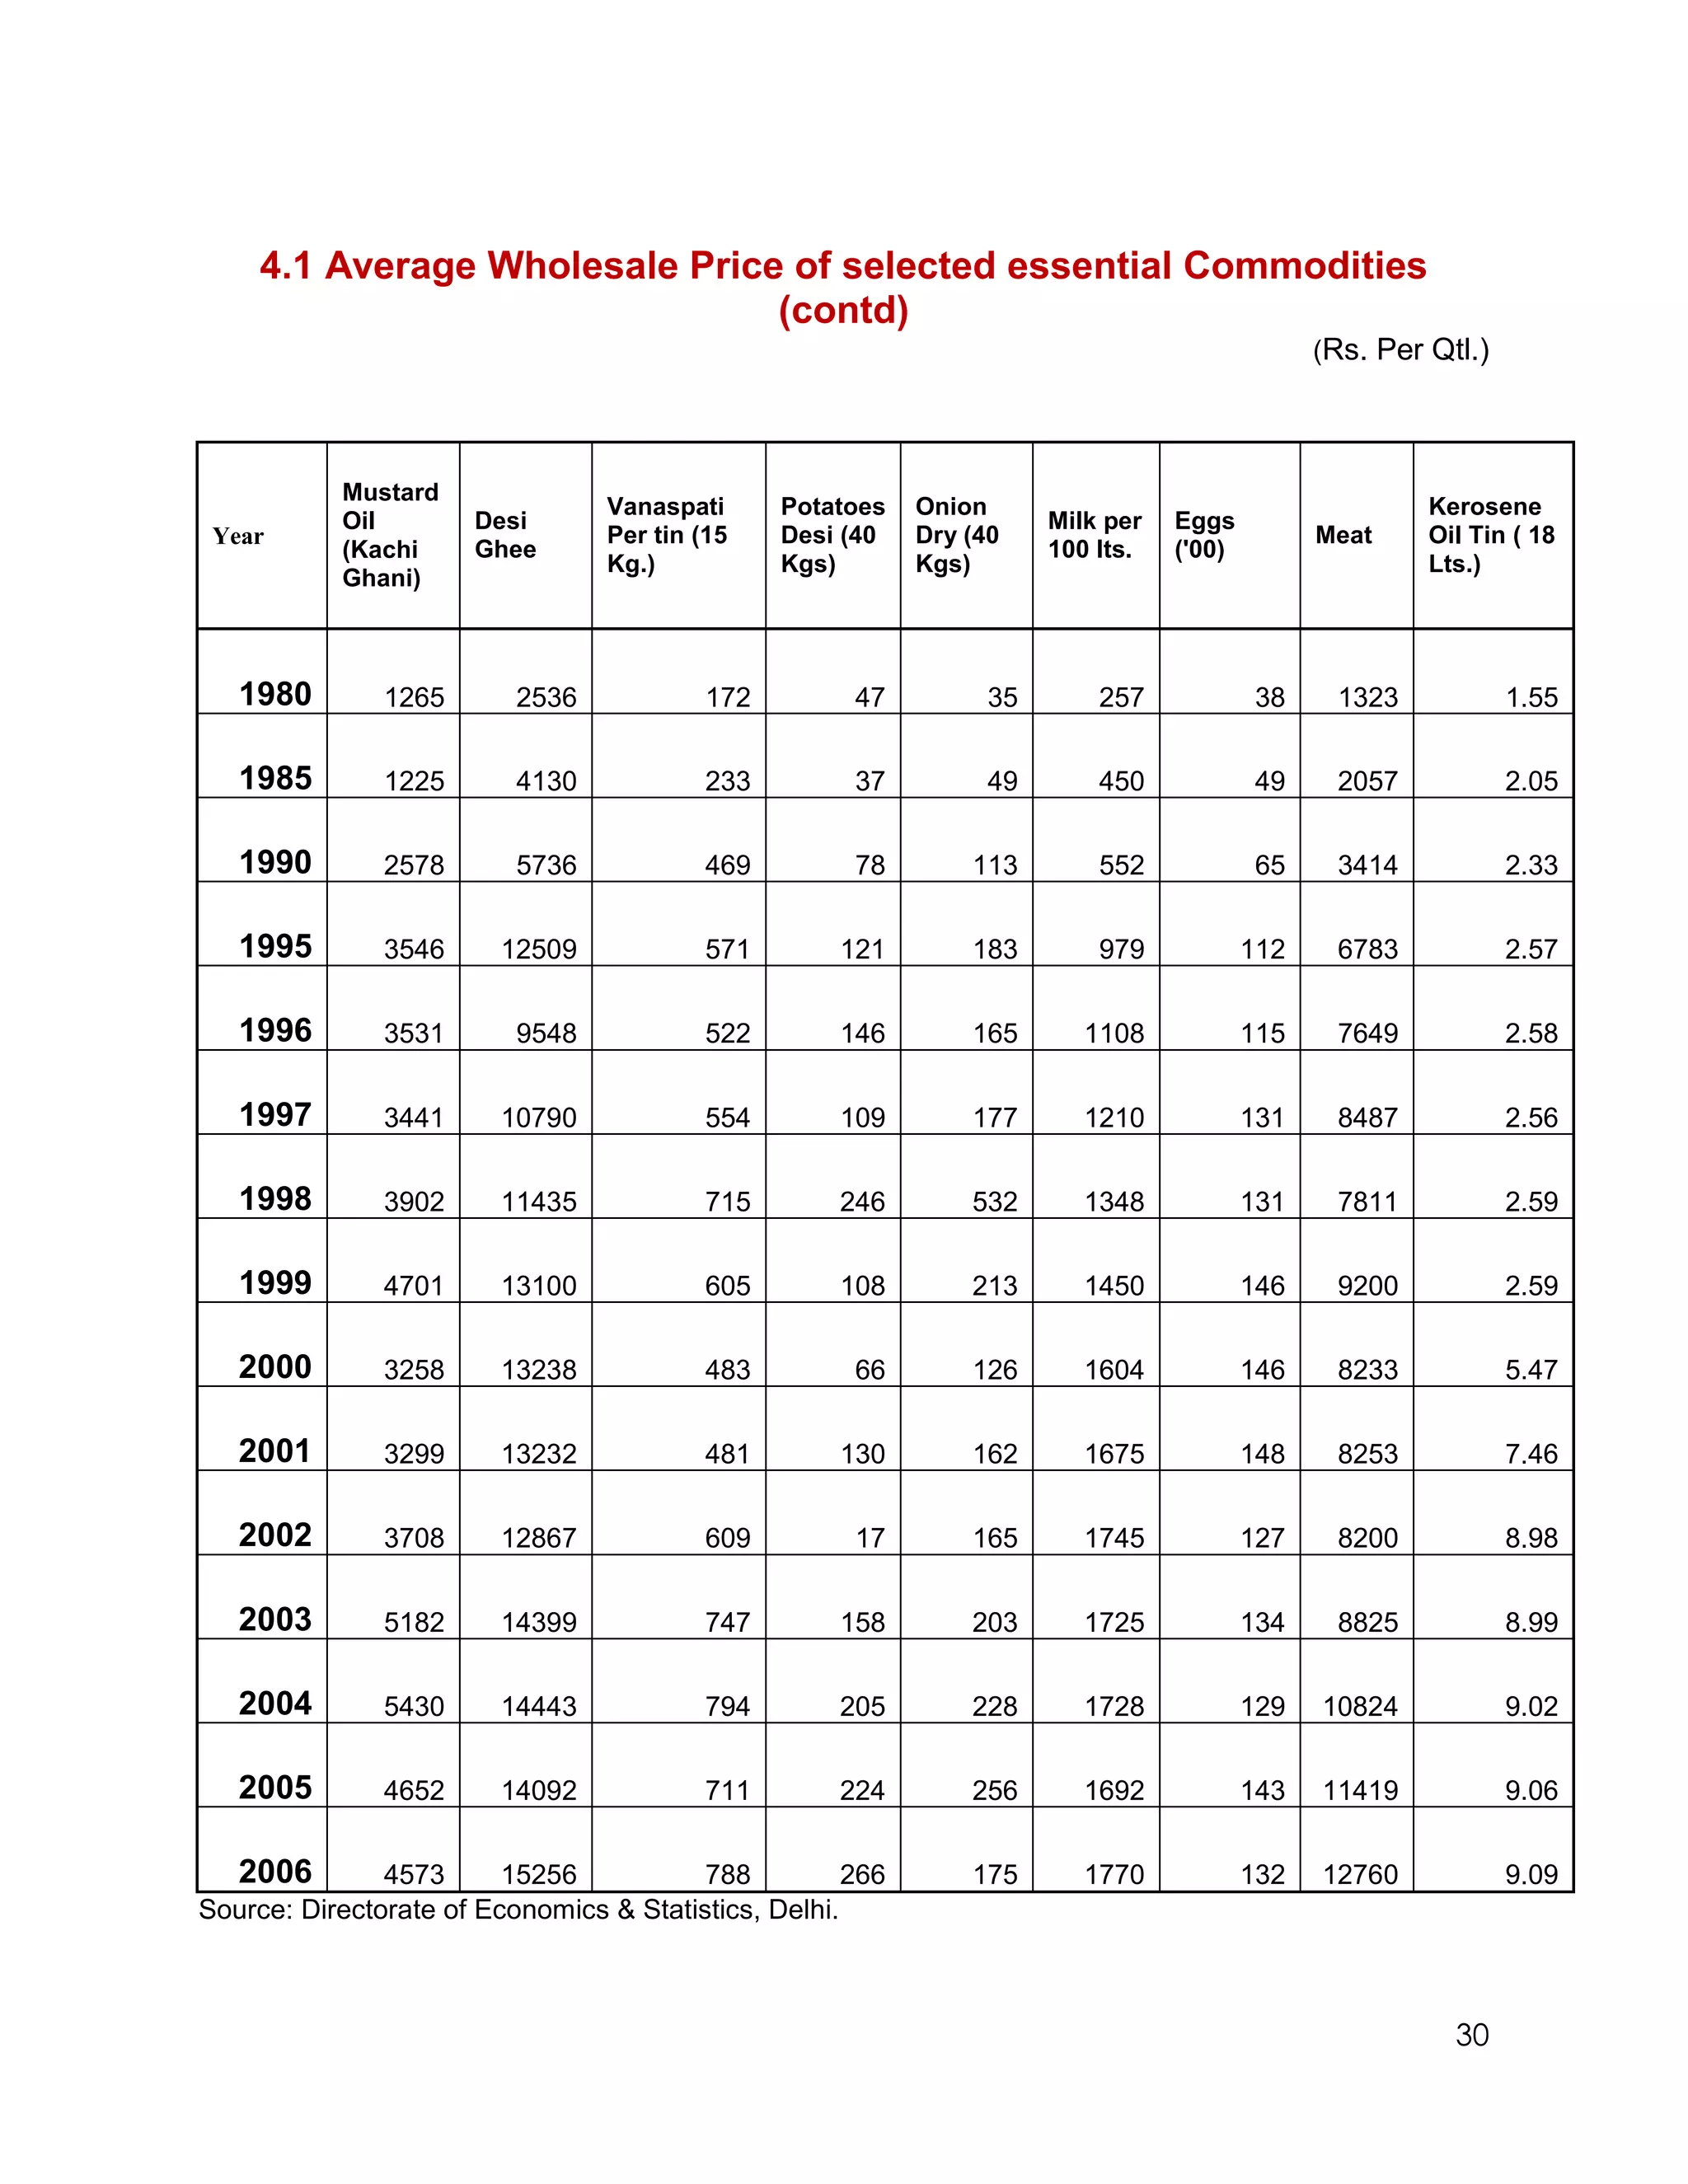
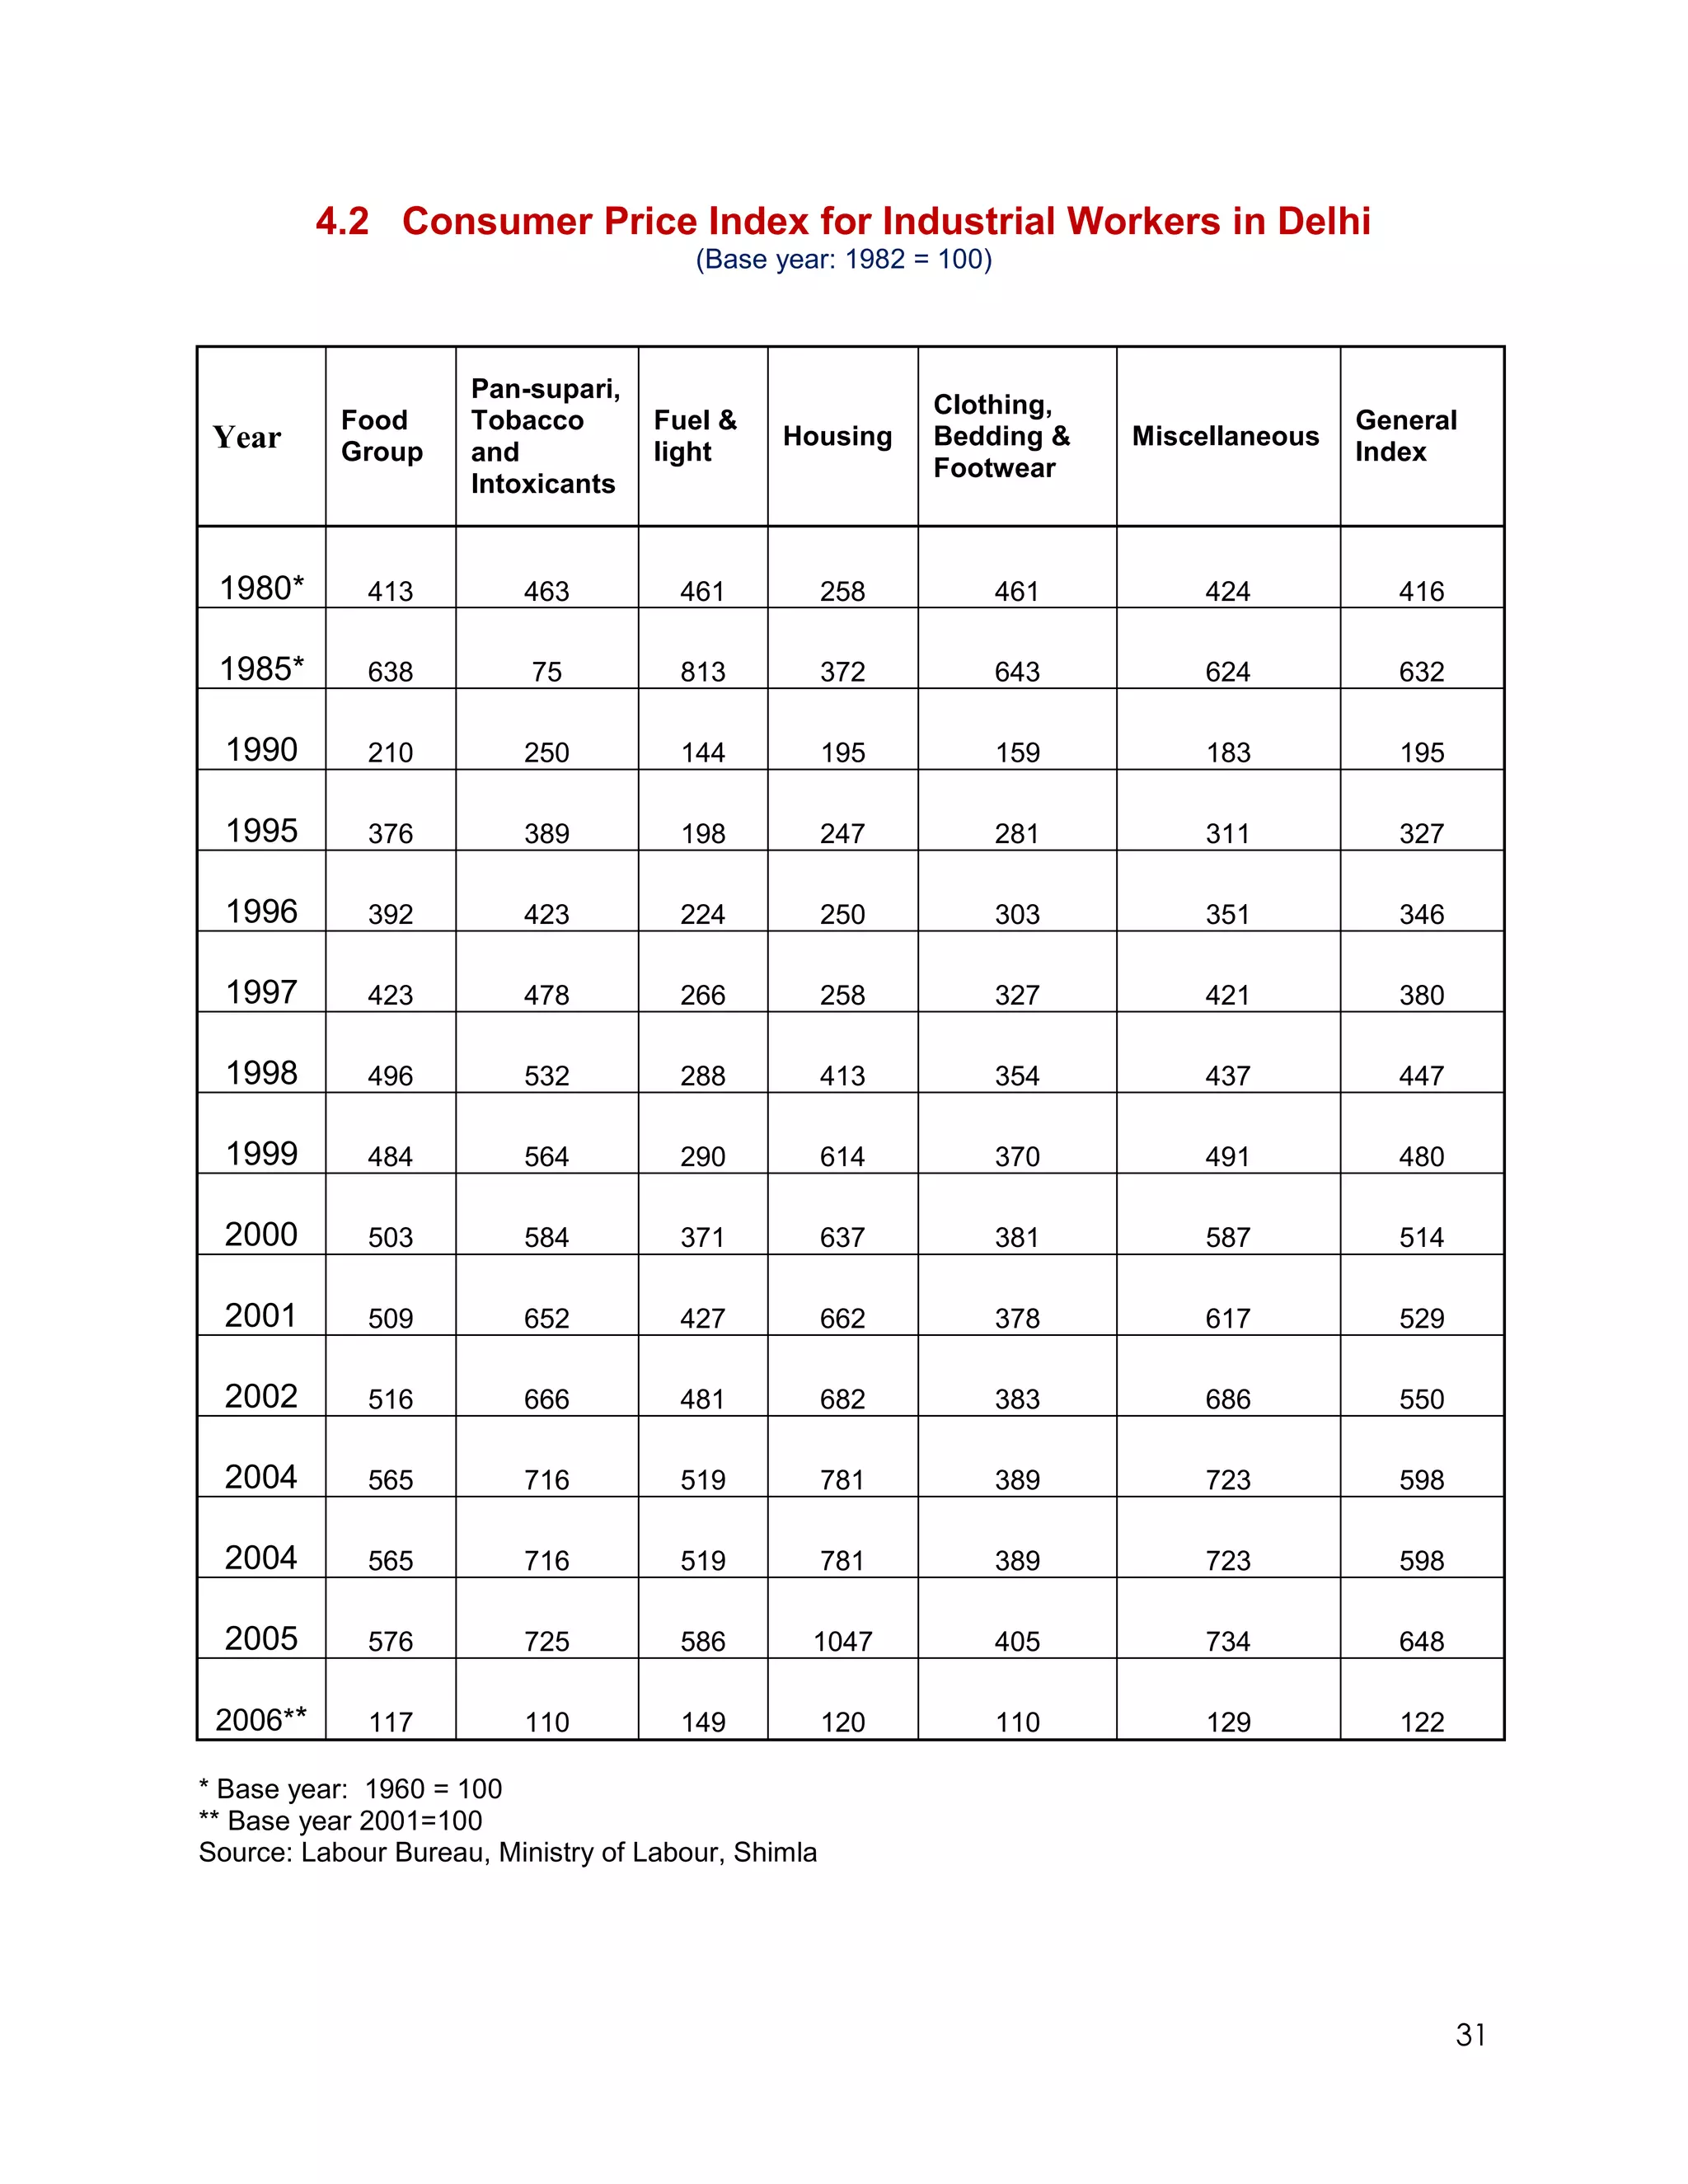
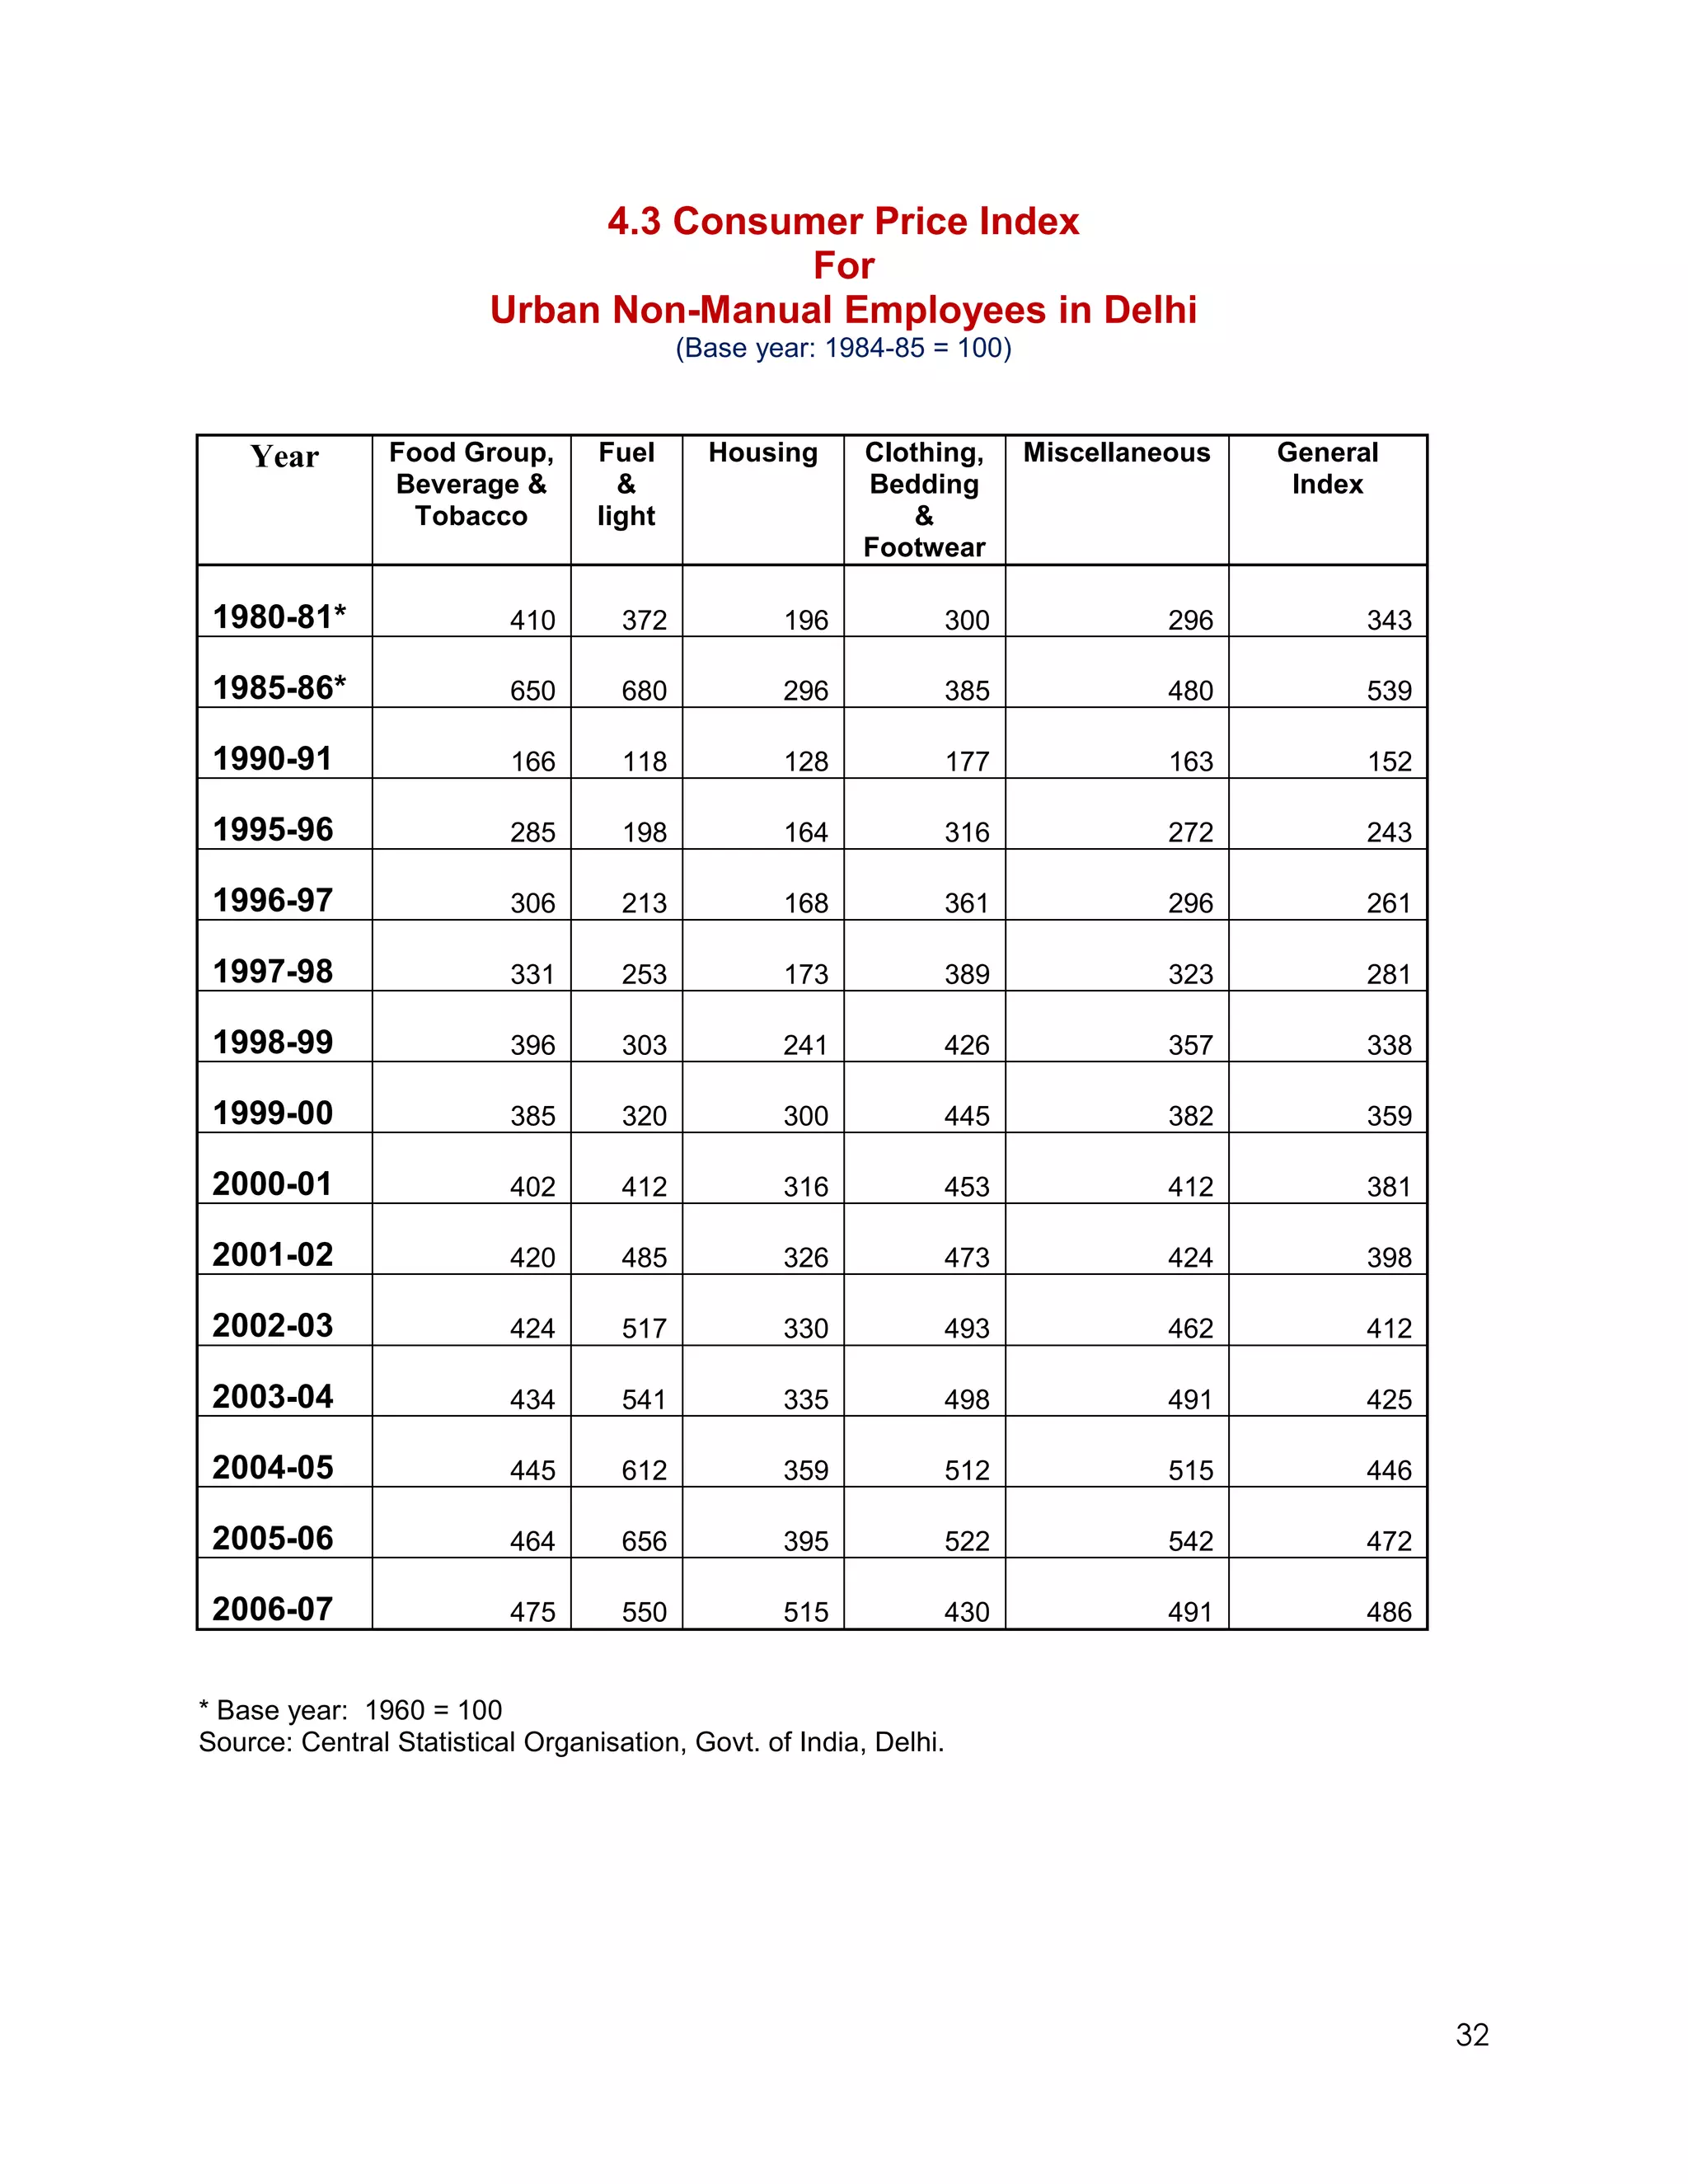
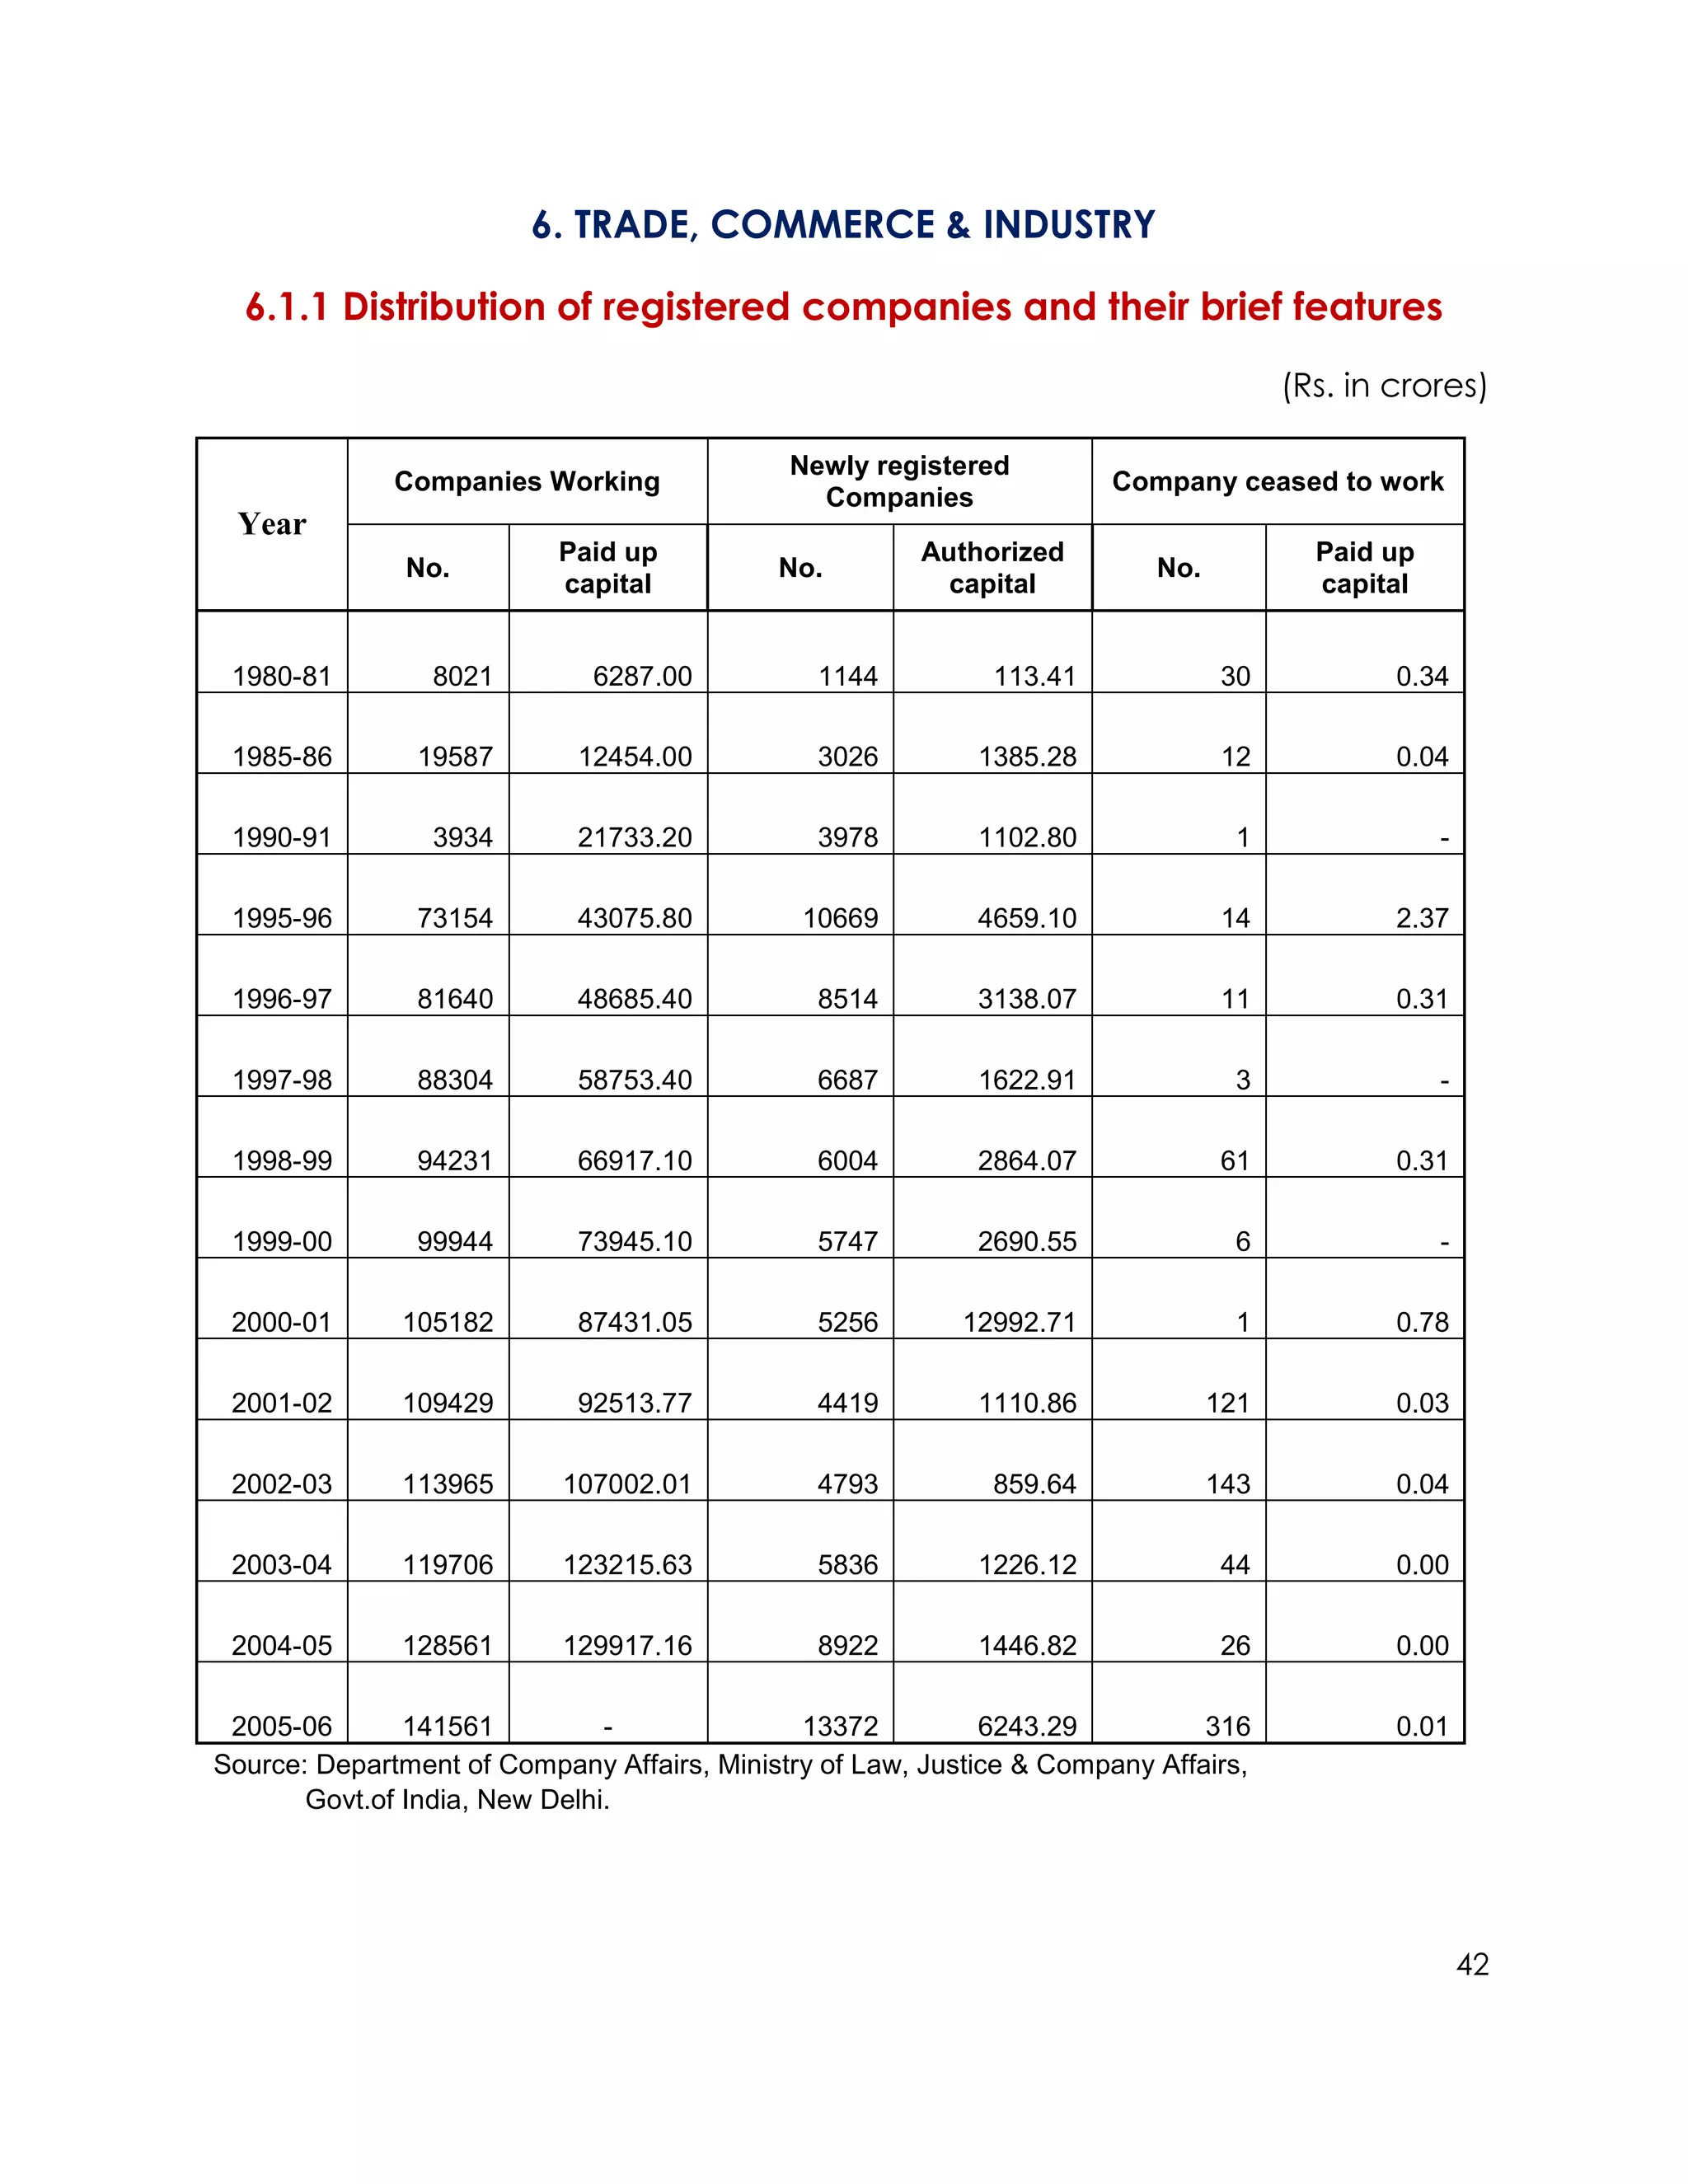
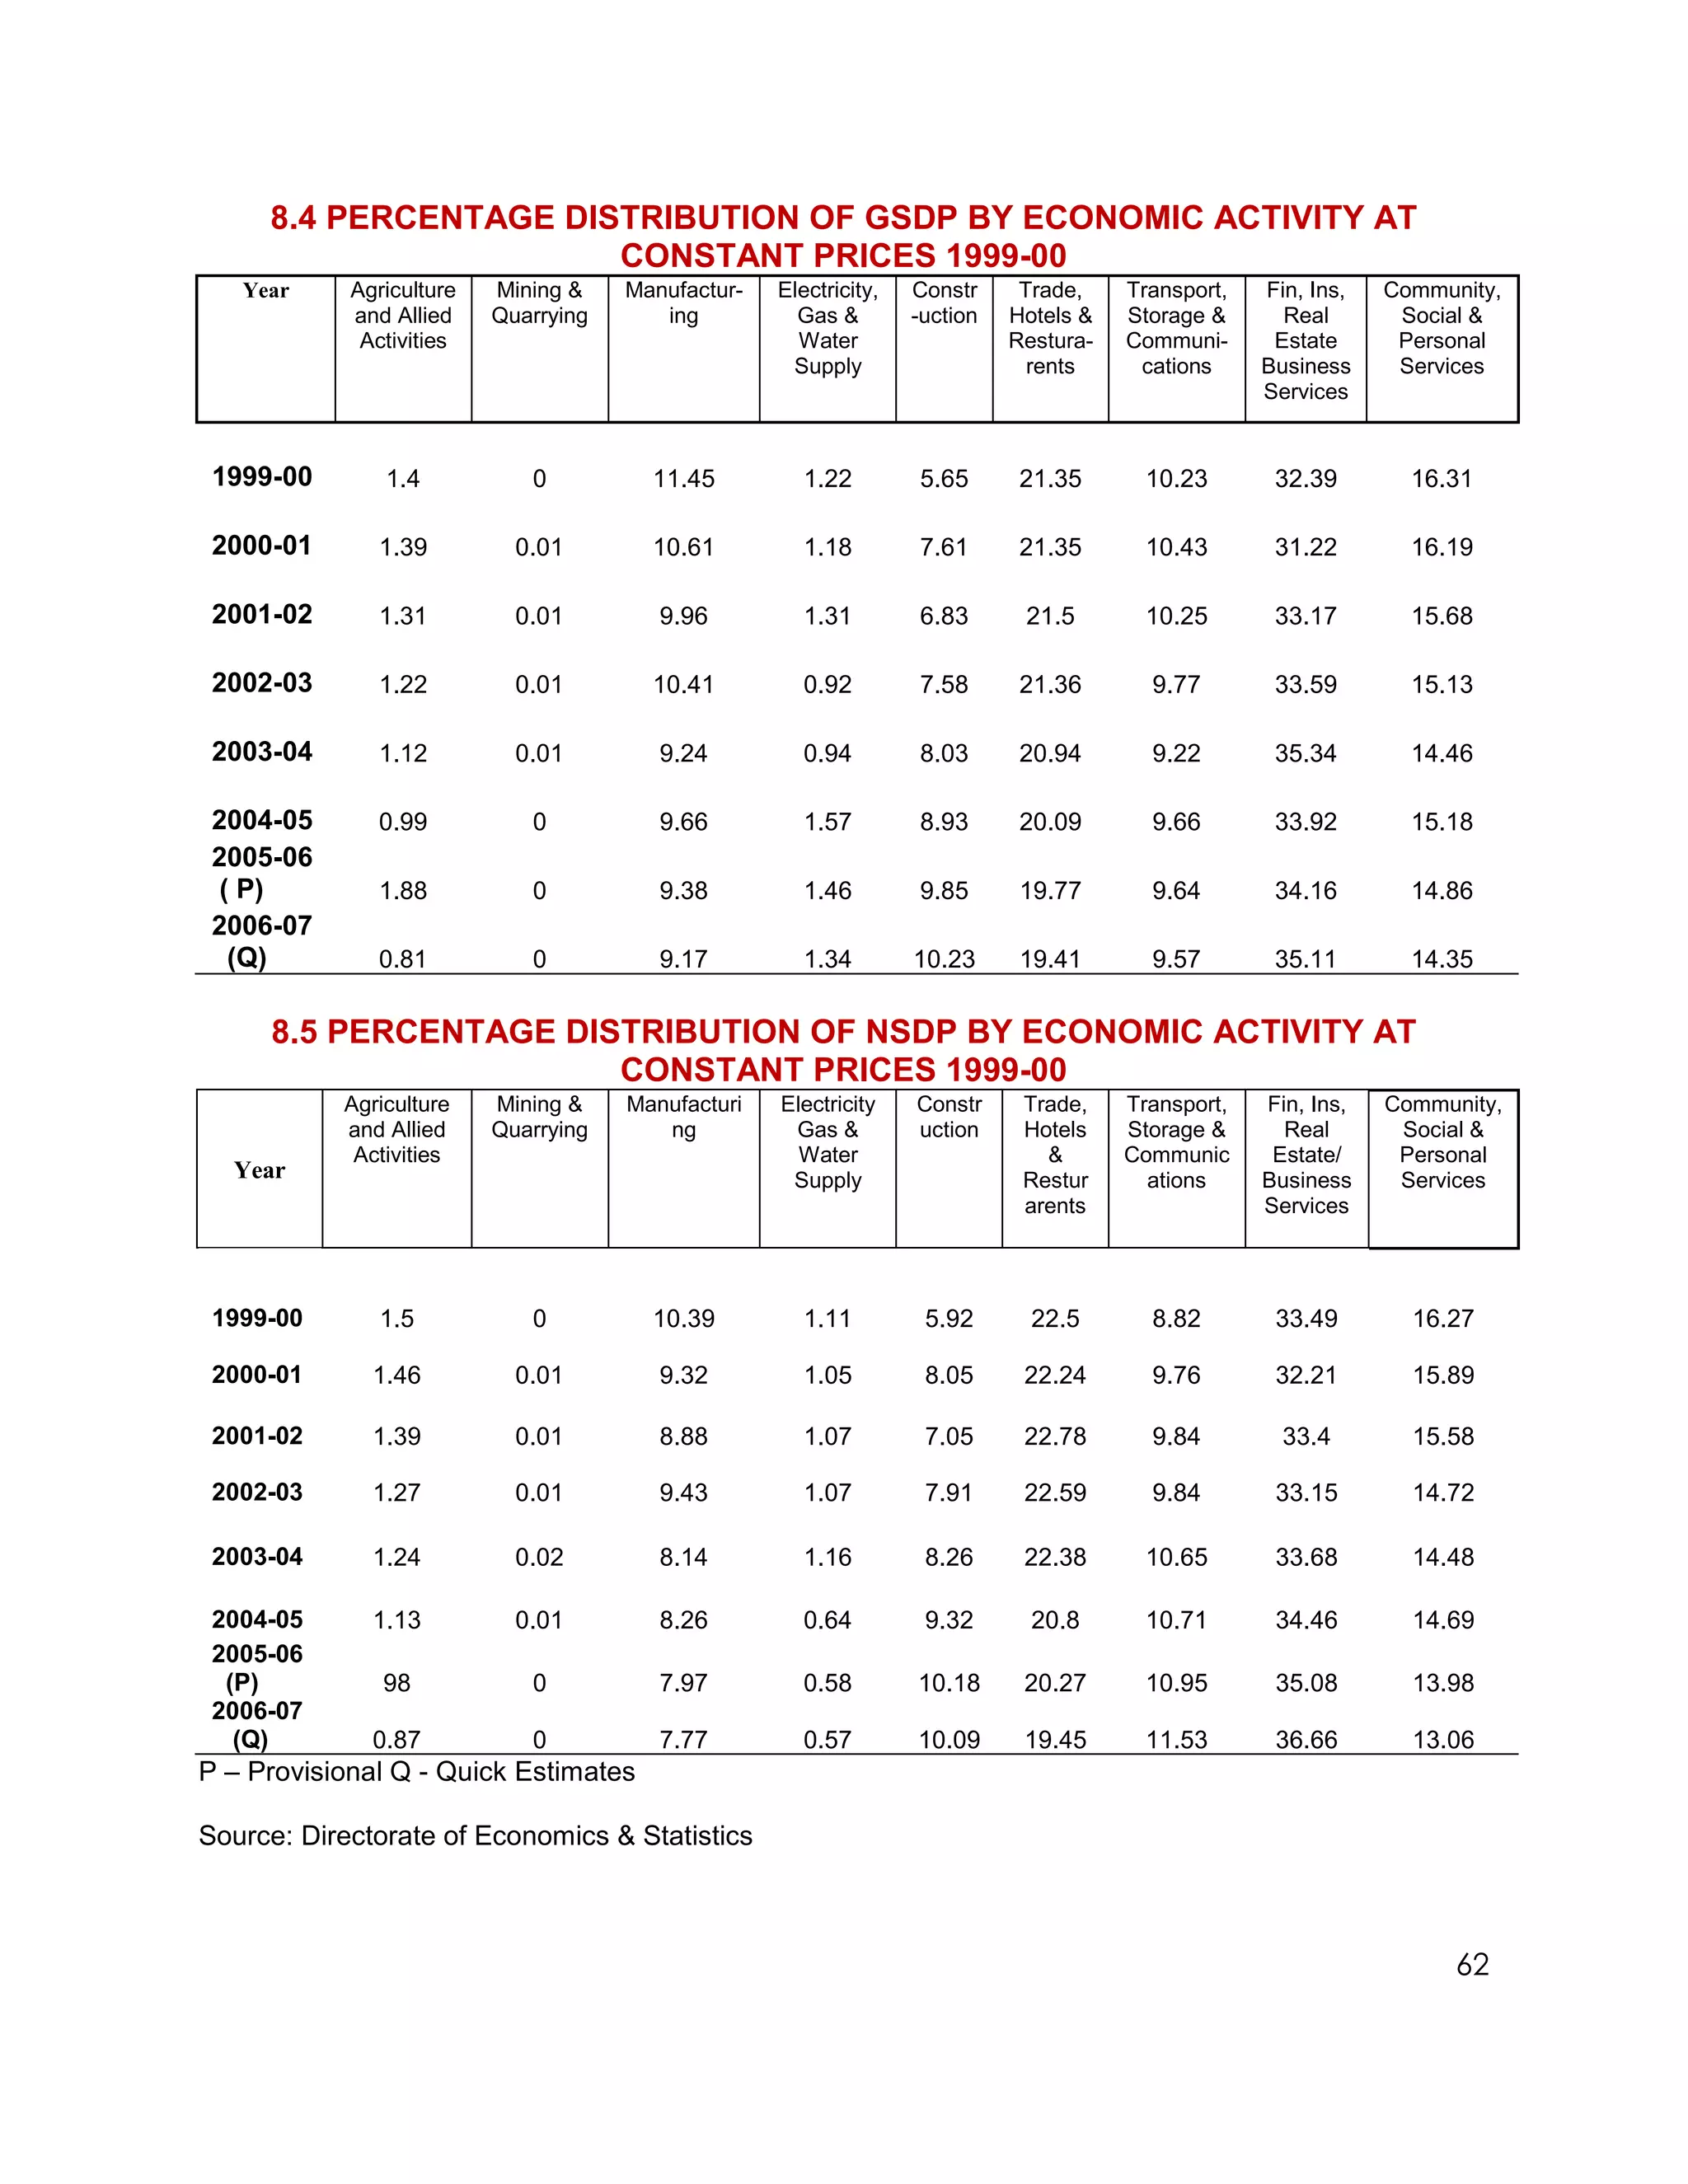
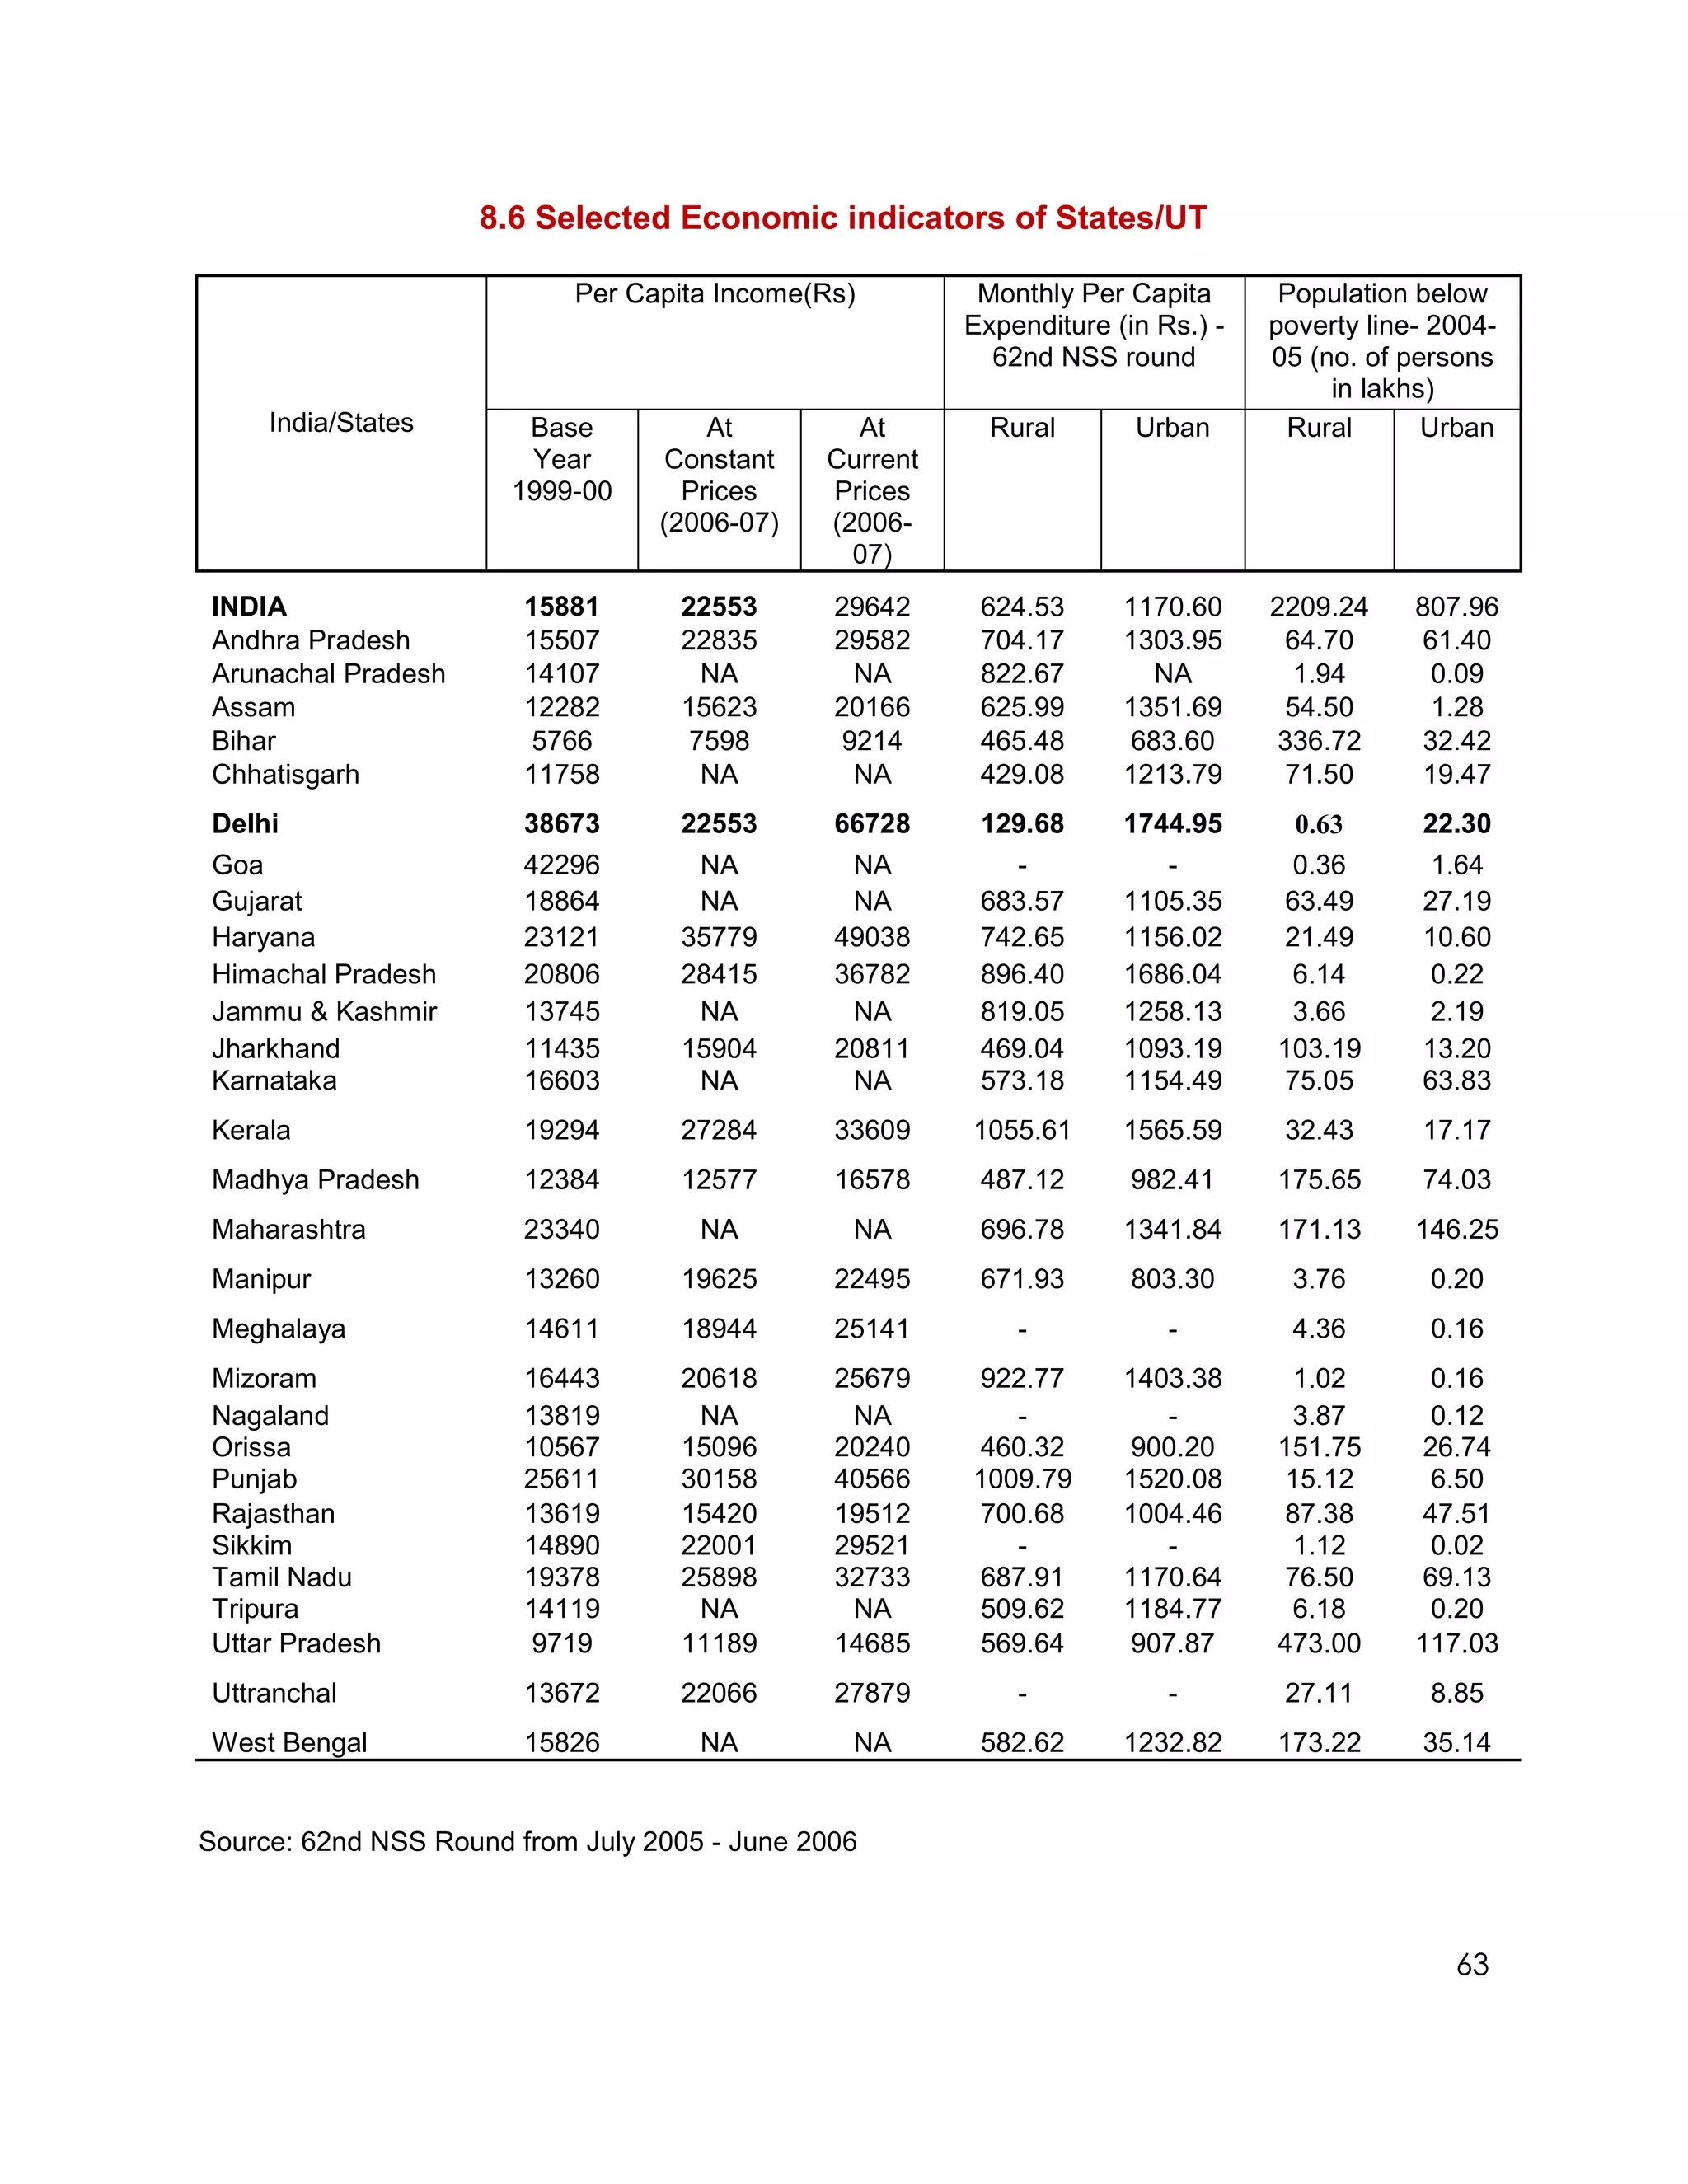
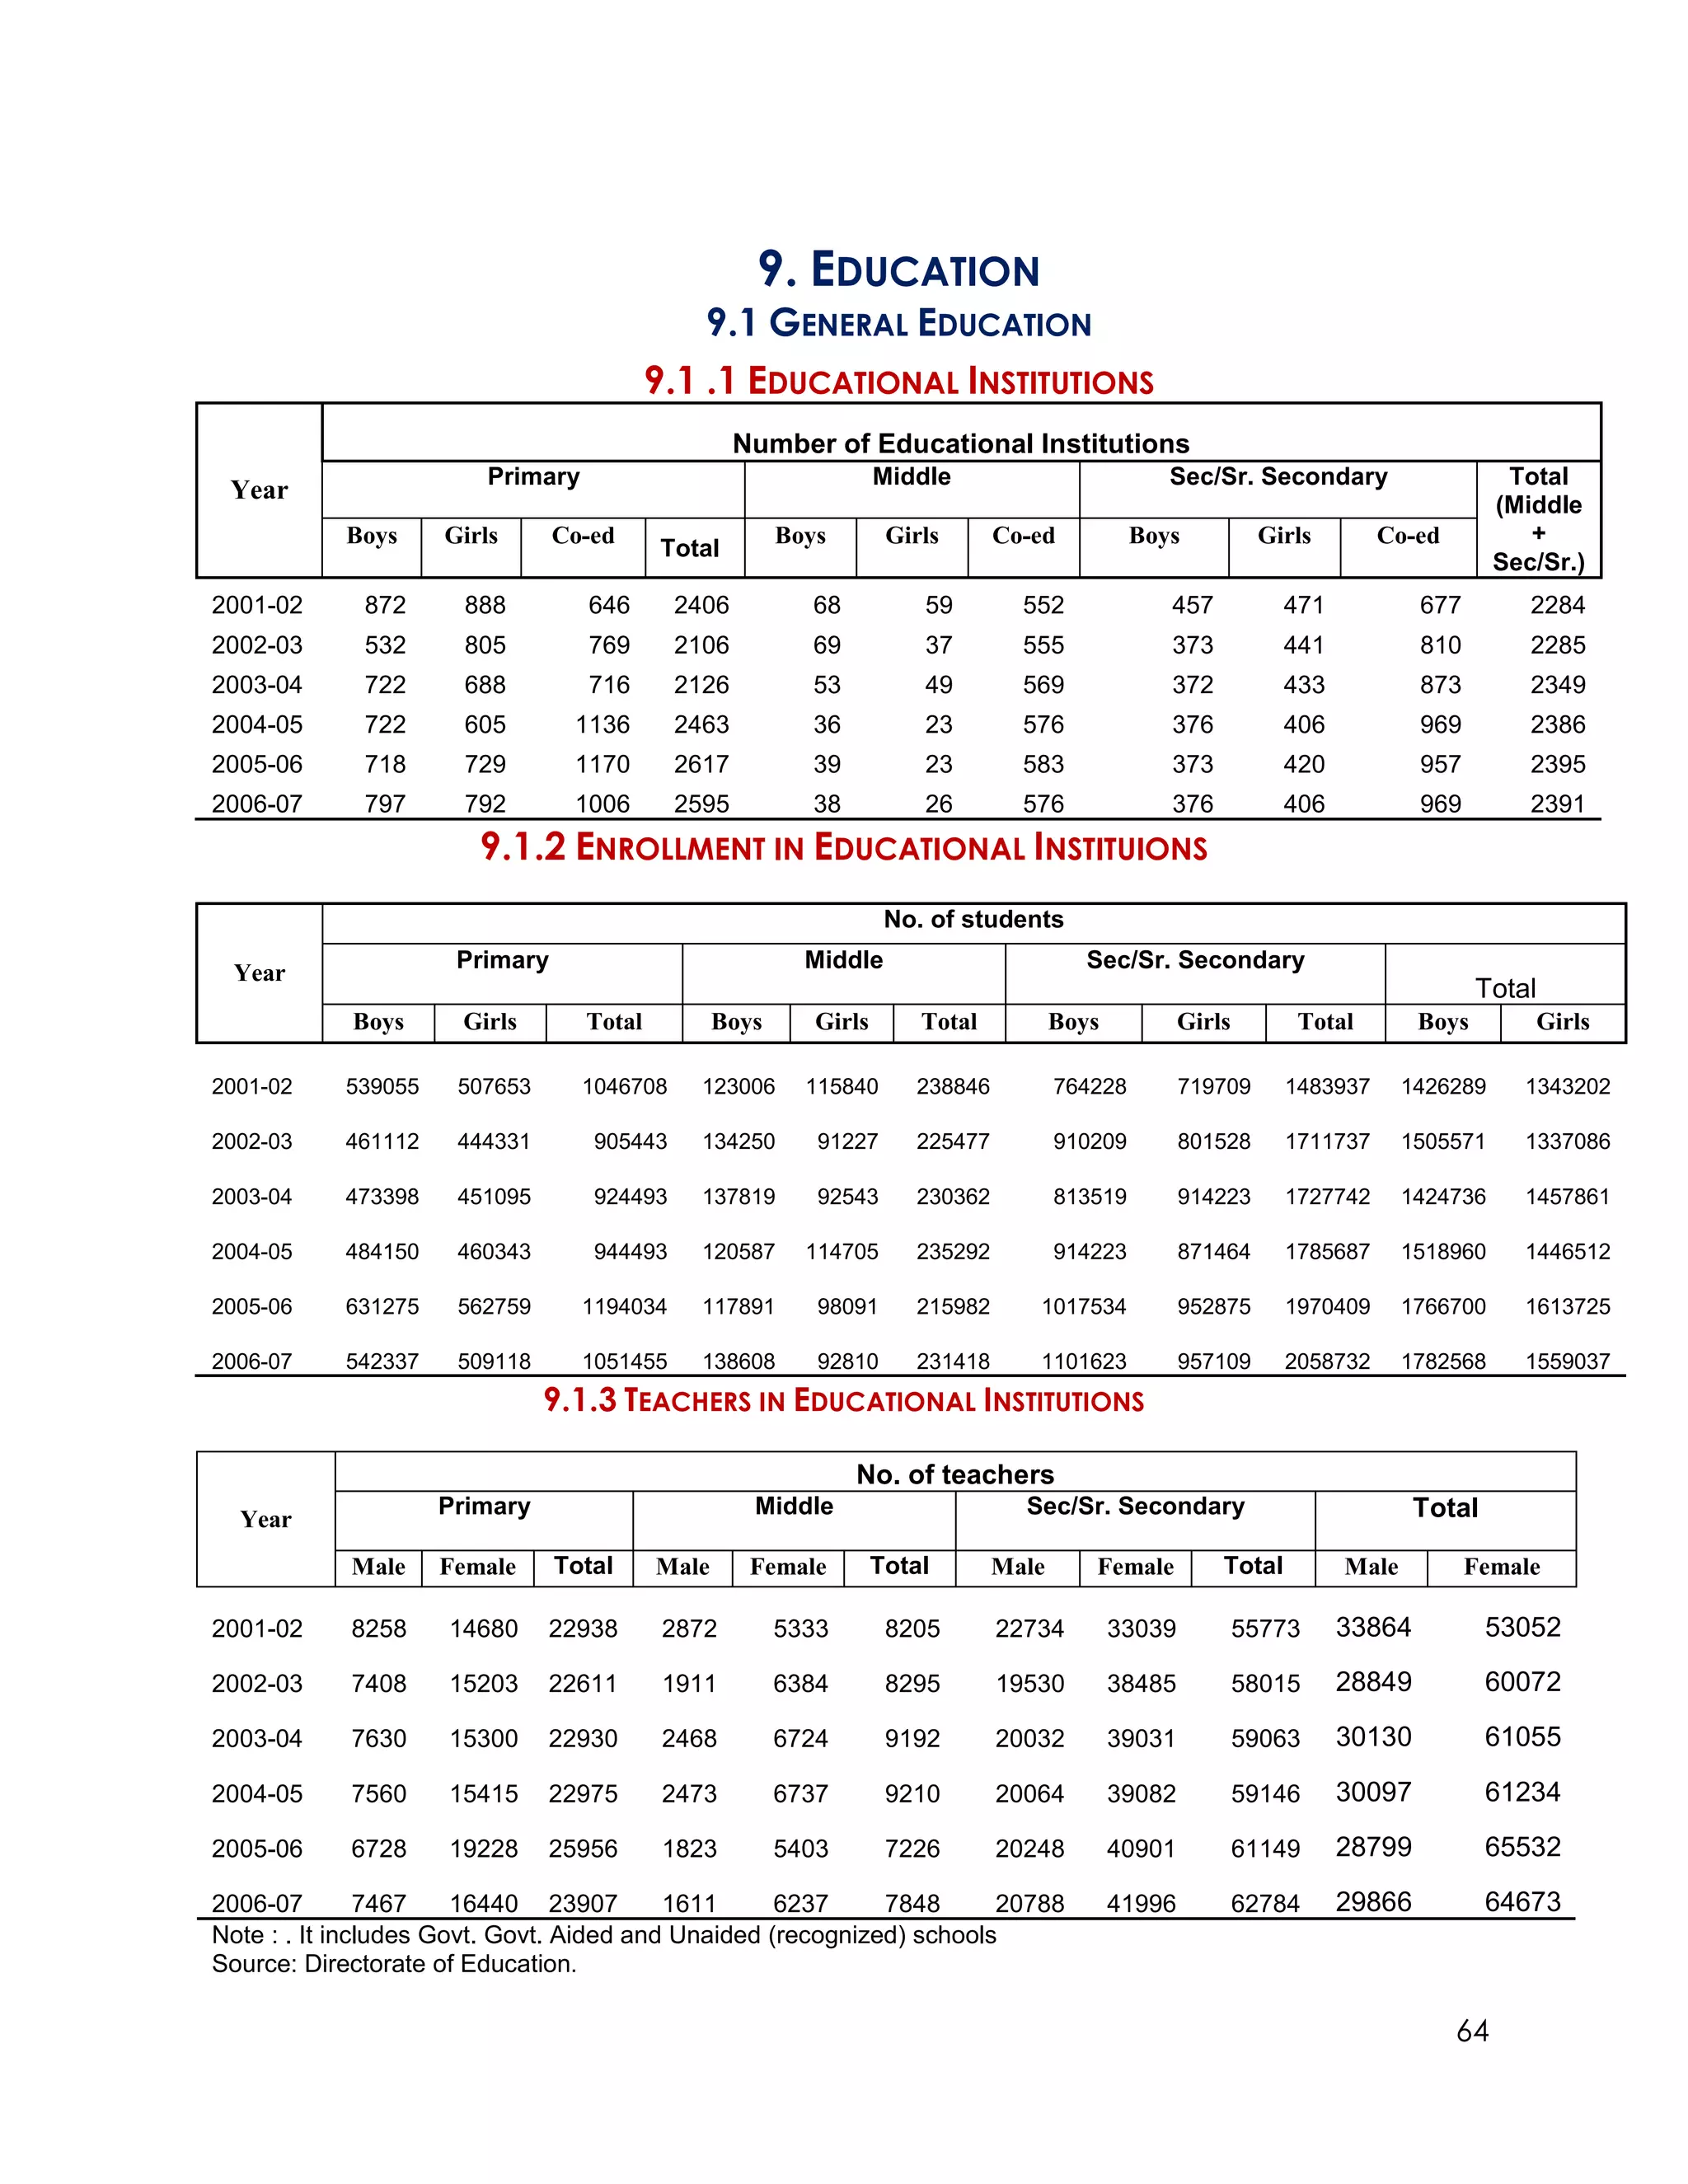
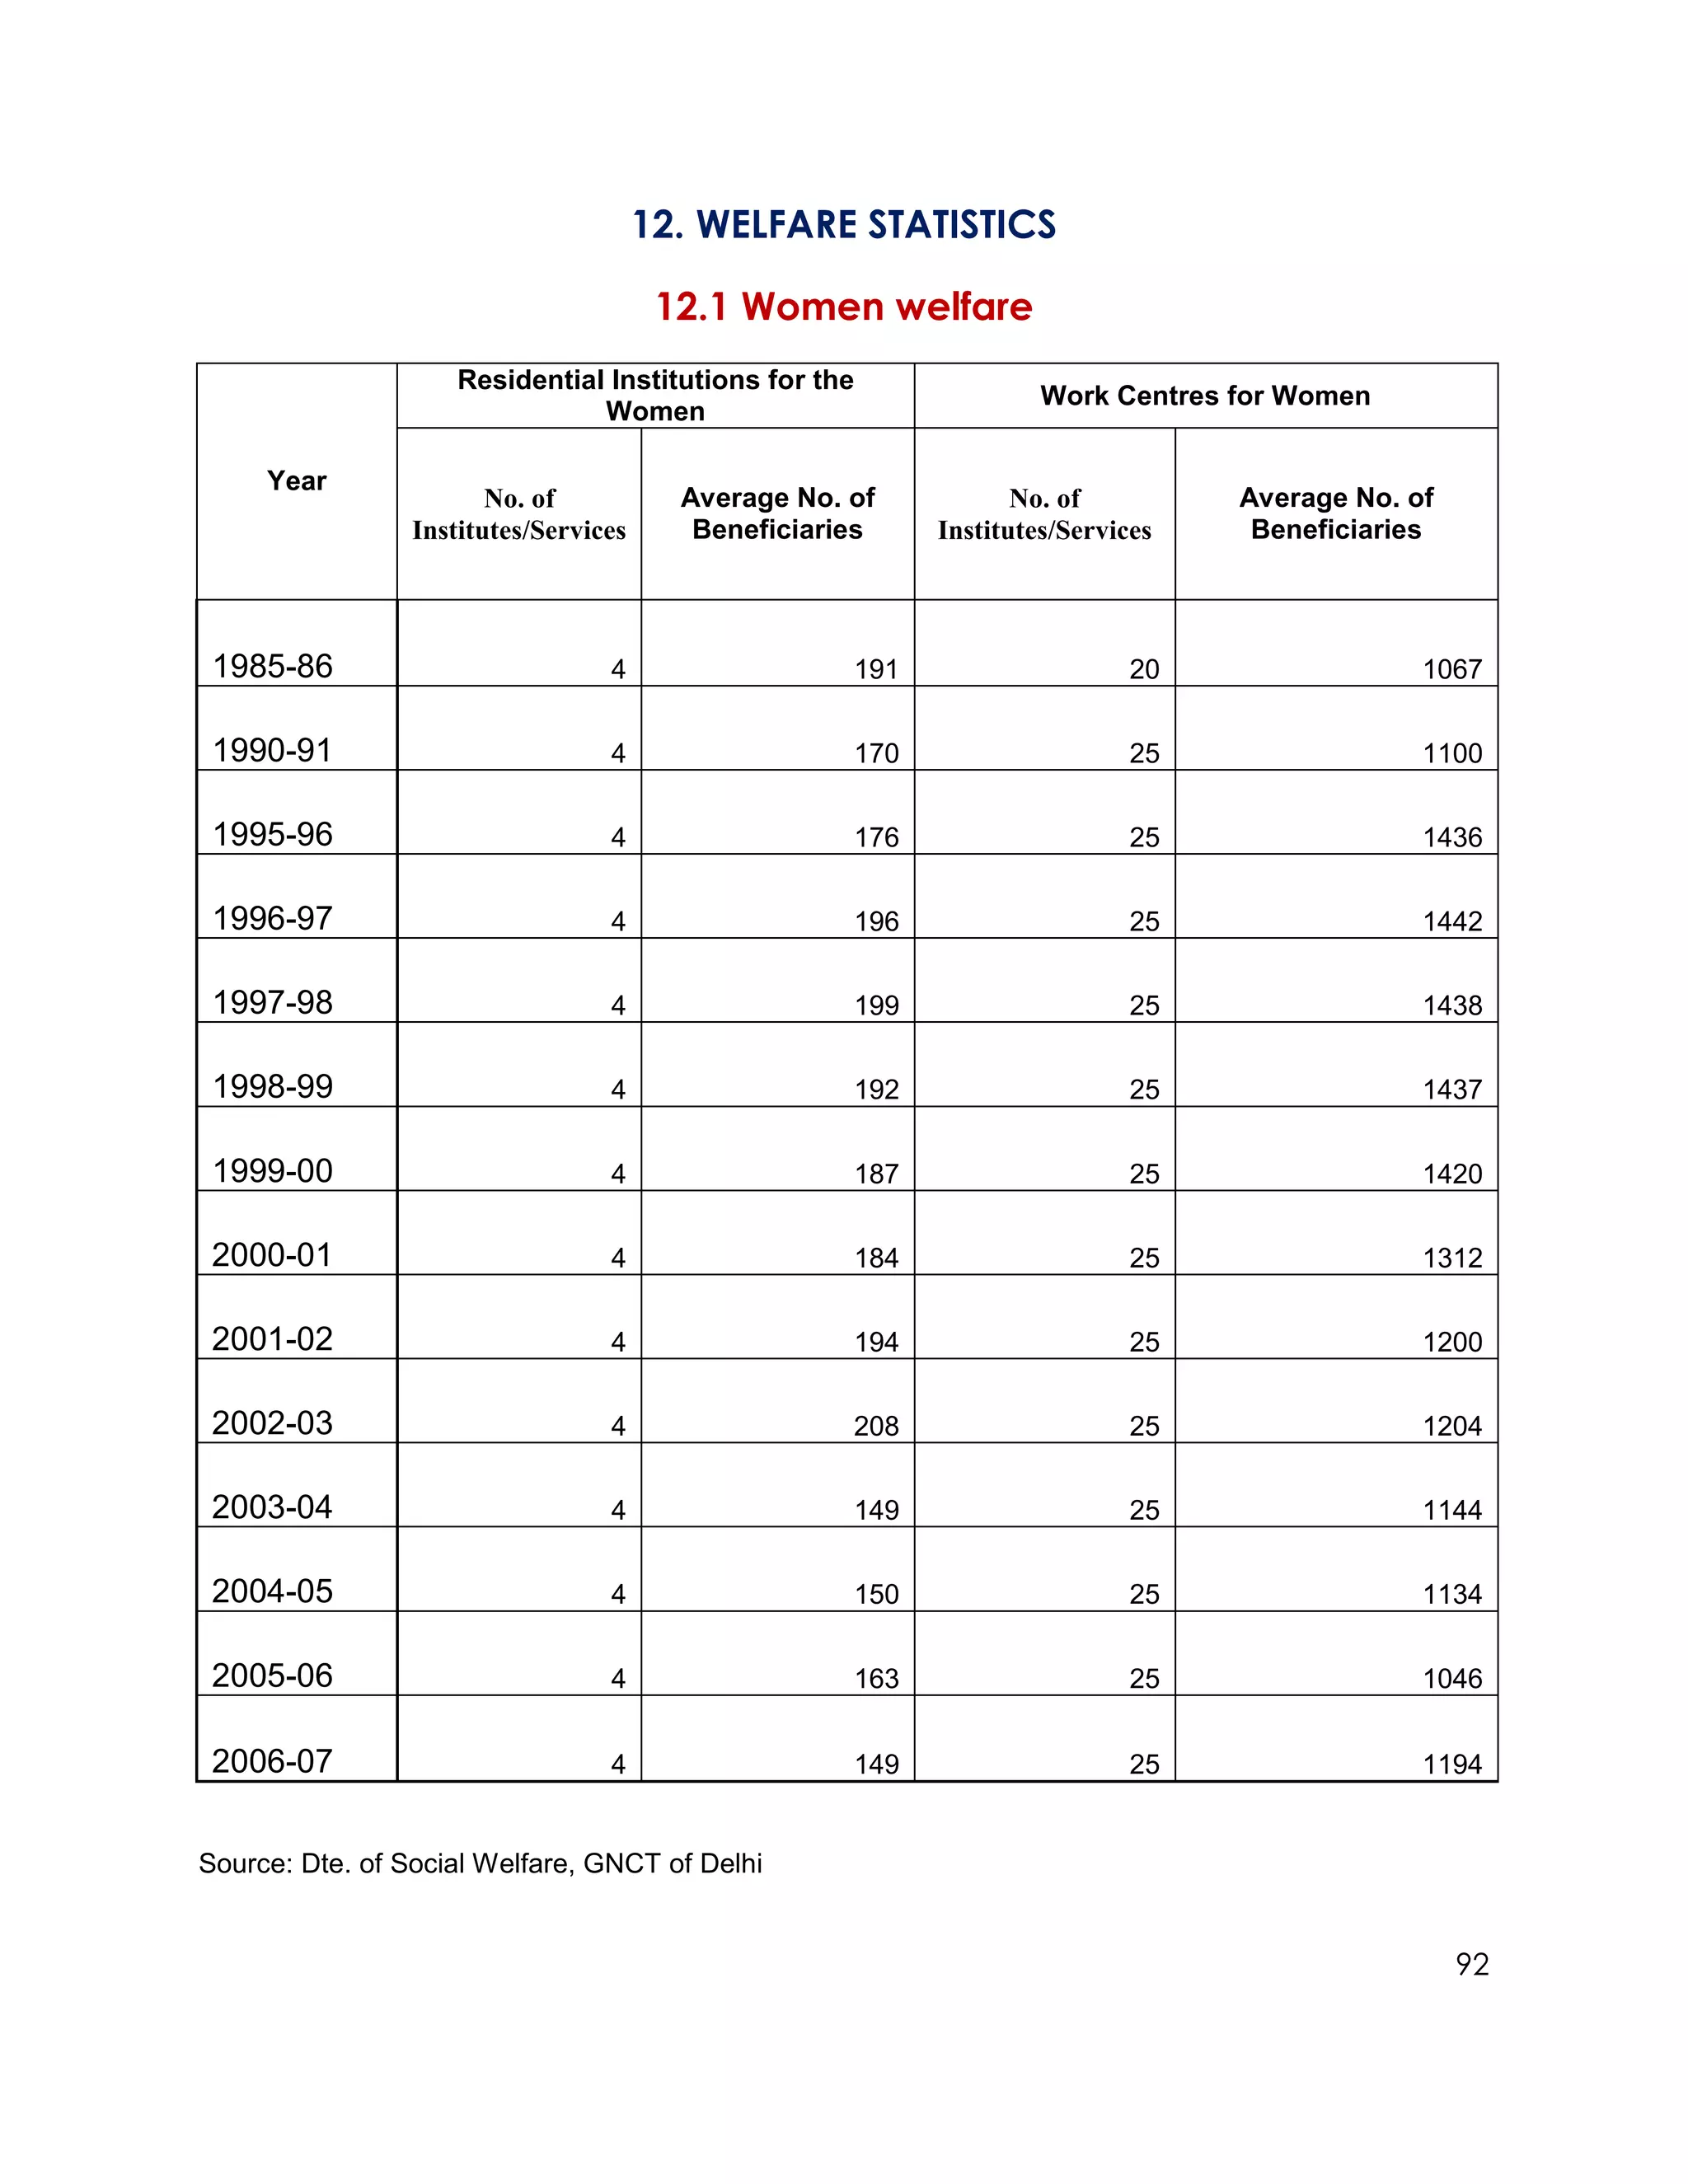
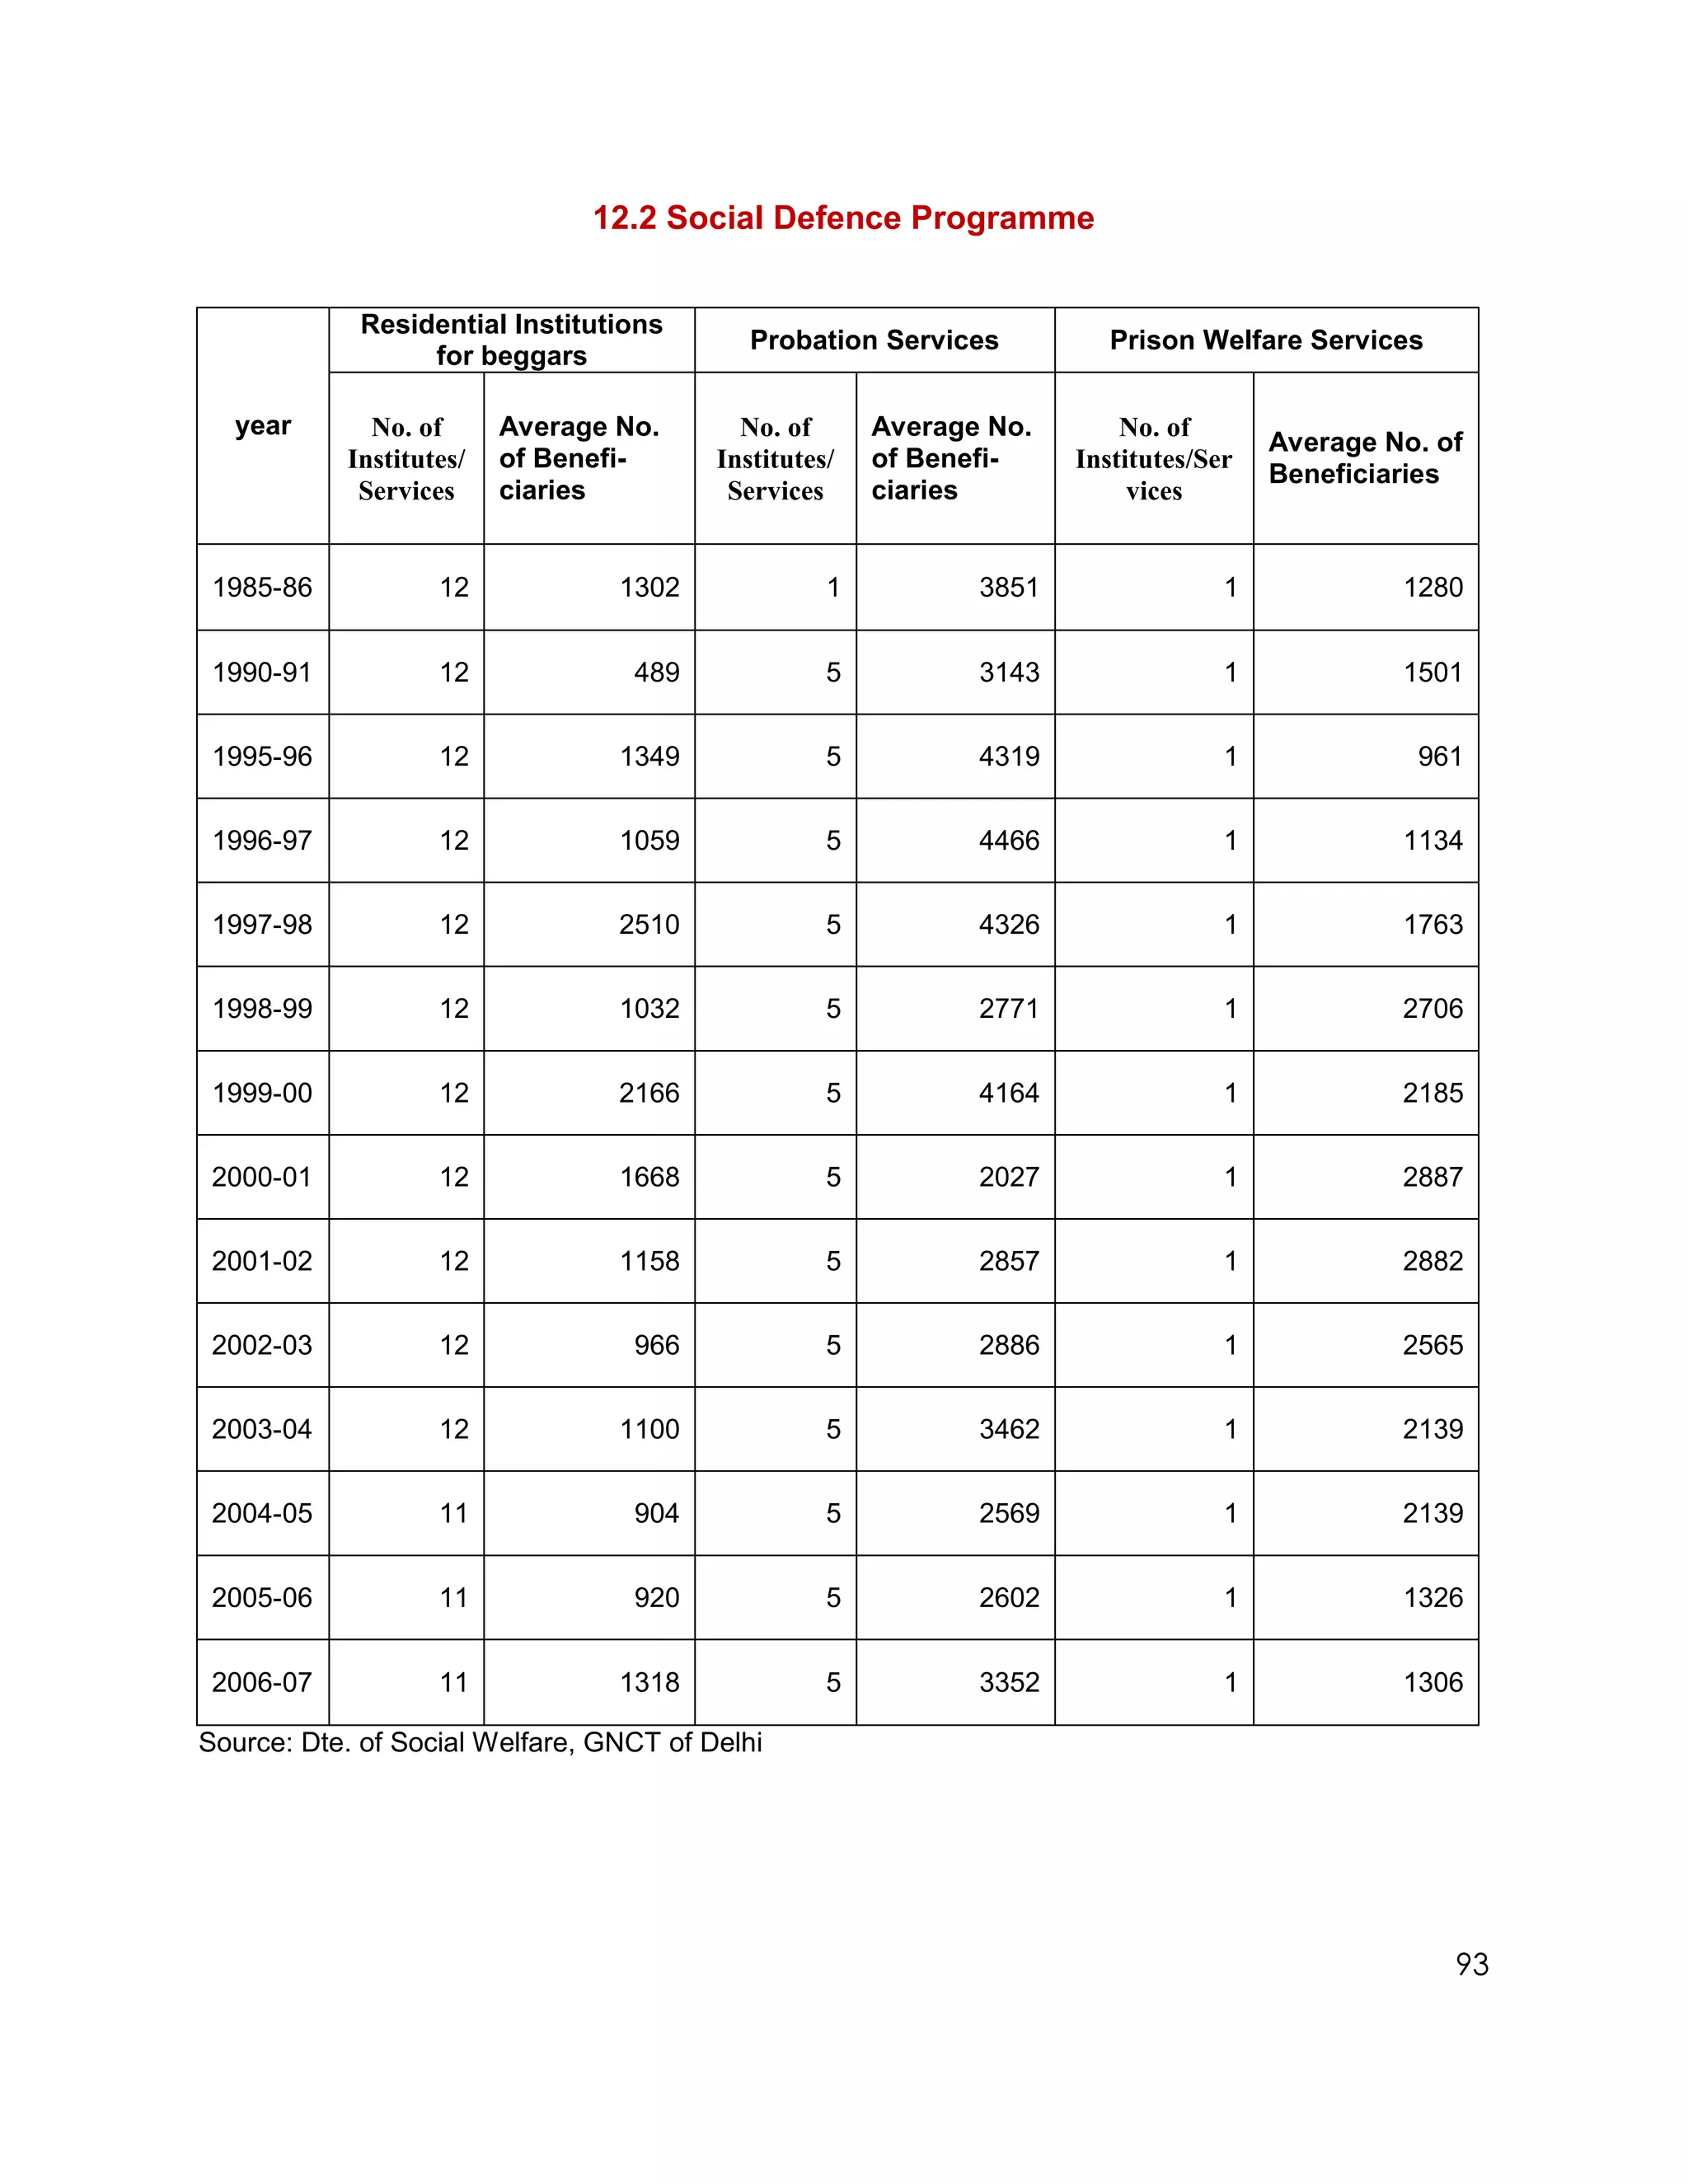
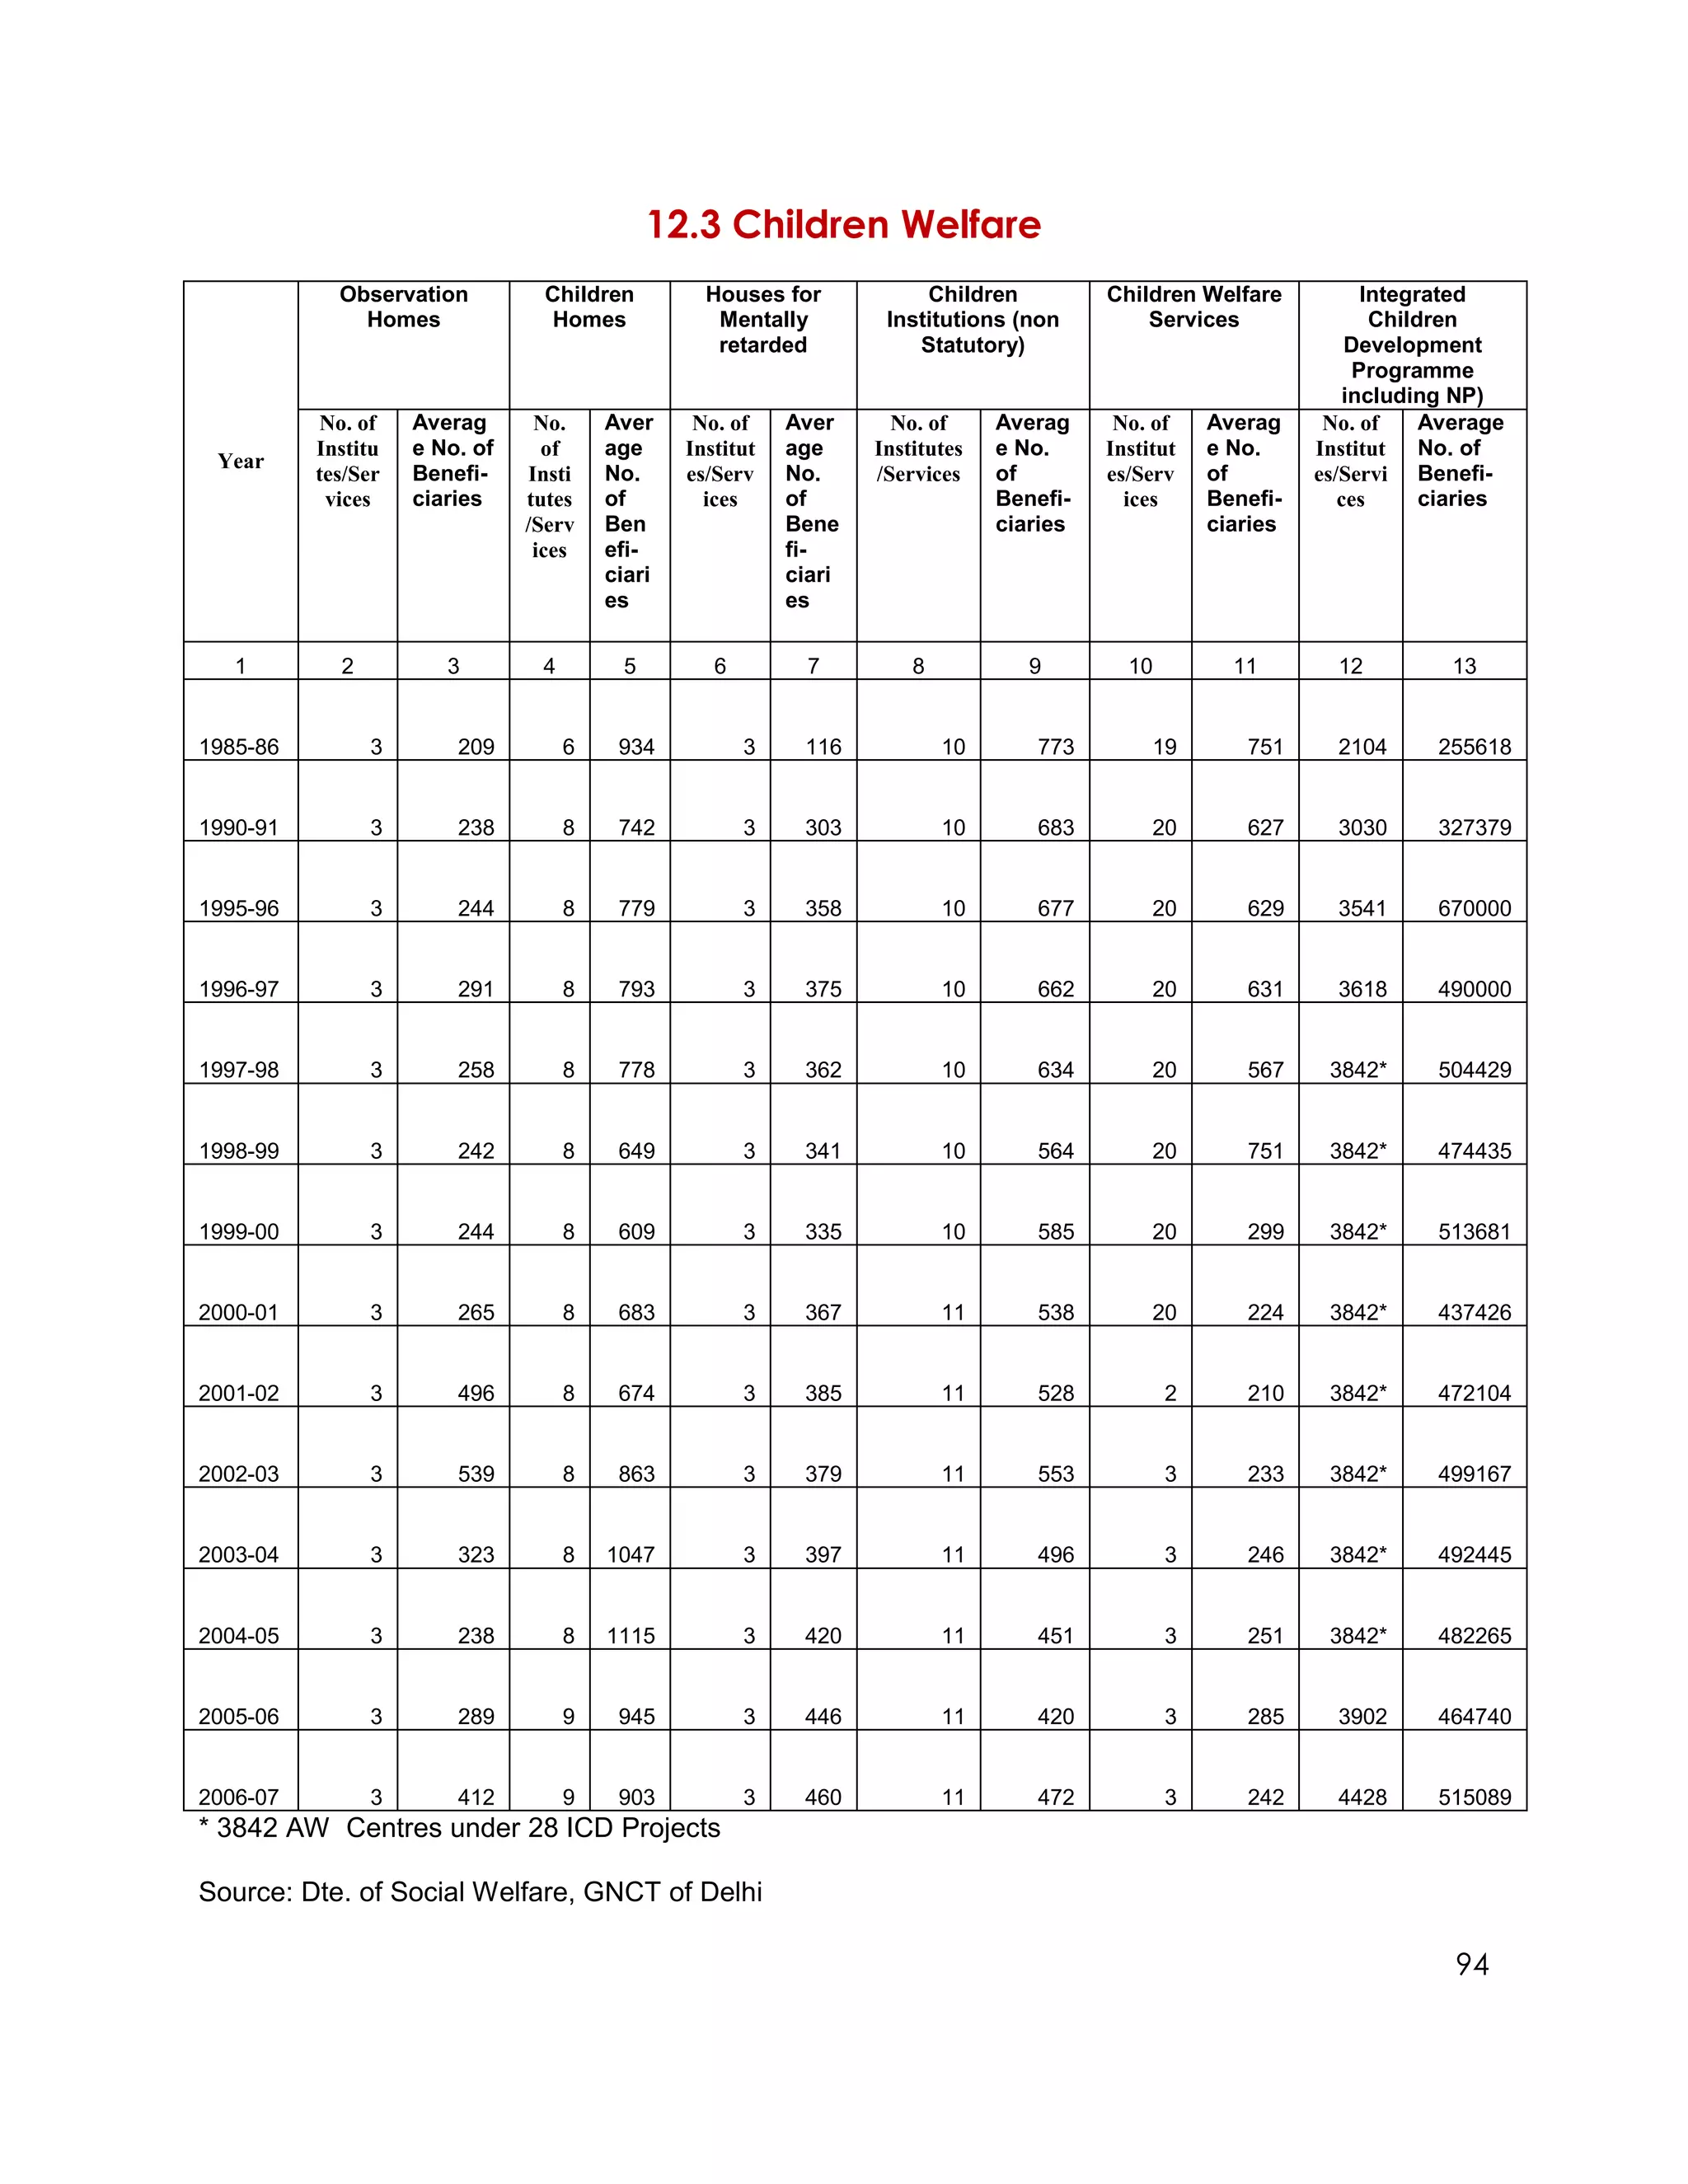
2) It contains time series socio-economic data on Delhi to assist with planning and policymaking. The data covers population, sectors of the economy, income, expenditure, prices, and social welfare.
3) The report was prepared under the guidance of Director Dr. B.K. Sharma with contributions from a team including Deputy Director N.T. Krishna and Statistical Officer Indu Mohan.