Download to read offline


![will be less effective if they fail to take into account the
differences between men, women, boys and girls. Gender-
blind policies may exacerbate the problems associated
with climate change by widening inequalities between the
sexes.16
Special attention may be required to compensate
for inequalities that women currently face.
Given women’s significant engagement in food pro-
duction and preparation and the potential for land use to
contribute to climate-change solutions in developing coun-
tries, the close connection between gender, farming and
climate change deserves far more analysis than it currently
receives. Because of greater poverty, lesser power over their
own lives, less recognition of their economic productivity
and their disproportionate burden in reproduction and
child-raising, women face additional challenges as climate
changes. The recent experiences of natural disasters—
some logically related to climate change, others clearly not
(See Box 4: What do tsunamis have to do with climate
change?)—indicate that women are more likely to lose
their lives and otherwise fare worse than men in extreme
events from heat waves to hurricanes and tsunamis.
In Bonn in June 2009, a negotiating text drafted by
the Ad Hoc Working Group on Long-Term Cooperative
Action under the UNFCCC reflected the growing recog-
nition of the importance of gender in the climate-change
debate. The text included 13 references to gender, 17 ref-
erences to women, and one reference to the Convention
on the Eradication of All Forms of Discrimination
Against Women. Greater participation of women in the
climate issue—whether as scientists, community activists,
or negotiators at conferences of the Intergovernmental
Panel on Climate Change parties—can only benefit soci-
ety’s response to climate change by adding to the diversity
of perspectives on how to address the challenge of cli-
mate change. This participation, in turn, can be aided by
improving women’s legal and social equality with men
and their equal enjoyment of human rights, including the
right to sexual and reproductive health and the determi-
nation of whether and when to bear children.
The Intergovernmental Panel on Climate Change,
among the thousands of pages of its assessment reports,
devoted one half page of text in 2007 to the issue of “gender
aspects of vulnerability and adaptive capacity” in response to
climate change and comparable natural disasters. Women,
7THE STATE OF WORLD POPULATION 2009
the box noted, “are disproportionately involved in natural
resource-dependent activities, such as agriculture, compared
to salaried occupations.” Moreover, the “disproportionate
amount of the burden endured by women during rehabili-
tation [from weather-related disasters] has been related to
their roles in the reproductive sphere.” The text concluded
that the influence of gender in resilience to climate change
impacts is “an important consideration” in developing
interventions for adaptation, that gender differences related
to adaptation “reflect wider patterns of structural gender
inequality,” and that a policy shift toward “more proactive
capacity-building” was needed to reduce gender inequality.17
Women, in fact, rarely make up more than about 15
per cent of the authors of the Panel’s assessment reports.
Recent action
To arrive collectively at a set of agreements to accomplish
the goals of climate change mitigation (reducing emis-
sions or otherwise lowering atmospheric concentrations
of greenhouse gases) and adaptation (minimizing social
and economic disruption from climate change impacts),
most of the world’s nations have ratified the UNFCCC.
The treaty, which entered into force in 1994, calls on the
world’s nations to “achieve stabilization of greenhouse-gas
concentrations in the atmosphere at a level that would
prevent dangerous anthropogenic interference with the
climate system. Such a level should be achieved within a
4 What do tsunamis have to do with
climate change?
Because there is so little current or reliable research on
many aspects of climate change, scientists must some-
times look at climate-change proxies for insights into how
climate change affects women, men, boys and girls dif-
ferently, or how each sex responds or adapts to natural
disasters. Proxies are events that resemble climate change
in some details.
Periodically, this report uses extreme events of many
kinds as proxies. It considers the impacts of storms (which
may be related to climate change), tsunamis (which
clearly are not) and comparable natural disasters as one
method of envisioning how climate change may affect
migration, health, income-earning opportunities and gen-
der relations in the coming years.](https://image.slidesharecdn.com/englishswop09-100206210849-phpapp01/75/State-of-World-Population-2009-15-2048.jpg)

![9THE STATE OF WORLD POPULATION 2009
distract from the need to reduce emissions as rapidly as
possible, starting now.
Long-term mitigation: Critically needed early successes
in reducing emissions will be a prelude to a task likely to
preoccupy people for decades, even centuries: prospering
globally while keeping human activities from sending
the global atmosphere and climate outside the range of
human habitability.
The 1994 International Conference on Population
and Development, or ICPD, was a milestone in the his-
tory of population and development. At the conference,
the world agreed that population is not about numbers,
but about people. The conference’s 20-year Programme
of Action, adopted by 179 countries, argues that if needs
for family planning and reproductive health care are met,
along with other basic health and education services, then
population stabilization will occur naturally, not as a mat-
ter of coercion or control.
There is good reason to believe that achievement of
the ICPD’s goal of universal access to reproductive health,
in combination with improved education of girls and
gender equality, would help achieve health and develop-
ment objectives while also contributing to declines in
fertility, which would in turn help reduce greenhouse-gas
emissions in the long run. These fertility declines would
by themselves—even in combination with increased
maternal and child survival, to which reproductive health,
education and gender equality also powerfully contribute—
lead to population levels below those foreseen in most
greenhouse-gas emission scenarios developed for the
Intergovernmental Panel on Climate Change. A growing
body of research indicates that stabilization of population
will help reduce greenhouse-gas emissions in the long
run. Universal access to voluntary family planning is
one intervention that will help hasten this stabilization.
The representatives of Governments and non-
governmental organizations who crafted the ICPD’s
Programme of Action achieved two remarkable advances
that may offer lessons to those who are grappling with treaty
and protocol language on climate change in Copenhagen
in December 2009. One, they completed the transforma-
tion of population growth as a matter of human rights and
the right of all people to make their own decisions regard-
ing reproductive health. And two, they envisioned a means
by which personal self-fulfilment would contribute to the
well-being of families, communities, nations and ultimately
to the environmental sustainability of the world as a whole.
The Programme of Action is a model of what success
could look like in the climate arena. In particular the
world’s nations may eventually conclude that a recogni-
tion of the right to development and to equal use of the
global atmosphere and environment—coupled with the
equal enjoyment of these and all rights by women, men,
girls and boys, young and old—will cement an agreement
by which all nations can abide.
The linkages between population and climate change
are in most cases complex and indirect. But the nature of
these linkages is becoming clear enough to arrive at the
key recommendations of this report for mitigating climate
change and aiding adaptation to it: elicit a new level of
engagement by Governments in the areas of population
and development, provide access to reproductive health
and actively support gender equality.
6 “Climate change,” the ICPD
Programme of Action and the
Millennium Development Goals
The 1994 ICPD Programme of Action mentions “cli-
mate change” twice, first in its preamble as an ecological
problem “largely driven by unsustainable patterns of pro-
duction and consumption [and] adding to the threats
to the well-being of future generations.” The document
calls for “increased international cooperation in regard to
population in the context of sustainable development” but
offers no specifics about how to marshal and apply this
cooperation or the specifics of population’s role in sustain-
able development. A second mention of climate change
encourages Governments to “consider requests for migra-
tion from countries whose existence...is imminently
threatened by global warming and climate change.”
20
Global concern about climate change grew in the
years between the 1994 ICPD and the 2000 Millennium
Development Goals. Ending the growth of greenhouse-
gas emissions by 2015 is one of the targets for Millennium
Development Goal 7, which aims at ensuring environmen-
tal sustainability. A 2008 report on the Goals mentions
population growth in passing three times but does not
explore population dynamics or their relationship with
environmental sustainability or the other Goals.](https://image.slidesharecdn.com/englishswop09-100206210849-phpapp01/75/State-of-World-Population-2009-17-2048.jpg)


![way based on each gas’ warming potential relative to
carbon dioxide, is emitted with each currency unit (such
as a dollar or euro) of economic activity. So if global
greenhouse-gas intensity declines fast enough, the global
economy can grow even while emissions shrink—the
principal objective of climate policy, since most decision
makers want economic growth but also want to reduce
greenhouse-gas emissions. Some argue that patterns and
levels of consumption are a more important influence
on climate change than population growth. In the early
1990s, when a debate on this question was especially
active among some researchers in both industrialized and
developing countries, environment and development
specialist Atiq Rahman of Bangladesh noted what he
called the “extreme disparity” in per capita emissions and
labelled consumption, rather than population, the “climate
bomb.” “Climate change is far more sensitive to con-
sumption patterns than to demographic considerations,”
Rahman wrote, since “demographic dynamics are subject
to greater inertial forces than consumption and produc-
tion patterns…. [T]ackling consumption not only has
sounder ethical foundations, but it also has greater scope
for rapid action.”12
The defense of consumption as the main arena for
action on emissions reduction has faded little in the last two
decades, perhaps in part because it shifts most of the blame
for climate change to wealthier countries with patterns of
higher consumption. “[T]he world’s richest half-billion
people—that’s about 7 per cent of the global population—
are responsible for 50 per cent of the world’s carbon dioxide
emissions,” wrote environmental journalist Fred Pearce in
2009. “Meanwhile, the poorest 50 per cent are responsible
for just 7 per cent of emissions.”13
Still, calculations of the contribution of population
growth to emissions growth globally produce a consistent
finding that most of past population growth has been
responsible for between 40 per cent and 60 per cent
of emissions growth. Indian researchers Jyoti Parikh
and J. P. Painuly noted during the early 1990s debate
mentioned above that falling birthrates in the 1990s
“could mean significant reductions in greenhouse-gas
emissions [over what would otherwise occur] by 2100.”
Each birth results not only in the emissions attributable
to that person in his or her lifetime, but also the
emissions of all his or her descendents. Hence, the
emissions savings from intended or planned births
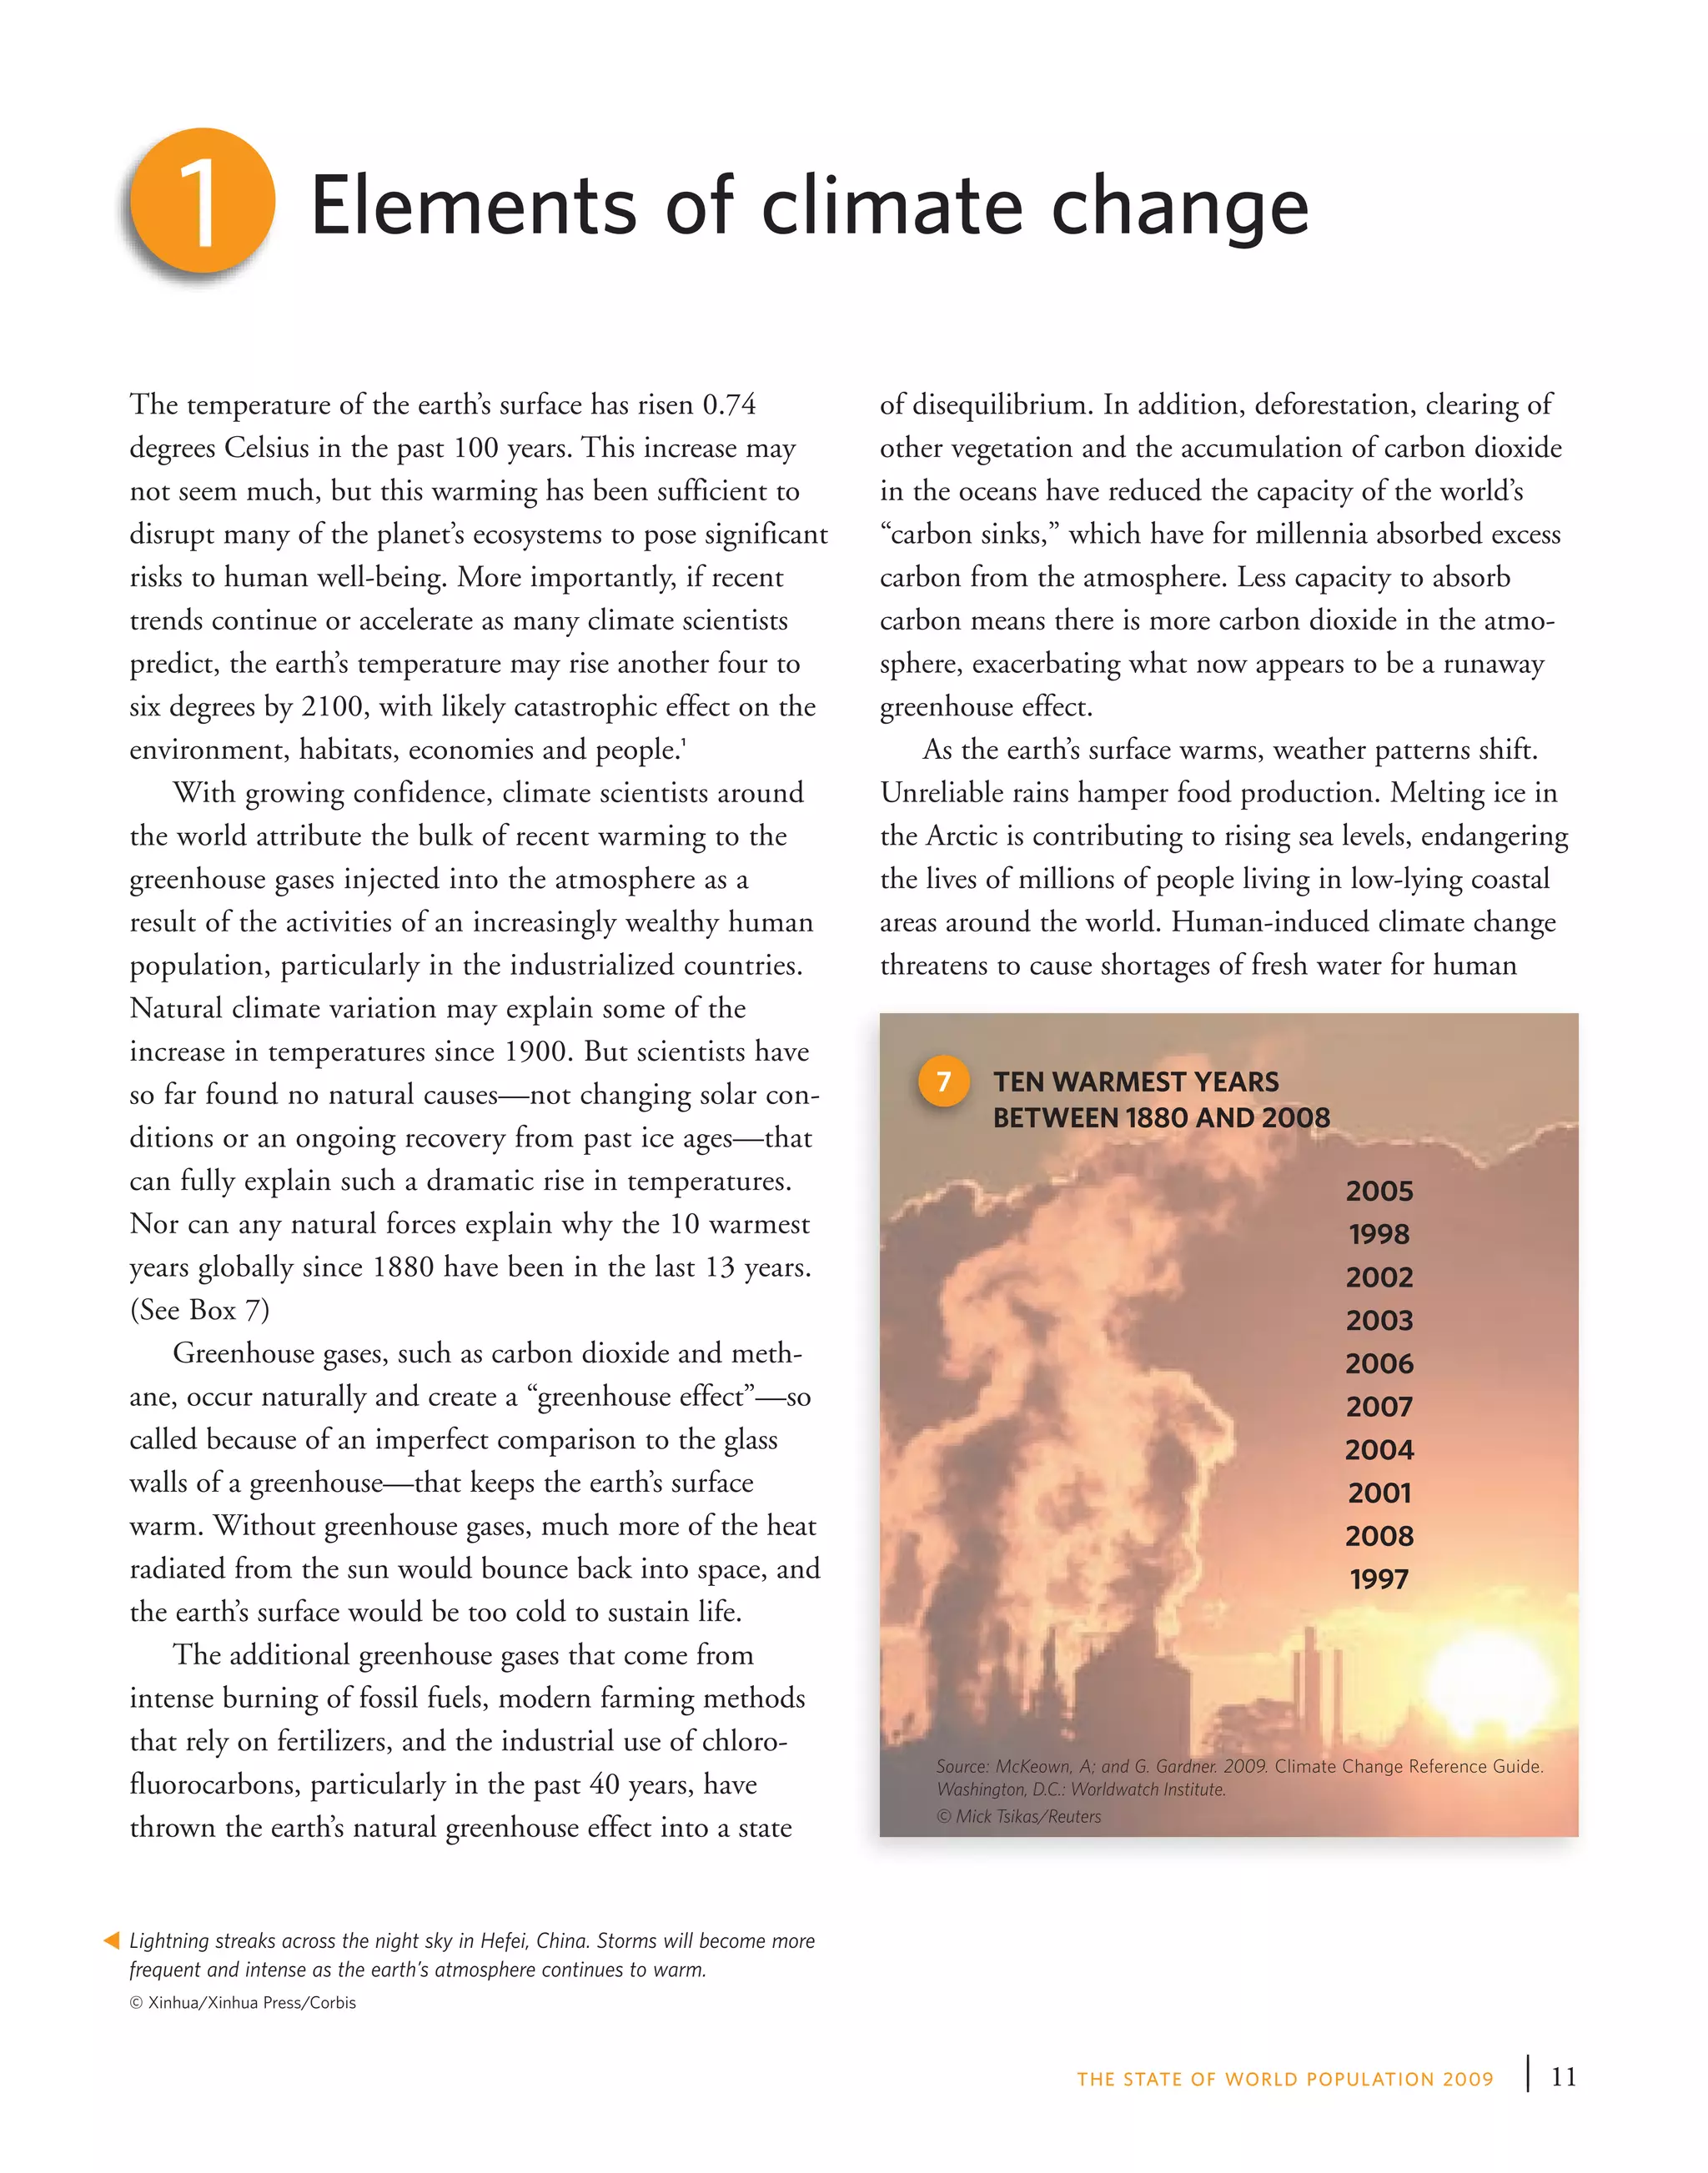
Figure 2.2: Per capita greenhouse-gas emissions and cumulative population of regions
“Annex I” countries are those that UNFCCC considers developed. “Non-Annex I” countries are those that are developing. The chart reflects all cases for which data are available to the Intergovernmental
Panel on Climate Change and reflects each group’s equivalent global-warming potential in carbon dioxide. The percentages indicated for each country group refer to the proportion of global energy-
related carbon-dioxide emissions. The figure shows that the average person in South Asia emits about three tons of carbon dioxide per year, while the average person in the United States and Canada
emits more than 25 tons of carbon dioxide annually. JANZ: Japan, Australia, New Zealand. EIT: economies in transition.
Source: Rogner, H.-H. and others. 2007. “Introduction.” Climate Change 2007: Mitigation. Contribution of Working Group III to the Fourth Assessment Report of the Intergovernmental Panel
on Climate Change. Cambridge: Cambridge University Press.
25
30
35
20
15
10
5
0
0 1,000 2,000 3,000 4,000 5,000 6,000 7,000
Cumulative population in millions
Tonsofcarbondioxideequivalentpercapita
USACanada:19.4%
Other non-Annex I: 2.0%
Non-Annex I
East Asia: 17.3%
Europe
AnnexI:
11.4%
Middle East: 3.8%
Africa: 7.8%
EITAnnexI:9.7%
Latin
America
Carribean:
10.3%
JANZ:5.2%
South Asia: 13.1%
21THE STATE OF WORLD POPULATION 2009](https://image.slidesharecdn.com/englishswop09-100206210849-phpapp01/75/State-of-World-Population-2009-29-2048.jpg)


![through major investments in energy technologies in a
medium population growth scenario.
British economist Nicholas Stern estimated that in
order to keep global temperatures from crossing into a
potentially catastrophic zone, “global average per capita
[greenhouse-gas] emissions...will—as a matter of basic
arithmetic—need to be around two tons by 2050,”
assuming a world population of 9 billion people and
speaking in terms of carbon dioxide equivalents. “This
figure is so low that there is little scope for any large
group to depart significantly above or below it.”33
If the world followed the trajectory of the United
Nations Population Division’s low-variant projection of
8 billion people, the earth’s atmosphere would be able to
tolerate higher per-capita emissions, since fewer people
would be emitting greenhouse gases.34
The low-variant pro-
jection assumes lower fertility rates that might result from
increased access to reproductive-health services, including
family planning, and other actions to increase opportuni-
ties and freedoms for women and girls. One study of the
cost of averting a fixed amount of fossil-fuel carbon-dioxide
emissions found that dollar-for-dollar, investments in
voluntary family planning and girls’ education would also
in the long run reduce greenhouse-gas emissions at least as
much as the same investments in nuclear or wind energy.35
According to a 1992 report by a committee of the
United States National Academy of Sciences, “family
planning impacts on greenhouse-gas emissions are
important at all levels of development.” The committee
concluded, “The reduced population growth associated
with higher income growth…offsets in large part the
higher greenhouse-gas emissions associated with faster
economic growth. The family planning effects indicate
that, as of 2020, carbon emissions will be about 15 per
cent lower for the lower-, middle- and upper-middle-
income countries than they would be without family
© Amanda Koster/Corbis
26 CHAPTER 2: At the brink](https://image.slidesharecdn.com/englishswop09-100206210849-phpapp01/75/State-of-World-Population-2009-34-2048.jpg)


![39THE STATE OF WORLD POPULATION 2009
Farmers in Malawi used to be able to predict the coming
of the rains, but no longer. So Mazoe Gondwe, the food
provider for her family, diversifies production by dividing
her plot of land among rain-fed and irrigated crops, hop-
ing for the best.
“But irrigation is back-breaking and can take four
hours a day,” she told a reporter in late December 2008.
Invited by a European non-governmental organization
to tell her story at the 14th Conference of the Parties to
the United Nations Framework Convention on Climate
Change, held in Poznan´, Poland, Ms. Gondwe said she
needed better irrigation technology to cut the time she
spends watering crops. Improved storage facilities and bet-
ter seed varieties, she added, would be welcome as well.
“As a local farmer, I know what I need and I know
what works,” she said. “I grew up in the area and I know
how the system is changing.”2
Unfortunately for Ms. Gondwe—and for the rest of
us—the climate system will keep changing. Four decades
from now, average temperatures in Malawi probably
will have risen by at least a full degree Celsius, and agri-
cultural yields will have fallen significantly. Meanwhile,
Malawi’s population is projected to grow from today’s 15
million to as many as 41.5 million in 2050.3
The adaptation imperative
Unless some counterbalancing force beyond any current
scientific understanding intervenes, the built-in momen-
Building resilience4
tum of the climate system means that temperatures are
likely to rise for decades. The world needs to prepare
now for a warming world, even if we cannot predict
with any confidence how fast it will heat up—or when
and where the heating will end. And while no scientist
can assure us that any particular extreme weather event
“Adaptation is more than a destination; it is a journey, dynamic and continuous, and non-linear.
In many countries, populations are coping with climate change, but they are not adapting.”
—Sumaya Zakieldeen, Sudanese Environmental Conservation Society
1
Two women negotiate flood water in the Moroccan town of Souk Larbaa.
© AFP
t
20 Extreme weather, poor responses
According to a report published in 2009 by Oxfam
International, the year 2007 “saw floods in 23 African and
11 Asian countries that were the worst in decades. Two
hurricanes and heavy rains hit much of Central America;
almost half the state of Tabasco in Mexico was flooded.
As the United Nations Emergency Relief Coordinator John
Holmes put it: ‘…all these events on their own didn’t have
massive death tolls, but if you add [them] together you
get a mega-disaster.’ But 2008 offered no let-up in the
barrage of climatic disasters, as Cyclone Nargis devastat-
ed large parts of Myanmar, and a particularly destructive
Atlantic hurricane season caused hundreds of deaths and
massive economic damage across Cuba, the Dominican
Republic, Haiti, and the United States. In many cases, fail-
ures in environmental management increased the impact
of these climate hazards. In India, the 2008 rains caused
serious flooding, not because they were particularly heavy,
but because of the failure of poorly maintained dams and
river banks. A breach in the Kosi river embankment in
August 2008 led to one of the worst floods in the history
of Bihar, the poorest state in India.”
4](https://image.slidesharecdn.com/englishswop09-100206210849-phpapp01/75/State-of-World-Population-2009-47-2048.jpg)


![more than climate change in determining future water
availability. Moreover, they noted, slowing popula-
tion growth can directly contribute to adaptation. “In
Southern Africa,” the researchers noted, “demographic
stagnation [i.e. slow or no population growth], is likely to
mitigate significantly the impact of climate change.”11
Such conclusions do not suggest any nullifica-
tion of developed countries’ obligations under the
United Nations Framework Convention on Climate
Change. These obligations include reducing their own
greenhouse-gas emissions and providing needed financ-
ing and technology transfer to developing countries
that are additional to existing development assistance.
Similarly, any demographic contributions to social resil-
ience do not suggest any departure from the rights-based
approach to population on which the world’s nations
agreed at the International Conference on Population
and Development (ICPD). What they do suggest is the
need for a more holistic view, which includes access to
reproductive health and gender equality, not only for the
long-term reduction of greenhouse-gas emissions but also
for the capacity of all nations to adapt to climate change.
Even experts sometimes fail to distinguish between the
effects of climate change, global in its origins, and envi-
ronmental degradation, which may be more the product
of local human demand, arising from economic develop-
ment and population growth.
At the level of communities and the people who live
in them, however, the distinction is frequently understood
and expressed. Rural women—closer than men to natu-
ral resources in direct proportion to their poverty—are
often well aware that the actions of their own community
or even their own actions can cause local environmental
degradation.12
In Dakar in 2008, women participating in
a workshop on climate change and gender from Senegal
and Ghana remarked on visible environmental damage
stemming from overfishing, illegal net use and, in one
case, the collection of seashells by women for microfi-
nance livelihood projects. The participants assessed these
points positively, as opportunities for self-education and
building awareness of the environmental implications
of everyday behaviour.13
Gender equality and access to
reproductive health are central to building and sustain-
ing societies’ resilience to the stresses of a warming world.
Standing shoulder-to-shoulder with men in all spheres of
life and having freedom and power to make reproductive
A Bangladeshi woman plants gourds on the roof of her home. The rooftop garden provides food during floods, when waters destroy field crops.
© GMB Akash/Panos Pictures
t
44 CHAPTER 4: Building resilience](https://image.slidesharecdn.com/englishswop09-100206210849-phpapp01/75/State-of-World-Population-2009-52-2048.jpg)


![Gujarat state alone. Its bank boasts 350,000 deposi-
tors, and the repayment rate for its loans has been as
high as 97 per cent. “We don’t have a liquidity prob-
lem,” bank manager Jayshree Vyas told a reporter.
“Women save.”4
Many gender discrepancies cross cultures, but at least
those related to energy and technology management
grow less acute as incomes rise with development, and
as women become mass consumers and, often, business
managers.5
As they make this transition, women bring
with them perspectives that come in large part from their
roles as child-bearers and primary care-givers of new gen-
erations. Although gender differences are hotly debated,
in recent years there has been intriguing evidence about
the practical benefit of involving women much more
fully in enterprises at all levels. The question isn’t whether
women or men are more resourceful, only whether they
bring different perspectives, contributions, and qualities
to the table.
“First we thought it would waste our time, because
women wouldn’t know how to run a village,” said a Tanzanian
village councilman, asked in 2002 about recent legal changes
that brought women into his council. “But we were surprised.
The women on the council see things in different ways and
come up with ideas none of the rest of us would have thought
of. We wouldn’t want to lose them now.”6
“When we started [planting trees]
we were not thinking about climate
change,” Nobel Peace Prize laureate and
Green Belt Movement founder Wangari
Maathai says, “but it now happens that
this work is also extremely important as
a way of dealing with the issue.”
In the mid-1970s, Maathai part-
nered with rural women (and some
men) around Kenya to rejuvenate the
environment by planting trees—more
than 40 million to date (the Green Belt
Movement has also supported commu-
nity-based tree-planting efforts in other
African countries as well as Haiti.) As
landscapes are transformed, so are lives
and minds.
Today, the Green Belt Movement is
exploring partnerships with the World
Bank to plant trees as a way of mitigating
the greenhouse-gas emissions fueling
climate change. “We want to learn the
ropes,” Maathai says. “Carbon credits
and carbon trading present a new oppor-
tunity for the Green Belt Movement
to do what it’s always done, but now
in partnership with organizations and
Governments that are now addressing
this issue of climate change.”
Maathai’s biggest concern related to
global warming is that poor regions and
communities won’t be able to adapt fast
enough, in part because they don’t have
the capital to afford greener, more effi-
cient technologies. What, she asks, “will
Governments in Africa or elsewhere do
if, for example, the seas rise and people
move from coastal areas to the hinter-
lands in large masses? What will happen
in Africa if the desertification process
is so enhanced that a huge number of
people will have to move to areas where
there are greener pastures?”
Why haven’t more women been
involved to date in global warming
negotiations and policy development?
Climate change is a “science-based
subject,” Maathai answers, and con-
tinuing gender inequities in women’s
access to education are the main rea-
son. If women “are not getting adequate
education, are not well represented in
the sciences, not well represented in
decision-making, that will be reflected
at the negotiating table,” she says.
In developing and implementing cli-
mate policy, Maathai sees gender as
essential. “Quite obviously, when we
talk about reducing emissions from
deforestation and degradation, we
need to focus on women and we need
to focus on communities, particularly
communities that live near forests,” she
says, ensuring that they understand
the impacts of climate change and
the effects it will have on their liveli-
hoods. Such inclusion is also integral,
in Maathai’s view, to changing behav-
iours at the grass roots that can build
resilience to global warming, such as
reducing forest clearing or degradation,
and improving agricultural practices.
“That’s one level,” Maathai says. “The
other is the decision-making level that
must allocate resources that will ensure
that these women and these communi-
ties are educated, engaged and guided
so they do the right things.”
26 Wangari Maathai: women hold the keys to climate’s future
© Mainichi Corporation
54 CHAPTER 5: Mobilizing for change](https://image.slidesharecdn.com/englishswop09-100206210849-phpapp01/75/State-of-World-Population-2009-62-2048.jpg)


![woman would have during her reproductive years if she bore
children at the rate estimated for different age groups in the
specified time period. Countries may reach the projected level
at different points within the period.
Births with skilled attendants. Source: WHO Database
on proportion of birth by a skilled worker. Department of
Reproductive Health and Research. Geneva: WHO. 2009. This
indicator is based on national reports of the proportion of
births attended by “skilled health personnel or skilled attend-
ant: doctors (specialist or non-specialist) and/or persons with
midwifery skills who can diagnose and manage obstetrical
complications as well as normal deliveries.” Data for more
developed countries reflect their higher levels of skilled deliv-
ery attendance. Because of assumptions of full coverage,
data (and coverage) deficits of marginalized populations and
the impacts of chance and transport delays may not be fully
reflected in official statistics. Data estimates are the most
recent available for 2007.
Gross national income per capita. Source: Most recent (2007)
figures from: The World Bank. World Development Indicators
Online. Web site: http://devdata.worldbank.org/dataonline/
(by subscription). This indicator (formerly referred to as gross
national product [GNP] per capita) measures the total output
of goods and services for final use produced by residents and
non-residents, regardless of allocation to domestic and for-
eign claims, in relation to the size of the population. As such,
it is an indicator of the economic productivity of a nation. It
differs from gross domestic product (GDP) by further adjust-
ing for income received from abroad for labour and capital by
residents, for similar payments to non-residents, and by incor-
porating various technical adjustments including those related
to exchange rate changes over time. This measure also takes
into account the differing purchasing power of currencies by
including purchasing power parity (PPP) adjustments of “real
GNP.” Some PPP figures are based on regression models; oth-
ers are extrapolated from the latest International Comparison
Programme benchmark estimates.
Central government expenditures on education and health.
Source: The World Bank. World Development Indicators 2009
and World Development Indicators Online respectively. Web
site: http://devdata.worldbank.org/dataonline/ (by subscrip-
tion). These indicators reflect the priority afforded to educa-
tion and health sectors by a country through the government
expenditures dedicated to them. They are not sensitive to dif-
ferences in allocations within sectors, e.g., primary education
or health services in relation to other levels, which vary con-
siderably. Direct comparability is complicated by the different
administrative and budgetary responsibilities allocated to cen-
tral governments in relation to local governments, and to the
varying roles of the private and public sectors. Reported esti-
mates are presented as shares of GDP per capita (for educa-
tion) or total GDP (for health). Great caution is also advised
about cross-country comparisons because of varying costs of
inputs in different settings and sectors. Provisional data are
for the most recent year estimates available for 2007 for edu-
cation and 2006 for health.
External assistance for population. Source: UNFPA. 2009.
Financial Resource Flows for Population Activities in 2007. New
York: UNFPA. These data provide the amount of external
assistance expended in 2007 for population activities in
each country. External funds are disbursed through multilateral
and bilateral assistance agencies and by non-governmental
organizations. Donor countries are indicated by their contri-
butions being placed in parentheses. Regional totals include
both country-level projects and regional activities (not other-
wise reported in the table).
Under-5 mortality male/female. Source: United Nations
Population Division. This indicator relates to the incidence of
mortality to infants and young children. It reflects, therefore,
the impact of diseases and other causes of death on infants,
toddlers and young children. More standard demographic
measures are infant mortality and mortality rates for 1 to 4
years of age, which reflect differing causes of and frequency
of mortality in these ages. The measure is more sensitive than
infant mortality to the burden of childhood diseases, including
those preventable by improved nutrition and by immunization
programmes. Under-5 mortality is here expressed as deaths
to children under the age of 5 per 1,000 live births in a given
year. Estimates are for the 2005-2010 period.
Per capita energy consumption. Source: The World Bank.
World Development Indicators Online. Web site: http://devdata.
worldbank.org/dataonline/ (by subscription). This indicator
reflects annual consumption of commercial primary energy
(coal, lignite, petroleum, natural gas and hydro, nuclear and
geothermal electricity) in kilograms of oil equivalent per capi-
ta. It reflects the level of industrial development, the structure
of the economy and patterns of consumption. Changes over
time can reflect changes in the level and balance of various
economic activities and changes in the efficiency of energy
use (including decreases or increases in wasteful consump-
tion). Data estimates are for 2006.
Access to improved drinking water sources. Source:
WHO. 2009. Web site: http://www.who.int/whosis/
indicators/compendium/2008/2wst/(by subscription).
Meeting the MDG Drinking Water and Sanitation Target:
The Urban and Rural Challenge of the Decade. Geneva: World
Health Organization. This indicator reports the percentage
of the population with access to an improved source of drink-
ing water providing an adequate amount of safe water located
within a convenient distance from the user’s dwelling. The
italicized words use country-level definitions. The indicator is
related to exposure to health risks, including those resulting
from improper sanitation. Data are estimates for the
year 2006.
94 TECHNICAL NOTES](https://image.slidesharecdn.com/englishswop09-100206210849-phpapp01/75/State-of-World-Population-2009-102-2048.jpg)


The State of World Population 2009 report by UNFPA addresses the interplay between women, population dynamics, and climate change, emphasizing that women, particularly in developing nations, are disproportionately impacted by climate-related challenges. It argues that population growth and consumption patterns contribute significantly to climate change, while advocating for policies that empower women and ensure their active participation in addressing climate issues. The report underscores the need for gender-sensitive strategies to foster resilience and mobilize action against climate change, particularly as the Copenhagen climate conference approaches.