Download as ODP, PPTX
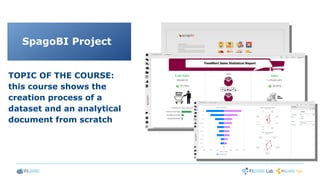
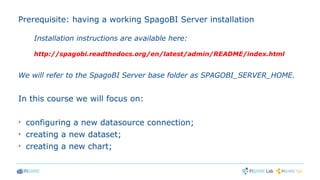
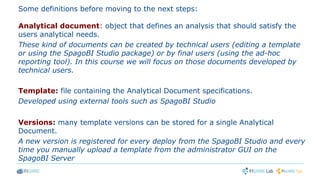
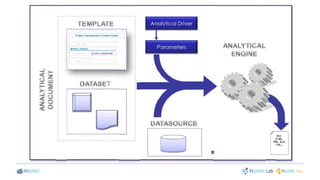
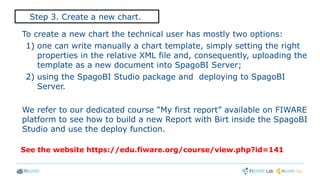
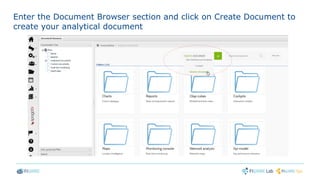
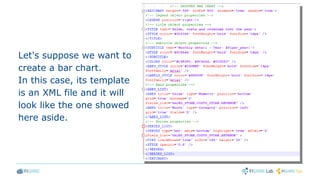

This document outlines a course on creating datasets and analytical documents using SpagoBI, emphasizing the configuration of data sources, dataset creation, and chart development. Key steps include setting up a JNDI data source, defining various types of datasets, and leveraging templates for analytical documents. The course targets technical users and provides guidance on using SpagoBI Studio for document creation and deployment.


![[SFScon'17] More than a decade with free open source software](https://cdn.slidesharecdn.com/ss_thumbnails/sfsconfinalruffatti-171115143706-thumbnail.jpg?width=640&height=640&fit=bounds)


