Download to read offline
![Handbook of Star Forming Regions Vol. I
Astronomical Society of the Pacific, 2008
Bo Reipurth, ed.
Star Forming Regions in Cepheus
M´ ria Kun
a
Konkoly Observatory, H-1525 Budapest, P.O. Box 67, Hungary
arXiv:0809.4761v1 [astro-ph] 27 Sep 2008
Zolt´ n T. Kiss
a
Baja Astronomical Observatory, P.O. Box 766, H-6500 Baja, Hungary
Zolt´ n Balog1
a
Steward Observatory, University of Arizona, 933 N. Cherry Av., Tucson AZ
85721, USA
Abstract. The northern Milky Way in the constellation of Cepheus (100◦ ≤ l ≤
120◦ ; 0◦ ≤ b ≤ 20◦ ) contains several star forming regions. The molecular clouds of
the Cepheus Flare region at b > 10◦ , are sites of low and intermediate mass star for-
mation located between 200 and 450 pc from the Sun. Three nearby OB associations,
Cep OB2, Cep OB3, Cep OB4, located at 600–800 pc, are each involved in forming
stars, like the well known high mass star forming region S 140 at 900 pc. The reflection
nebula NGC 7129 around 1 kpc harbors young, compact clusters of low and intermedi-
ate mass stars. The giant star forming complex NGC 7538 and the young open cluster
NGC 7380, associated with the Perseus arm, are located at d > 2 kpc.
1. Overview
In this chapter we describe the star forming regions of the constellation of Cepheus.
A large scale map of the constellation, with the boundaries defined by IAU overlaid,
and the most prominent star forming regions indicated, is shown in Fig. 1. This huge
area of the sky, stretching between the Galactic latitudes of about 0◦ and +30◦ , contains
several giant star forming molecular cloud complexes located at various distances from
the Sun. According to their distance they can be ranged into three large groups:
(1) Clouds nearer than 500 pc located mainly at b ≥ 10◦ , in the Cepheus Flare.
(2) Three OB associations, Cep OB 2, Cep OB 3 and Cep OB 4 between 600–900 pc.
(3) Star forming regions associated with the Perseus spiral arm at 2–3 kpc.
In the following we discuss the first two of these groups.
Fig. 2 shows the distribution of dark clouds perpendicular to the Galactic plane
(Dobashi et al. 2005), with the outlines of the major star forming complexes overplot-
ted.
The large-scale 13 CO observations performed by Yonekura et al. (1997) led to a
refinement of division of the clouds into complexes. The groups listed in Table 2,
1
on leave from Dept. of Optics and Quantum Electronics, University of Szeged, D´ m t´ r 9, Szeged,
o e
H-6720, Hungary
1](https://image.slidesharecdn.com/starformingcepheus-111031001135-phpapp02/85/Star-forming-cepheus-1-320.jpg)

![3
note that the LDN coordinates, derived from visual examination of the POSS plates,
may be uncertain in several cases.
Figure 3 shows the distribution of the pre-main sequence stars and candidates over
the whole Cepheus region.
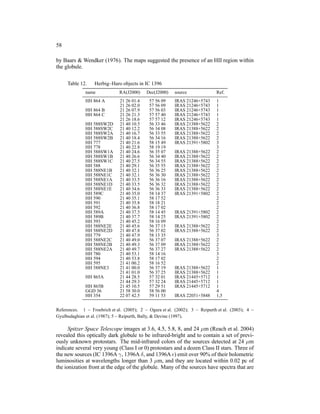
Figure 2. Distribution of the visual extinction in the Cepheus region in the [l,b]
plane (Dobashi et al. 2005) with outlines of the major star forming regions, discussed
in this chapter, overplotted. Solid rectangles indicate the nominal boundaries of the
OB associations (Humphreys 1978; de Zeeuw et al. 1999), and the dashed rectan-
gle shows the Cepheus Flare cloud complex; giant HII regions are marked by solid
grey circles, and star symbols indicate young open clusters. Three large circles,
drawn by radial dashes, show giant shell-like structures in the interstellar medium.
The Cepheus Flare Shell (Olano et al. 2006) belongs to the nearby Cepheus Flare
complex, and the Cepheus Bubble (Kun et al. 1987) is associated with the associ-
ation Cep OB2, and the Cepheus OB4 Shell (Olano et al. 2006) is associated with
Cep OB4.](https://image.slidesharecdn.com/starformingcepheus-111031001135-phpapp02/85/Star-forming-cepheus-3-320.jpg)

![Table 1.: List of clouds catalogued in Cepheus.
Cloud name RA(2000) Dec(2000) l b Area vLSR nstar Alternative names
(h m) (◦ ′ ) (◦ ) (◦ ) (sq.deg.) (km s−1 )
LDN 1122 20 32.7 +65 20.3 99.97 +14.81 0.041 4.8 0 YMD CO 1, TGU 597
LDN 1089 20 32.8 +63 30.3 98.40 +13.78 0.244 −2.4 0 TDS 366, TGU 586
LDN 1094 20 32.8 +64 00.3 98.83 +14.06 0.002 0.1 1 CB 222
TGU 667 20 33.9 +73 51.6 107.53 +19.33 2.460 1 [KTK2006] G107.1+19.3, [KTK2006]
G107.5+19.8, [KTK2006] G107.9+18.9
LDN 1152 20 34.4 +68 00.4 102.37 +16.14 0.025 2.9 0 YMD CO 8
CB 223 20 34.7 +64 10.7 99.10 +13.98 0.003 −2.7 0
LDN 1100 20 34.8 +64 00.4 98.96 +13.88 0.007 −2.7 1 CB 224
LDN 1033 20 37.2 +57 10.5 93.44 +9.69 0.714 −2.4 0 TDS 343, TDS 345, TDS 346,
TGU 549, DBY 093.1+09.6,
DBY 093.5+09.4
LDN 1036 20 38.2 +57 10.6 93.52 +9.58 0.088 −2.1 1 DBY 093.5+09.4
LDN 1041 20 38.2 +57 30.6 93.79 +9.78 0.022 −2.1 0 DBY 093.5+09.4
LDN 1157 20 39.5 +68 00.7 102.65 +15.75 0.005 2.9 1 [DE95] LDN 1157 A1, YMD CO 8, TGU 619
LDN 1147 20 40.5 +67 20.8 102.14 +15.29 0.127 2.9 0 YMD CO 8, TDS 379, TGU 619,
JWT Core 36, [LM99] 340,
[BM89] 1-99, [LM99] 344
LDN 1148 20 40.5 +67 20.8 102.14 +15.29 0.015 2.9 1 YMD CO 8, TGU 619
LDN 1044 20 41.2 +57 20.8 93.90 +9.35 0.006 −2.1 0 DBY 093.5+09.4
LDN 1049 20 42.2 +57 30.8 94.12 +9.35 0.005 0.6 0 DBY 094.1+09.4
LDN 1039 20 42.3 +56 50.8 93.58 +8.94 0.079 −2.1 0 DBY 093.5+09.4
LDN 1051 20 42.7 +57 30.9 94.16 +9.29 0.010 0.6 0 DBY 094.1+09.4
LDN 1155 20 43.5 +67 40.9 102.60 +15.25 0.006 2.9 0 YMD CO 8, TGU 619
LDN 1158 20 44.5 +67 41.0 102.66 +15.17 0.111 0.9 0 TDS 388, [BM89] 1-100, [LM99] 346, TGU 619
[BM89] 1-102, [BM89] 1-103, [LM99] 348
LDN 1038 20 46.3 +56 21.0 93.53 +8.20 0.660 −2.1 0 [BM89] 1-104, DBY 093.5+09.4
LDN 1076 20 49.3 +59 51.2 96.57 +10.04 0.008 −2.2 0 DBY 096.8+10.2
LDN 1082 20 51.1 +60 11.3 96.98 +10.07 0.111 −2.6 8 Barnard 150, GF 9, TDS 362, [LM99] 350,
DBY 097.1+10.1, [BM89] 1-105, [LM99] 351
LDN 1171 20 53.5 +68 19.5 103.71 +14.88 0.002 3.4 0 CB 229
LDN 1037 20 54.4 +55 26.5 93.53 +6.75 0.591 0 TGU 551
LDN 1168 20 56.6 +67 36.6 103.31 +14.21 0.003 0
5](https://image.slidesharecdn.com/starformingcepheus-111031001135-phpapp02/85/Star-forming-cepheus-5-320.jpg)
![6
Table 1.: Continued.
Cloud name RA(2000) Dec(2000) l b Area vLSR nstar Alternative names
(h m) (◦ ′ ) (◦ ) (◦ ) (sq.deg.) (km s−1 )
LDN 1061 20 58.3 +57 21.7 95.36 +7.56 0.618 −2.1 0 DBY 095.2+07.4, DBY 095.2+07.4
LDN 1071 20 58.3 +58 11.7 96.00 +8.10 0.092 −0.4 0 Barnard 354, DBY 096.0+08.1, TGU 569
LDN 1056 20 58.4 +56 01.7 94.35 +6.69 0.036 0
TGU 730 20 58.8 +78 11.8 112.23 +20.50 0.803 −8.0 3 [BM89] 1-108, [BM89] 1-109,
[B77] 48, [BM89] 1-112, GN 21.00.4, RNO 129
LDN 1228 20 59.0 +77 31.8 111.67 +20.10 0.086 −7.6 4 YMD CO 66, MBM 162, TGU 718
LDN 1170 21 01.7 +67 36.9 103.63 +13.84 0.215 2.8 0 TDS 392, TGU 629, GSH 093+07+9
[LM99] 359, [LM99] 361
LDN 1058 21 02.4 +56 01.9 94.72 +6.27 0.869 −1.1 1 TDS 354, TGU 558
LDN 1174 21 02.6 +68 11.9 104.15 +14.14 0.294 2.8 > 15
∼ TDS 393, [LM99] 358, [BM89]1-110,
[B77] 39, [BM89] 1-113, [LM99] 360,
[BM89] 1-114, [BM89] 3B- 9,
[BM89] 1-111, PP 100, [BM89] 1-115
Ced 187, GN 21.01.0, YMD CO 14
LDN 1172 21 02.7 +67 41.9 103.76 +13.82 0.010 2.7 >4
∼ YMD CO 14, TGU 629
LDN 1167 21 03.7 +67 02.0 103.30 +13.32 0.062 2.8 0 YMD CO 11
LDN 1173 21 04.7 +67 42.0 103.88 +13.67 0.006 2.7 0 YMD CO 14
LDN 1068 21 06.3 +57 07.1 95.89 +6.59 0.027 0.2 0 Barnard 359, DBY 095.9+06.6, TGU 570
LDN 1063 21 07.4 +56 22.2 95.44 +5.97 0.025 0.3 0 Barnard 151, Barnard 360,
DBY 095.5+06.5, TGU 561
LDN 1065 21 07.4 +56 32.2 95.56 +6.09 0.023 0.3 0 DBY 095.5+06.5, TGU 568
LDN 1069 21 08.4 +56 52.2 95.90 +6.21 0.018 0.3 0 DBY 095.5+06.5
LDN 1067 21 09.4 +56 42.3 95.87 +6.00 0.012 0.3 0 DBY 095.5+06.5, TGU 568
Sh 2-129 21 11.3 +59 42.3 98.26 +7.84 1.190 3.7 2 DBY 097.3+08.5, BFS 9
LDN 1060 21 11.5 +55 17.4 95.02 +4.82 0.031 −0.9 0 DBY 090.5+02.4
LDN 1119 21 13.2 +61 42.4 99.91 +9.03 0.010 2.5 0 DBY 100.1+09.3, TGU 598
LDN 1062 21 13.5 +55 32.4 95.40 +4.79 0.003 −0.9 0 DBY 090.5+02.4
LDN 1064 21 13.5 +55 37.4 95.46 +4.85 0.001 −0.9 0 DBY 090.5+02.4
LDN 1125 21 14.7 +61 42.5 100.04 +8.90 0.010 2.5 1 Barnard 152, TDS 376, [LM99] 365,
DBY 100.1+09.3, TGU 598
LDN 1072 21 16.5 +56 12.6 96.18 +4.95 1.510 −0.6 0 Barnard 153, TDS 358, TGU 574,
DBY 096.3+05.2
LDN 1177 21 18.8 +68 15.7 105.22 +13.06 0.005 2.9 2 CB 230, TGU 641](https://image.slidesharecdn.com/starformingcepheus-111031001135-phpapp02/85/Star-forming-cepheus-6-320.jpg)
![Table 1.: Continued.
Cloud name RA(2000) Dec(2000) l b Area vLSR nstar Alternative names
(h m) (◦ ′ ) (◦ ) (◦ ) (sq.deg.) (km s−1 )
TGU 589 21 19.7 +59 27.7 98.83 +6.90 0.560 2
LDN 1162 21 20.0 +65 02.8 102.92 +10.76 0.004 0
LDN 1080 21 21.5 +56 32.8 96.91 +4.69 0.001 0 Barnard 154
YMD CO 23 21 22.2 +69 22.6 106.27 +13.60 0.056 −9.4 2 TGU 656
LDN 1108 21 26.4 +59 33.1 99.49 +6.37 0.046 0
DBY 098.4+05.2 21 26.8 +57 55.9 98.40 +5.17 0.107 1.0 0
LDN 1086 21 28.5 +57 33.2 98.30 +4.74 0.095 −4.6 18 DBY 098.8+04.2, TGU 584, [PGS95] 2,
IC 1396 W, FSE 1
LDN 1176 21 31.0 +66 43.3 104.93 +11.15 0.446 −10.4 0 YMD CO 17, TGU 634,
JWT Core 44, GAL 104.9+11.2
LDN 1145 21 31.3 +62 43.3 102.14 +8.24 0.183 0 TGU 622, [PGH98b] Cloud 11
LDN 1146 21 31.3 +62 43.3 102.14 +8.24 0.183 0
LDN 1096 21 31.5 +58 03.3 98.93 +4.83 0.001 0 TGU 590
LDN 1102 21 32.5 +58 03.3 99.03 +4.74 0.008 0
LDN 1085 21 33.3 +56 44.6 98.23 +3.69 0.010 3.4 0 WWC 156
LDN 1093 21 33.5 +57 38.4 98.85 +4.34 0.034 −4.6 20 DBY 098.8+04.2, TGU 587, FSE 3
[PGS95] 8
LDN 1083 21 33.6 +55 58.0 97.72 +3.11 0.761 8.7 WCC 178–179
LDN 1098 21 34.5 +57 38.0 98.95 +4.25 0.025 −4.6 20 DBY 098.8+04.2, FSE 3
Barnard 365 21 34.9 +56 43.0 98.36 +3.53 0.010 7.6 WWC 140
TGU 639 21 35.5 +66 32.0 105.13 +10.70 0.280 1 [KTK2006] G105.0+10.7
LDN 1087 21 35.6 +56 33.5 98.32 +3.35 0.013 7.4 2 TDS 364
LDN 1090 21 35.6 +56 43.5 98.43 +3.48 0.028 0 Barnard 365
LDN 1199 21 35.9 +68 33.5 106.57 +12.15 0.235 −11.5 1 TDS 398, TGU 653
[KTK2006] G106.4+12.0,
[KTK2006] G106.7+12.3
LDN 1099 21 36.5 +57 23.5 98.98 +3.88 0.008 −8.0 22 DBY 099.1+04.0, FSE 5
LDN 1116 21 36.5 +58 33.5 99.76 +4.75 0.034 3 [IS94] 7, [PGS95] 16, [IS94] 14, SFO 35,
[G85] 5, [PGS95] 17, [PGS95] 19, FSE 6
LDN 1105 21 37.1 +57 33.5 99.15 +3.95 0.008 −8.0 22 TDS 369, [B77] 37, DBY 099.1+04.0, FSE 5
YMD CO 19 21 37.3 +67 01.2 105.60 +10.93 0.279 −10.2 1 TGU 642, [KTK2006] G105.5+10.8,
[KTK2006] G105.7+10.8
LDN 1092 21 37.6 +56 58.5 98.81 +3.48 0.014 1
7](https://image.slidesharecdn.com/starformingcepheus-111031001135-phpapp02/85/Star-forming-cepheus-7-320.jpg)
![8
Table 1.: Continued.
Cloud name RA(2000) Dec(2000) l b Area vLSR nstar Alternative names
(h m) (◦ ′ ) (◦ ) (◦ ) (sq.deg.) (km s−1 )
LDN 1112 21 38.5 +58 03.6 99.63 +4.20 0.013 −0.3 0 DBY 099.7+04.1
LDN 1117 21 38.5 +58 18.6 99.79 +4.39 0.004 −0.7 0 WWC 114–116
LDN 1088 21 38.6 +56 13.6 98.41 +2.83 0.019 7.2 2 Barnard 160, TGU 585,
DBY 098.4+02.9
LDN 1135 21 39.4 +60 38.6 101.44 +6.06 0.054 0
LDN 1110 21 39.5 +57 53.6 99.62 +3.99 0.007 −0.3 2 DBY 099.7+04.1
LDN 1111 21 39.5 +57 53.6 99.62 +3.99 0.002 −0.3 2 Barnard 161, DBY 099.7+04.1, CB 233
LDN 1123 21 39.5 +58 28.6 100.00 +4.43 0.003 0
LDN 1126 21 39.5 +58 33.6 100.06 +4.49 0.006 0
LDN 1101 21 39.6 +56 58.6 99.01 +3.30 0.095 0
LDN 1131 21 40.0 +59 33.7 100.77 +5.20 0.046 −0.4 0 Barnard 366, TDS 378,
DBY 100.9+05.3, TGU 609
LDN 1140 21 40.4 +60 53.7 101.70 +6.16 0.240 0
LDN 1121 21 40.5 +58 16.7 99.97 +4.19 0.008 −0.2 > 25
∼ DBY 100.0+04.2, [IS94] 5, [G85] 14,
[LM99] 379, [IS94] 17, IC 1396 N,
SFO 38, [PGS95] 24, FSE 19, TGU 599
CB 234 21 40.5 +70 18.6 108.09 +13.15 0.044 −5.0 0
LDN 1127 21 40.9 +58 33.7 100.20 +4.37 0.004 0 TGU 599
TDS 395 21 40.9 +66 35.7 105.57 +10.38 0.161 −10.8 1 [KTK2006] G105.5+10.3, YMD CO 18
LDN 1124 21 41.5 +58 13.7 100.04 +4.07 0.015 −0.2 20 DBY 100.0+4.2, IC 1396 N
LDN 1128 21 41.5 +58 33.7 100.26 +4.32 0.015 1.2 0 TGU 599, WWC 117
LDN 1134 21 41.5 +60 13.7 101.35 +5.58 2.630 −0.4 0 [PGH98b] Cloud 19, DBY 100.9+05.3,
[PGH98b] Cloud 21,
DBY 101.7+05.0
LDN 1103 21 41.7 +56 43.7 99.07 +2.92 0.003 0
LDN 1104 21 42.1 +56 43.7 99.11 +2.89 0.006 4.1 2 Barnard 163, TDS 371, WWC 184,
[G85] 17, [LM99] 381
LDN 1181 21 42.1 +66 08.7 105.36 +9.97 0.008 −9.9 0 YMD CO 18, TGU 645
LDN 1183 21 42.1 +66 13.7 105.42 +10.03 0.090 −9.9 >84 Ced 196, GM 1-57, [B77] 40, TDS 395,
[FMS2001] NGC 7129,
[MPR2003] HI Ring, [MPR2003] HI Knot,
BFS 11, JWT Core 46
LDN 1095 21 42.6 +56 18.8 98.89 +2.52 0.012 0](https://image.slidesharecdn.com/starformingcepheus-111031001135-phpapp02/85/Star-forming-cepheus-8-320.jpg)
![Table 1.: Continued.
Cloud name RA(2000) Dec(2000) l b Area vLSR nstar Alternative names
(h m) (◦ ′ ) (◦ ) (◦ ) (sq.deg.) (km s−1 )
LDN 1106 21 42.6 +56 53.8 99.27 +2.97 0.009 −0.4 0 [PGS95] 28
LDN 1113 21 44.6 +57 11.8 99.67 +3.02 0.002 4.5 1 Barnard 367, WWC 186
LDN 1130 21 44.6 +58 18.8 100.40 +3.87 0.012 −3.0 8 TGU 604, [PGS95] 32, FSE 8
LDN 1136 21 45.5 +59 58.9 101.57 +5.06 0.012 −2.9 0 DBY 101.7+05.0
DBY 100.0+03.0 21 46.3 +57 25.1 100.00 +3.03 0.015 −1.9 16 IC 1396 E,SFO 39, FSE 9
LDN 1115 21 46.6 +56 58.9 99.74 +2.68 0.002 0
LDN 1118 21 46.6 +57 12.9 99.89 +2.86 0.001 −2.1 0 SFO 42, [PGS95] 38
LDN 1129 21 46.6 +57 53.9 100.33 +3.38 0.041 −2.1 0 [PGS95] 36, DBY 100.4+03.4, WWC 40–42
LDN 1132 21 46.6 +58 43.9 100.87 +4.02 0.003 0
LDN 1120 21 47.6 +57 09.0 99.96 +2.72 0.001 0
LDN 1114 21 49.7 +56 24.0 99.69 +1.96 0.016 −1.8 0 TDS 375, DBY 099.9+01.8
LDN 1241 21 50.0 +76 44.1 113.08 +17.48 1.380 −3.7 0 YMD CO 72, YMD CO 75,
TGU 728, TGU 739
LDN 1144 21 50.5 +60 07.1 102.14 +4.77 0.027 −2.2 1 Barnard 166, DBY 102.1+04.8
LDN 1137 21 51.6 +59 04.1 101.58 +3.87 0.018 −10.5 0 [G85] 31, DBY 101.5+03.8
LDN 1138 21 51.6 +59 04.1 101.58 +3.87 0.018 −10.5 0 DBY 101.5+03.8
LDN 1109 21 51.7 +55 49.1 99.55 +1.33 0.150 −1.5 0 DBY 099.5+01.2
Barnard 167 21 52.0 +60 04.0 102.25 +4.61 0.005 1
LDN 1139 21 55.6 +58 34.3 101.68 +3.15 0.015 0.1 15 Barnard 169, DBY 101.3+03.00, TGU 620,
[LM99] 386, [PGH98b] Cloud 27, FSE 10
LDN 1141 21 55.6 +58 44.3 101.78 +3.28 0.010 0.1 0 Barnard 171, DBY 101.3+03.00,
LDN 1142 21 56.6 +59 04.3 102.09 +3.47 0.002 0.1 0 CB 235, DBY 101.3+03.00
LDN 1143 21 57.6 +58 59.3 102.14 +3.32 0.020 0.1 1 Barnard 170, TDS 380, DBY 101.3+03.00
LDN 1149 21 57.6 +59 07.3 102.22 +3.43 0.015 0.1 0 DBY 101.3+03.00
LDN 1151 21 59.6 +59 04.4 102.40 +3.23 0.027 0.1 0 DBY 101.3+03.00
LDN 1153 22 00.6 +58 59.5 102.45 +3.09 0.079 0.1 0 TDS 383, DBY 101.3+03.00
LDN 1133 22 02.7 +56 14.5 101.02 +0.72 0.248 0
LDN 1160 22 04.7 +58 59.6 102.87 +2.78 0.019 0.1 0 DBY 101.3+03.00
LDN 1166 22 05.7 +59 34.6 103.32 +3.18 0.001 −3.0 0 CB 236
LDN 1159 22 06.7 +58 34.7 102.84 +2.29 2.790 −1.0 17 Barnard 174, TDS 384, TDS 391, [LM99] 389,
[GA90] 3-36, DSH J2206.2+5819,
DBY 102.9+02.4, [G85] 32,
DBY 102.8+02.1, DBY 103.3+02.8,
9](https://image.slidesharecdn.com/starformingcepheus-111031001135-phpapp02/85/Star-forming-cepheus-9-320.jpg)
![10
Table 1.: Continued.
Cloud name RA(2000) Dec(2000) l b Area vLSR nstar Alternative names
(h m) (◦ ′ ) (◦ ) (◦ ) (sq.deg.) (km s−1 )
DBY 103.2+01.8, [PGH98b] Cloud 30,
DBY 103.5+02.0, GSH 103+02-66
LDN 1164 22 06.7 +59 09.7 103.18 +2.76 0.019 −2.2 36 DBY 103.3+02.8, FSE 11
LDN 1165 22 07.2 +59 04.7 103.18 +2.66 0.019 −2.2 1 DBY 103.3+02.8
LDN 1169 22 07.2 +59 44.7 103.57 +3.20 0.004 −3.2 0 CB 237
TGU 659 22 09.0 +64 29.7 106.53 +6.93 1.070 1 [KTK2006] G106.9+07.1
LDN 1178 22 09.1 +62 19.8 105.27 +5.16 0.005 0
LDN 1243 22 10.6 +75 20.0 113.16 +15.61 0.081 −2.9 0 YMD C0 74
LDN 1219 22 11.6 +70 59.9 110.58 +12.06 0.003 −4.6 1 Barnard 175, TDS 414, YMD CO 57
LDN 1182 22 13.1 +61 54.9 105.42 +4.55 0.004 0
LDN 1217 22 13.1 +70 44.9 110.54 +11.79 0.186 −4.6 1 Ced 201, YMD CO 57, TDS 414, TGU 696
LDN 1186 22 13.6 +62 07.9 105.59 +4.70 0.005 0 TGU 649
LDN 1175 22 13.7 +60 44.9 104.81 +3.55 0.015 0 TGU 635
LDN 1191 22 14.1 +62 24.9 105.80 +4.90 0.004 0
LDN 1193 22 14.6 +62 24.9 105.85 +4.87 0.002 0
LDN 1235 22 14.9 +73 25.0 112.24 +13.88 0.037 −4.0 4 YMD CO 69, TDS 426, HCL 1F,
TGU725, [BM89] 1-117, [LM99] 390
TGU 627 22 15.2 +58 47.6 103.87 +1.83 0.210 3
LDN 1150 22 15.8 +56 00.0 102.37 −0.53 0.007 −6.9 0 Barnard 369, TDS 385, TGU 621
LDN 1188 22 16.7 +61 45.0 105.67 +4.18 0.398 −10.6 > 20
∼ YMD CO 21, TGU 652,
[PGH98b] Cloud 33, [ADM95] 3,
[ADM95] 4, [ADM95] 5, [ADM95] 7,
[ADM95] 13, [ADM95] 8, GN 22.15.0
LDN 1154 22 16.8 +56 13.0 102.61 −0.43 0.007 0
TGU 636 22 16.9 +60 11.6 104.83 +2.87 0.240 2
TGU 640 22 17.6 +60 36.5 105.13 +3.17 0.330 2 DG 181, DG 182, GN 22.14.9
LDN 1156 22 19.9 +55 45.1 102.71 −1.05 0.043 0
LDN 1161 22 19.9 +56 08.1 102.92 −0.73 0.006 0 [KC97c] G102.9-00.7
YMD CO 29 22 20.2 +63 53.1 107.20 +5.73 0.018 −11.0 13 Sh2-145, SFO 44
LDN 1184 22 20.7 +60 45.1 105.53 +3.08 0.124 0 TGU 643, TGU 644
LDN 1247 22 20.8 +75 15.2 113.66 +15.17 0.167 −5.1 0 TDS 430, TGU 742
LDN 1163 22 20.9 +56 10.1 103.05 −0.78 0.007 0
LDN 1201 22 23.6 +63 30.2 107.31 +5.21 0.009 0 TGU 661](https://image.slidesharecdn.com/starformingcepheus-111031001135-phpapp02/85/Star-forming-cepheus-10-320.jpg)
![Table 1.: Continued.
Cloud name RA(2000) Dec(2000) l b Area vLSR nstar Alternative names
(h m) (◦ ′ ) (◦ ) (◦ ) (sq.deg.) (km s−1 )
LDN 1202 22 26.7 +63 05.3 107.38 +4.67 0.004 0 TGU 661
LDN 1204 22 26.7 +63 15.3 107.47 +4.82 2.500 −7.6 > 100
∼ YMD CO 27, TDS 399, TDS 401,
TDS 403, TDS 404, TDS 405, [KC97c],
[PGH98b] Cloud 32, [PGH98b] Cloud 37,
[PGH98b] Cloud 38, [G84b] 12,
DG 185, [PGH98b] Cloud 36, Sh2-140,
GSH 108+05-46, GN 22.21.5, TGU 661
LDN 1180 22 26.8 +59 15.3 105.37 +1.41 7.000 −3.6 19 YMD CO 20, YMD CO 24, TDS 396, TDS 397,
CB 240, TGU 631, TGU 638, TGU 655,
TGU 658, Min 2-72, [PGH98b] Cloud 34,
[KC97c] G104.6+01.4, KR 47,
[LM99] 394, [KC97c] G105.6+00.4,
Sh 2-138, [GSL2002] 109, [GSL2002] 110,
[P85b] 18, [LM99] 396,
DSH J2222.5+5918B, TGU 657,
LDN 1195 22 26.8 +61 15.3 106.42 +3.11 0.017 1 [B77] 42, [LM99] 391, GN 22.24.9
LDN 1196 22 26.8 +61 15.3 106.42 +3.11 0.029 1
LDN 1179 22 27.3 +59 02.3 105.31 +1.19 0.002 0
LDN 1203 22 27.7 +63 00.3 107.43 +4.54 0.016 0 TGU 661
TGU 719 22 27.8 +71 21.4 111.90 +11.63 0.510 3
LDN 1221 22 28.4 +69 00.4 110.67 +9.61 0.020 −4.9 3 TDS 416, [KTK2006] G110.6+09.6,
[LM99] 392, TGU 702
LDN 1206 22 28.7 +64 25.4 108.27 +5.70 0.083 0 TGU 673, [PGH98b] Cloud 35
LDN 1185 22 29.3 +59 05.4 105.56 +1.10 0.006 0
LDN 1207 22 29.7 +64 25.4 108.36 +5.64 0.047 0
LDN 1209 22 29.7 +64 45.4 108.53 +5.93 0.111 −8.8 3 Sh2-150, TGU 680
LDN 1208 22 30.7 +64 25.4 108.46 +5.58 0.018 0
LDN 1190 22 30.9 +59 08.4 105.75 +1.04 0.004 0
LDN 1242 22 31.2 +73 15.4 113.15 +13.11 0.793 0
LDN 1213 22 31.6 +65 25.5 109.06 +6.39 0.006 −9.2 0 YMD CO 48, TGU 686, Sh2-150
LDN 1194 22 32.9 +59 05.5 105.95 +0.87 0.009 0
LDN 1214 22 33.6 +65 45.5 109.41 +6.57 0.256 −8.5 1 TDS 407, YMD CO 48, Sh2-150
11
LDN 1192 22 33.9 +58 35.5 105.81 +0.37 0.007 −3.6 0 CB 240](https://image.slidesharecdn.com/starformingcepheus-111031001135-phpapp02/85/Star-forming-cepheus-11-320.jpg)
![12
Table 1.: Continued.
Cloud name RA(2000) Dec(2000) l b Area vLSR nstar Alternative names
(h m) (◦ ′ ) (◦ ) (◦ ) (sq.deg.) (km s−1 )
TDS 417 22 35.5 +69 13.1 111.33 +9.47 0.014 −7.2 1 YMD CO 65, [B77] 46, GN 22.33.6
[KTK2006] G101.9+15.8
TGU 679 22 35.9 +63 35.2 108.53 +4.57 0.170 1
LDN 1251 22 36.1 +75 15.6 114.51 +14.65 0.195 −3.8 ∼ 20
> YMD CO 79, TGU 750, [SMN94] B,
HCL 1A, [SMN94] C, [SMN94] D,
[LM99] 397, [NJH2003] 5, [TW96] H2,
[SMN94] E, [TW96] H1,
[KTK2006] G114.4+14.6
LDN 1198 22 36.9 +59 25.6 106.57 +0.90 0.054 −11.91 2
TGU 672 22 37.5 +62 20.6 108.07 +3.40 0.360 1
LDN 1197 22 37.9 +58 55.6 106.43 +0.40 0.009 0
LDN 1187 22 38.0 +57 15.6 105.62 −1.06 0.145 0
LDN 1189 22 39.0 +57 15.6 105.74 −1.12 0.473 0
TGU 671 22 44.1 +60 16.1 107.77 +1.20 0.200 2
LDN 1210 22 44.9 +62 05.8 108.70 +2.77 0.011 −10.0 0 YMD CO 40, TGU 699
Sh 2-142 22 45.0 +57 55.8 106.76 −0.92 1.063 −41.0 14 Ced 206, GM 2-42, TGU 663, SFO 43,
[KC97c] G107.2-01.0, [KC97c] G107.3-00.9
LDN 1205 22 45.9 +60 25.8 108.04 +1.24 0.095 0
LDN 1200 22 46.0 +58 45.8 107.27 −0.24 0.020 −3.7 3 YMD CO 28, TDS 402, TGU 665
TGU 678 22 46.5 +61 12.8 108.47 +1.90 0.170 1
LDN 1211 22 46.9 +62 10.8 108.95 +2.74 0.011 −11.1 4 YMD CO 40, TGU 699
LDN 1212 22 47.9 +62 12.9 109.07 +2.71 0.014 −10.0 0 YMD CO 40, TGU 699
TGU 689 22 50.2 +62 51.5 109.60 +3.17 0.160 2
TGU 692 22 50.7 +63 15.4 109.83 +3.50 0.240 2
YMD CO 38 22 51.1 +60 51.6 108.80 +1.33 0.028 −8.5 1 TGU 606, [KTK2006] G100.6+16.2
YMD CO 49 22 51.1 +62 38.9 109.60 +2.93 0.014 −9.6 1 TGU 690
LDN 1215 22 51.9 +62 06.0 109.44 +2.40 0.021 0 TGU 699
LDN 1216 22 51.9 +62 16.0 109.52 +2.55 0.142 −9.5 11 Cep F, TDS 408,
GN 22.51.3, TGU 699
LDN 1236 22 52.7 +68 56.0 112.56 +8.49 0.044 −5.0 0 YMD CO 73, TGU 729
YMD CO 51 22 56.2 +62 02.7 109.87 +2.13 0.489 −10.2 > 15
∼ Cep A
LDN 1223 22 56.9 +64 16.1 110.89 +4.11 1.010 1 TGU 703, [BKP2003] 455
GN 22.58.2, GSH 111+04-105](https://image.slidesharecdn.com/starformingcepheus-111031001135-phpapp02/85/Star-forming-cepheus-12-320.jpg)
![Table 1.: Continued.
Cloud name RA(2000) Dec(2000) l b Area vLSR nstar Alternative names
(h m) (◦ ′ ) (◦ ) (◦ ) (sq.deg.) (km s−1 )
TGU 715 22 57.0 +65 53.5 111.60 +5.57 1.280 0
TGU 684 22 57.4 +59 27.5 108.90 −0.27 0.230 −47.0 6 [KC97c] G109.1-00.3, [G82a] 13
TGU 705 22 59.5 +63 26.0 110.80 +3.23 0.410 2
LDN 1218 23 02.0 +62 16.2 110.58 +2.05 1.590 −5.1 >400 YMD CO 53, YMD CO 51
YMD CO 56, YMD CO 58, YMD CO 59, YMD CO 62,
YMD CO 63, TDS 418, Cep A, Cep A west,
[THR85] Cep A-3, GAL 109.88+02.11,
[HW84] 7d, [B77] 44, [TOH95] Ridge,
[TOH95] C, [TOH95] B, [TOH95] A,
Cep B, GN 22.55.2, [KC97c] G110.2+02.5, Cep E,
Cep E South, Cep E North, [YNF96] a,
[YNF96] b, TGU 699
YMD CO 55 23 02.1 +61 29.2 110.27 +1.33 0.056 −7.3 2
LDN 1224 23 04.0 +63 46.2 111.39 +3.33 0.016 0
LDN 1220 23 04.1 +61 51.2 110.63 +1.57 0.006 −10.1 1 YMD CO 58, Cep E
LDN 1222 23 05.1 +61 46.2 110.70 +1.45 0.002 −10.1 0 YMD CO 58, Cep E, TGU 699
TGU 707 23 09.0 +61 04.8 110.87 +0.63 0.160 1
TGU 700 23 09.7 +60 06.4 110.57 −0.30 0.650 −52.8 10 BFS 18
LDN 1226 23 10.1 +62 16.3 111.44 +1.68 0.009 −10.7 0 YMD CO 63, TGU 699
LDN 1227 23 10.1 +62 19.3 111.46 +1.73 0.008 −10.7 0 YMD CO 63, TGU 699
LDN 1240 23 11.0 +66 26.3 113.12 +5.50 0.126 0
LDN 1225 23 12.1 +61 36.3 111.41 +0.97 0.036 −10.9 4 TDS 419, CB 242, TGU 699
LDN 1239 23 12.3 +66 04.3 113.11 +5.11 0.005 −7.6 0 CB 241
NGC 7538 23 14.1 +61 29.4 111.58 +0.77 0.011 −57.0 ∼2000 [KSH92] CS 5, [KSH92] CS 4, [M73] C,
[KSH92] CS 3, Ced 209, [WAM82] 111.543+0.7,
[M73] B, [M73] A, [KSH92] CS 2, Sh2-158
GAL 111.53+00.82, [WC89] 111.54+0.78, [KSH92] CS 1
LDN 1229 23 14.1 +61 59.4 111.78 +1.24 0.004 −10.0 0 Cep D, TGU 699
LDN 1230 23 14.1 +62 01.4 111.79 +1.27 0.002 −10.0 0 Cep D, TGU 699
LDN 1233 23 16.5 +62 20.4 112.15 +1.47 0.001 −10.0 0 Cep D
LDN 1232 23 17.2 +61 46.4 112.03 +0.91 0.004 −10.6 0 YMD CO 68, TGU 699
LDN 1234 23 17.2 +62 24.4 112.25 +1.51 0.004 0
TGU 717 23 17.3 +60 48.1 111.70 0.00 0.200 −30.1 >9
13
∼](https://image.slidesharecdn.com/starformingcepheus-111031001135-phpapp02/85/Star-forming-cepheus-13-320.jpg)
![14
Table 1.: Continued.
Cloud name RA(2000) Dec(2000) l b Area vLSR nstar Alternative names
(h m) (◦ ′ ) (◦ ) (◦ ) (sq.deg.) (km s−1 )
TGU 757 23 17.3 +69 56.0 114.97 +8.53 0.270 1
LDN 1231 23 18.2 +61 16.4 111.97 +0.40 0.013 −11.2 0 TDS 424
LDN 1250 23 22.1 +67 16.5 114.45 +5.89 2.630 −8.6 1 YMD CO 78, YMD CO 80,
TDS 432, TGU 747
GSH 114+06-47
LDN 1259 23 22.9 +74 16.5 116.93 +12.44 0.035 3.9 0 YMD CO 101, TGU 772
LDN 1244 23 25.2 +62 46.5 113.25 +1.53 0.007 0
LDN 1246 23 25.2 +63 36.5 113.52 +2.32 0.002 −11.1 0 CB 243, [GA90] 3-40, [LM99] 400
LDN 1261 23 27.0 +74 16.5 117.20 +12.35 0.030 3.9 2 YMD CO 101, TDS 447, TGU 772,
TDS 448, CB 244, [LM99] 401
LDN 1262 23 27.0 +74 16.5 117.20 +12.35 0.066 3.9 2 [BM89] 3B-10, [BM89] 1-119, TGU 772
YMD CO 85 23 32.6 +67 02.0 115.33 +5.33 0.084 −5.4 0
YMD CO 86 23 35.8 +66 26.2 115.47 +4.67 0.056 −7.0 0
YMD CO 87 23 39.3 +65 42.4 115.60 +3.87 0.168 −25.3 2
TGU 767 23 42.9 +68 52.9 116.80 +6.83 0.400 2
LDN 1264 23 52.5 +68 16.7 117.50 +6.03 0.102 0
LDN 1266 23 57.5 +67 16.7 117.75 +4.95 2.540 −6.8 14 YMD CO 103, YMD CO 104, YMD CO 105,
YMD CO 108, YMD CO 111, TDS 449, TDS 451,
TGU 774, [LM99] 404, [YF92] C1,
[LM99] 405, [YF92] C2, GN 23.56.1,
[KC97c] G118.1+05.0, [LM99] 406, [GA90] 1-1,
[GA90] 1-1a, [LM99] 1, [KC97c] G118.4+04.7,
DG 1, [GA90] 3-41, [GA90] 3-42,
SFO 1, SFO 3, DSH J2359.6+6741
LDN 1274 23 57.5 +70 56.7 118.52 +8.54 0.032 −2.5 0 YMD CO 109
LDN 1268 23 59.5 +67 26.7 117.97 +5.07 0.158 −6.2 3 Sh2-171, YMD CO 104, TGU 774
LDN 1269 00 00.6 +67 09.7 118.01 +4.78 0.025 0 TGU 774
LDN 1270 00 01.6 +67 09.7 118.11 +4.76 0.009 2 TGU 774
LDN 1271 00 01.6 +67 16.7 118.13 +4.87 0.010 −15.1 0 YMD CO 108, TGU 774
LDN 1272 00 02.6 +67 16.7 118.23 +4.85 8.690 −6.3 23 YMD CO 97, YMD CO 98, YMD CO 110,
YMD CO 112, YMD CO 113, YMD CO 114,
YMD CO 116, TGU 779, SFO 2, [GA90] 3-1,
[GA90] 1-1b, GSH 119+05-74](https://image.slidesharecdn.com/starformingcepheus-111031001135-phpapp02/85/Star-forming-cepheus-14-320.jpg)
![Table 1.: Continued.
Cloud name RA(2000) Dec(2000) l b Area vLSR nstar Alternative names
(h m) (◦ ′ ) (◦ ) (◦ ) (sq.deg.) (km s−1 )
LDN 1273 00 02.6 +68 31.7 118.46 +6.08 0.199 −8.8 4 YMD CO 114
LDN 1275 00 06.6 +67 26.7 118.64 +4.95 0.020 0 TGU 781
´
References: [ADM95] – Abrah´ m et al. (1995); Barnard – Barnard (1927); [B77] – Bernes (1977); [BKP2003] – Brunt et al. (2003);
a
[BM89] – Benson & Myers (1989); BFS – Blitz et al. (1982); CB – Clemens & Barvainis (1988); Ced – Cederblad (1946) DBY –
Dobashi et al. (1994); [DE95] – Davis & Eisl¨ ffel (1995); DG – Dorschner & G¨ rtler (1964); DSH – Kronberger et al. (2006); [ETM94] –
o u
Eiroa et al. (1994); [FMS2001] – Font et al. (2001); FSE – Froebrich et al. (2005); [G82a] – Gyulbudaghian (1982) [G85] – Gyulbudaghian
(1985); [GA90] – Gyulbudaghian & Akopyan (1990); GAL – Kerber et al. (1996); GF – Schneider & Elmegreen (1979); GM – Magakian
(2003); GN – Magakian (2003); GSH – Ehlerova & Palous (2005); [GSL2002] – Giveon et al. (2002) HCL – Heiles (1967); [HW84] –
Hughes & Wouterloot (1984); [IS94] – Indrani & Sridharan (1994); JWT Core – Jessop & Ward-Thompson (2000); [KC97c] – Kuchar & Clark
(1997); KR – Kallas & Reich (1980); [KSH92] – Kawabe et al. (1992); [KTK2006] – Kiss et al. (2006); LDN – Lynds (1962); [LM99] –
Lee & Myers (1999); [M73] – Martin (1973); MBM – Magnani et al. (1985); Min – Minkowski (1947); [MPR2003] – Matthews et al.
(2003); [NJH2003] – Nikoli´ et al. (2003); [P85b] – Petrossian (1985) [PGH98b] Cloud – Patel et al. (1998); [PGS95] – Patel et al. (1995);
c
PP – Parsamian & Petrosian (1979); RNO – Cohen (1980) SFO – Sugitani et al. (1991); Sh 2- – Sharpless (1959); [SMN94] – Sato et al.
(1994); TDS – Taylor et al. (1987); TGU – Dobashi et al. (2005); [THR85] – Torrelles et al. (1985); [TOH95] – Testi et al. (1995); [TW96] –
T´ th & Walmsley (1996); [WAM82] – Wink, Altenhoff & Mezger (1982); [WC89] – Wood & Churchwell (1989); WWC – Weikard et al.
o
(1996); YMD CO – Yonekura et al. (1997); [YF92] – Yang & Fukui (1992); [YNF96] – Yu et al. (1996).
15](https://image.slidesharecdn.com/starformingcepheus-111031001135-phpapp02/85/Star-forming-cepheus-15-320.jpg)


![26
X-ray observations of L 1157, performed by the ASCA satellite, have been pub-
lished by Furusho et al. (2000).
The molecular cloud L 1155 was mapped by Harjunp¨ a & Mattila (1991) in the
a¨
lines of C18 O, HCO+ , and NH3 . The observations revealed that L 1155 consists of two
separate clumps, L1155 C1 and L1155 C2. The optically visible pre-main sequence star
associated with L 1152 is HBC 695 (RNO 124), studied in detail by Movsessian et al.
(2004).
Recently Kauffmann et al. (2005), using the data base of the Spitzer Space Tele-
scope Legacy Program From Molecular Cores to Planet Forming Disks (c2d, Evans et al.
2003) found a candidate sub-stellar (M ≪ 0.1M⊙ ) mass protostellar object in L 1148.
The object L 1148–IRS coincides with IRAS F20404+6712.
PV Cep The highly variable pre-main sequence star PV Cep lies near the northeastern
edge of the dark cloud complex L 1147/L 1158. It is a bright IRAS source, and has been
detected in radio continuum (Anglada et al. 1992). It illuminates a reflection nebula,
known as GM–29 (Gyulbudaghian & Magakian 1977) and RNO 125 (Cohen 1980).
A dramatic brightening of the star (an EXor-like outburst) was observed in the period
1976–1978, and at the same time the shape of the associated nebula changed drastically
(Cohen, Kuhi & Harlan 1977).
The stellar parameters of PV Cep are somewhat uncertain. Most of its optical
spectrograms available show no photospheric absorption features. Cohen et al. (1977),
based on measurements of narrow-band continuum indices, estimated a spectral type
about A5. Cohen et al. (1981) found the same spectral type based on the strength of the
Hδ absorption line, apparent in two blue spectra. They note, however, that the hydrogen
features probably represent merely a shell spectrum. Magakian & Movsessian (2001)
estimated a spectral type of G8–K0, based on a spectrum taken in July 1978, when
the star was some 2 magnitudes fainter than during the outburst. No other estimate of
spectral type can be found in the literature (see Hern´ ndez et al. 2004, for a review).
a
The spectral type of F, quoted by Staude (1986) and Neckel et al. (1987) is also based
on the spectral information presented by Cohen et al. (1981).
Cohen et al. (1981) found a distance of about 500 pc for PV Cep. Their esti-
mate was based on three independent arguments. (1) PV Cep is probably related to
NGC 7023. The spectroscopic and photometric data of its illuminating star, HD 200775,
suggest a distance of 520 pc. (2) The spectroscopic and photometric data of the neb-
ulous star RNO 124, located in the same cloud complex as PV Cep, suggest the same
distance. (3) A similar distance can be obtained from the light travel time from the star
to a nebular spike which brightened about a year after the outburst of the star. On the
contrary, Straizys et al. (1992) obtained a distance of 325 pc for the L 1147/L 1158 dark
cloud complex (see Table 3).
The environment of the star shows a bipolar and rapidly changing optical mor-
phology (Cohen et al. 1981; Neckel & Staude 1984; Staude 1986; Neckel et al. 1987;
Levreault & Opal 1987; Scarrott et al. 1991a,b), as well as a bipolar CO outflow parallel
to the symmetry axis of the reflection nebula (Levreault 1984). Neckel et al. (1987) de-
tected several HH-knots, known as HH 215, emanating from PV Cep. Reipurth, Bally, & Devine
(1997) and G´ mez, Kenyon & Whitney (1997) discovered a giant (∼ 2.3 pc long)
o
Herbig-Haro flow, HH 315, consisting of 23 knots. HH 215 is also part of this giant
flow. Reipurth, Bally, & Devine (1997) detected a further small knot, HH 415, located
north-east of PV Cep, but this may be a dwarf galaxy with Hα redshifted into the [SII]
passband (Bally, priv. comm.). Near-infrared spectroscopy of PV Cep is presented](https://image.slidesharecdn.com/starformingcepheus-111031001135-phpapp02/85/Star-forming-cepheus-26-320.jpg)


![37
Figure 10. Hα + [SII] image of L 1228 A, based on KPNO 4 m images obtained
with the Mosaic 1 prime focus CCD camera through narrow-band Hα and [SII] filters
(80A passband). HH objects discussed in Bally et al. (1995) are marked. (Courtesy
of John Bally).
(1996) revealed two sources. L 1228 VLA 1 is associated with the IRAS source, and
the other, VLA 2, has no known counterpart but is located in the direction of the high
extinction part of the L 1228 core. Reipurth et al. (2004) detected two further 3.6 cm
sources, VLA 3 and VLA 4. VLA 4 is supposed to be the driving source of the HH 200
flow. The environment of IRAS 20582+7724 was studied in detail by Tafalla & Myers
(1997), Arce & Sargent (2004), and Arce & Sargent (2006).
The K′ image of L 1228 A, presented by Hodapp (1994), shows a star associated
with a parabola-shaped nebula, located near the molecular outflow position. Two other
stars further north at offsets (−21′′ ,72′′ ) and (12′′ ,75′′ ) are also associated with some
less extended nebulae. The relatively bright stars in this region clearly stand out against
the faint background stars, so that Hodapp classified this region as a cluster.
(3) L 1228 South contains a small aggregate of low-mass pre-main sequence stars.
Padgett et al. (2004) identified 9 infrared sources in the images taken with IRAC on
board the Spitzer Space Telescope (see Table 7).
L 1219 (B 175) is a small cometary shaped cloud at the southernmost edge of the
Cepheus Flare cloud complex. The cloud is illuminated by the B9.5V type star BD +69◦
1231, associated with the reflection nebula Ced 201 (see Cesarsky et al. 2000, and ref-
erences therein). Two cold IRAS sources, 22129+7000 and 22127+7014, are projected](https://image.slidesharecdn.com/starformingcepheus-111031001135-phpapp02/85/Star-forming-cepheus-37-320.jpg)

![39
1991). Inside the cloud, Umemoto et al. (1991) found an unusual U-shaped CO outflow
associated with a low-luminosity (2.7L⊙ ) Class I source, IRAS 22266+6845. More re-
cent CO observations at high resolution showed that the U-shaped outflow may actually
consist of two bipolar outflows, an east-west outflow associated with the IRAS source
and a north-south outflow about 25′′ to the east of the IRAS source, interacting with
each other (Lee et al. 2002). To the south of the IRAS source, a fairly bright compact
object, HH 363, is detected in Hα and [S II] (Alten et al. 1997). There are three infrared
sources within the error ellipse of the IRAS source: a close binary consisting of an east
source and a west source around the IRAS source position and another source 45′′ to
the southeast. The east source is identified as the IRAS source. Furuya et al. (2003)
detected H2 O maser emission associated with IRAS 22266+6845. Lee & Ho (2005)
mapped IRAS 22266+6845 in 3.3 mm continuum, CO, HCO+ , and N2 H+ . Continuum
emission is seen around the east source and the southeast source at 3.3 mm, probably
tracing the dust around them. Assuming a temperature of 40 K, the masses of the dust
plus gas are estimated to be 0.02 and 0.01 M⊙ around the east source and southeast
source, respectively. No continuum emission is seen toward the west source. The east–
west outflow is likely powered by the east source, which shows a southeast extension
along the outflow axis in the K′ image (Connelley et al. 2007). Wu et al. (2007) de-
tected two submillimeter sources in the cloud, L 1221 SMM 1 and L 1221 SMM 2,
apparently coinciding with the binary and the southeast source, respectively.
L 1251 is a cloud elongated east–west at the eastern boundary of the Cepheus Flare
molecular complex. Its cometary shape suggests interaction with the supernova bubble
described by Grenier et al. (1989). Recent star formation is indicated by two molecular
outflows, driven by IRAS 22343+7501 and IRAS 22376+7455, respectively (Sato & Fukui
1989).
The distance of L 1251 was determined by three different methods (see Table 3).
The cloud has been mapped in several molecular lines, such as 13 CO, C18 O, H13 CO+ ,
SiO (Sato et al. 1994), NH3 (Benson & Myers 1989; T´ th & Walmsley 1996), HNC,
o
HCN, HCO+ , CS (Nikoli´ , Johansson, & Harju 2003). Kun & Prusti (1993) studied
c
the YSO population and reported on 12 Hα emission stars and IRAS point sources as
YSO candidates. Bal´ zs et al. (1992) discovered an optical jet, HH 149, originating
a
from IRAS 22343+7501. Rosvick & Davidge (1995) found that this IRAS source is as-
sociated with a cluster of five near-infrared sources spread over a 10′ ×10′ area (sources
A–E). Meehan et al. (1998) found two thermal radio continuum sources, VLA A and
VLA B, coinciding with the near infrared sources D and A, respectively. Beltr´ n et al.
a
(2001) found 9 radio continuum sources around IRAS 22343+7501, two of them,
VLA 6 and VLA 7 separated by 7′′ , are located within the error ellipse of the IRAS
source and identical with Meehan et al.’s VLA A and VLA B, respectively. Beltr´ n et al.
a
found a third source, VLA 5 to be a probable YSO, based on the positive spectral index.
Nikoli´ et al. (2003) concluded that both VLA 6 and VLA 7 are protostars driving their
c
own outflow.
The high resolution VLA observations by Reipurth et al. (2004) revealed four ra-
dio continuum sources in the region around IRAS 22343+7501, three of which were
known from previous studies. The high resolution VLA A map has revealed a new
source, VLA 10, close to VLA 6, with which it was blended in the earlier low-resolution
data of Meehan et al. (1998). The designations VLA 10 and 11 is a continuation of the
numbering scheme of Beltr´ n et al. (2001). Meehan et al. (1998) suggest that VLA 6
a](https://image.slidesharecdn.com/starformingcepheus-111031001135-phpapp02/85/Star-forming-cepheus-39-320.jpg)


![52
appears very luminous with Lx = 5.1 × 1030 erg s−1 . The source density within 5′ of
the center of emission is 270 sources per square degree.
Getman et al. (2007) detected 117 X-ray sources in a field centered on the globule
IC 1396N (see Sect. 3.2.), of which 50-60 are likely members of Trumpler 37.
Table 10. A. Bright rimmed globules and dark clouds associated with IC 1396.
Names RA(J2000) D(J2000) IRAS Source Ref.
[h m] [◦ ′ ]
FSE 12 21 25 57 53
FSE 13 21 25 58 37
FSE 1, IC 1396 W 21 26 57 58 21246+5743 4,14,16,17
FSE 14, LDN 1086 21 28 57 31
BRC 32 21 32 24 57 24 08 21308+5710
BRC 33, Pottasch IC 1396C 21 33 12 57 29 33 21316+5716
BRC 34, GRS 3, Pottasch IC 1396D 21 33 32 58 03 29 21320+5750
GRS 1 21 32 25 57 48 44
FSE 2, GRS 2 21 33 54 57 49 44 21312+5736
FSE 15 21 33 59 30
FSE 16, LDN 1102 21 33 58 09
FSE 3, LDN 1093, LDN 1098, 21 34 11 57 31 06 21324+5716 29
GRS 4, Pottasch IC 1396B
Weikard Rim I 21 34 35 58 19.5
FSE 4, Pottasch IC 1396A, 21 36 12 57 27 34 21346+5714 5,6,7,14,19,
GRS 6, BRC 36 29,32,33
GRS 5, BRC 35 21 36 05 58 32 17 21345+5818
FSE 5, LDN 1099, LDN 1105, GRS 6 21 36 54 57 30 21352+5715
FSE 6, LDN 1116 21 37 58 37 21354+5823
FSE 17, LDN 1088, GRS 9 21 38 56 56 07 36
GRS 7 21 37 56 57 47 57
Weikard Rim J 21 38 56 56 21.3
FSE 7, GRS 12, BRC 37, 21 40 25 56 35 52 21388+5622 8,9,10,11,14,20,
Pottasch IC 1396H 25,28,31,33,34
WB89 108 21 40 38 56 48 21390+5634
GRS 13 21 40 30 57 46 28
GRS 14 21 40 41 58 15 52
FSE 19, IC 1396 N(orth), LDN 1121, 21 40 43 58 20 09 21391+5802 1,2,3,13,14,15,
GRS 14, WB89 110, 18,25,30,32
BRC 38, Pottasch IC 1396E
FSE 8, GRS 20, LDN 1130, 21 44 00 58 17 00 21428+5802 29
Pottasch IC 1396F
GRS 26 21 44 51 57 08 00
GRS 23 21 45 05 56 59 22 21443+5646
GRS 24 21 45 09 56 47 52
LDN 1132 21 45 45 58 29.3
GRS 25, WB89 122 21 45 58 57 13 54 21436+5657
GRS 27 21 46 03 57 08 41
GRS 28 21 46 27 57 18 07
FSE 9, IC 1396 E(ast), 21 46 38 57 25 55 21445+5712 14,21,25,33
WB89 123, LDN 1118, GRS 29,
BRC 39, Pottasch IC 1396 G
BRC 40 21 46 14 57 08 59 21446+5655
BRC 41 21 46 29 57 18 41 21448+5704
BRC 42 21 46 37 57 12 25 21450+5658
FSE 21, LDN 1129 21 46 27 57 46 37
FSE 22 21 49 56 43
References to globule names and column 5 can be found under Table 10 B.](https://image.slidesharecdn.com/starformingcepheus-111031001135-phpapp02/85/Star-forming-cepheus-52-320.jpg)
![53
Table 10. B. Other clouds in the IC 1396 region whose relation to Cep OB2 is
uncertain.
Names RA(J2000) D(J2000) IRAS source Ref.
[h m] [◦ ′ ]
FSE 18, LDN 1131 21 40 59 34
FSE 20, LDN 1131 21 41 59 36
FSE 10, LDN 1139 21 55 36 58 35 21539+5821 14
FSE 23, LDN 1153 22 01 58 54
FSE 11, LDN 1165, LDN 1164 22 07 00 59 02 22051+5848
GRS 32, LDN 1165 22 07 00 59 00 22051+5848 12,14,15,22,23,
24,25,26,27,28
FSE 24, LBN 102.84+02.07 22 08 58 23
FSE 25, LBN 102.84+02.07 22 08 58 31
References to globule names: Pottasch–Pottasch (1956); GRS–Gyulbudaghian (1985); WB89–
Wouterloot & Brand (1989); BRC–Sugitani et al. (1991); Weikard–Weikard et al. (1996); FSE–
Froebrich et al. (2005).
References to column 5. 1. Beltr´ n et al. (2002); 2. Nisini et al. (2001); 3. Codella et al. (2001);
a
4. Froebrich & Scholz (2003); 5. Nakano et al. (1989); 6. Hessman et al. (1995); 7. Reach et al.
(2004); 8. Duvert et al. (1990); 9. Sugitani et al. (1991); 10. de Vries et al. (2002); 11. Ogura et al.
(2002); 12. Reipurth & Bally (2001); 13. Reipurth et al. (2003); 14: Schwartz et al. (1991); 15:
Reipurth, Bally, & Devine (1997); 16: Froebrich et al. (2003); 17: Zhou et al. (2006); 18: Getman et al.
(2007); 19: Sicilia-Aguilar et al. (2006a); 20: Sugitani et al. (1997); 21: Serabyn et al. (1993); 22:
Reipurth & Aspin (1997); 23: Tapia et al. (1997); 24: Parker et al. (1991); 25: Connelley et al. (2007),
26: Visser et al. (2002); 27: Slysh et al. (1997); 28: Bronfman et al. (1996); 29: Moriarty-Schieven et al.
(1996); 30: Neri et al. (2007); 31: Ogura et al. (2007); 32: Valdettaro et al. (2005); 33: Valdettaro et al.
(2008); 34: Ikeda et al. (2008).
3.2. Star Formation in Globules of IC 1396
The HII region IC 1396 is powered by the O6.5 V star HD 206267. It appears that the
expansion of this HII region has resulted in sweeping up a molecular ring of radius
12 pc (Patel et al. 1998). Patel et al. derive an expansion age of the molecular ring of
about 3 Myr.
The ring-like HII region, shown in Fig. 16, is some 3◦ in diameter and is sur-
rounded by a number of bright-rimmed globules which are probable sites of triggered
star formation due to compression by ionization/shock fronts and radiation pressure.
Many bright rimmed clouds harbor IRAS point sources of low dust temperature. They
also frequently contain small clusters of near-IR stars. The most prominent globules
are located in the western and northern portions of the H II region.
The globules of IC 1396 received different designations during various studies.
Pottasch (1956) labeled the most prominent bright rimmed globules with letters from
A to H, in the order of their increasing distance from the exciting star. Weikard et al.
(1996) supplemented this list by rims I and J. IC 1396A corresponds to the famous
Elephant Trunk Nebula. Gyulbudaghian (1985) identified 32 globules in the region of
Cep OB2, and designated them as GRS (globules of radial systems) 1–32. Four ra-
dial systems of globules have been identified near IC 1396. One system, consisting of
16 globules, is centered on IC 1396. Another system of 12 globules, slightly south of
IC 1396, appears to be associated with BD +54◦ 2612, whereas two further radial sys-](https://image.slidesharecdn.com/starformingcepheus-111031001135-phpapp02/85/Star-forming-cepheus-53-320.jpg)


![62
Table 13. Young stellar objects in IC 1396N detected by Chandra, and their in-
frared counterparts (Getman et al. 2007)
Source NIR(2MASS) MIR
No. CXOU J J H Ks [3.6] [4.5] [5.8] Class Other Id.∗
(mag) (mag) (mag) (mag) (mag) (mag)
41 214027.31+581421.1 14.30 13.30 12.88 11.62 11.09 10.74 II OSP 2
49 214031.58+581755.2 14.03 12.89 12.39 11.51 11.16 10.23 II OSP 4
53 214036.57+581345.8 13.51 12.58 12.24 12.13 11.94 12.01 III OSP 5
55 214036.90+581437.9 11.90 10.89 10.23 9.38 9.10 8.76 II OSP 6
60 214039.62+581609.3 11.29 9.42 8.31 Ia NMV 2
61 214039.87+581834.8 >18.29 15.30 13.36 11.63 10.95 10.21 II NMV 3
62 214041.12+581359.0 12.96 12.08 11.77 11.61 11.72 11.49 III
63 214041.16+581511.2 12.97 11.61 10.68 9.15 8.61 8.05 II OSP 9
65 214041.56+581425.5 13.65 12.62 12.17 11.40 11.20 10.68 II OSP 10
66 214041.81+581612.3 11.30 8.90 7.50 0/Ib
67 214041.91+581523.1 15.68 14.30 13.65 12.69 12.49 >9.82 II
68 214042.89+581601.0 10.60 8.78 7.60 Ic
70 214043.47+581559.7 12.89 11.95 >9.85 I/II
71 214043.64+581618.9 >17.89 >16.09 13.51 9.97 8.72 8.00 I NMV 10
72 214044.34+581513.3 16.05 14.59 13.60 12.42 11.64 10.60 II
73 214044.84+581605.1 >15.85 14.28 12.89 11.73 11.15 10.68 II NMV 11
74 214044.85+581503.4 14.62 13.35 12.66 12.29 11.40 10.96 II OSP 11
76 214045.18+581559.8 11.95 10.82 10.03 I
77 214045.51+581511.4 14.65 13.71 13.11 12.54 12.21 11.82 II
78 214045.53+581602.9 15.68 13.73 12.85 12.23 11.84 >10.37 II
80 214045.79+581549.0 12.59 11.19 10.04 I
81 214046.49+581523.2 12.81 11.95 11.65 11.37 11.33 11.39 III
82 214046.89+581533.3 15.30 13.55 12.63 11.97 11.80 11.15 II
85 214048.03+581537.9 13.89 12.95 12.67 12.08 11.91 10.77 II OSP 12
87 214049.09+581709.3 14.14 12.86 12.13 10.77 10.19 9.69 II OSP 15
∗
OSP: Ogura et al. (2002); NMV: Nisini et al. (2001)
a
X-ray source 60 is offset by 3.2′′ to the north of the radio continuum source VLA 1 and by 5.0′′ to the
northwest of the millimeter source BIMA 1 of Beltr´ n et al. (2002).
a
b
X-ray source 66 is within 0.5′′ of the radio continuum source VLA 2 and millimeter source BIMA 2 of
Beltr´ n et al. (2002). This is also millimeter source A of Codella et al. (2001).
a
c
X-ray source 68 is within 1.0′′ of the radio continuum source VLA 3 and millimeter source BIMA 3 of
Beltr´ n et al. (2002).
a
youngest stars ever detected in the X-ray band. Table 13 shows the list of young stars
identified by their X-ray emission, together with their NIR (2MASS) and MIR (Spitzer
IRAC) magnitudes. Positions of the young stars born in this globule and some of the
associated HH objects are displayed in Fig. 20.
Neri et al. (2007) investigated the mm-morphology of IC 1396N at a scale of
∼250 AU. They have mapped the thermal dust emission at 3.3 and 1.3 mm, and the
emission from the J=13k → 12k hyperfine transitions of methyl cyanide (CH3 CN) in
the most extended configurations of the IRAM Plateau de Bure interferometer. The
observation revealed the existence of a sub-cluster of hot cores in IC 1396 N, consist-
ing of at least three cores, and distributed in a direction perpendicular to the emanat-
ing outflow. The cores are embedded in a common envelope of extended and diffuse](https://image.slidesharecdn.com/starformingcepheus-111031001135-phpapp02/85/Star-forming-cepheus-62-320.jpg)


![66
be found in Table 14. From the spectral indices of IRS 1–3 they concluded that the
radio emission from these sources originates from optically thin HII regions ionized
by Lyman-continuum photons from single, main sequence stars with spectral type of
B1.5-B2. Evans et al. (1989) also carried out near-IR photometry using the NOAO in-
frared camera at 1.2, 1.65, and 2.2 µm. They detected all known far-IR sources except
IRS 2 and found additional 11 sources in the near-IR. At least five of these near-IR
sources appear to be discrete sources, suggesting that a deeply embedded young cluster
is forming in the region. Another cluster, containing about 100 near-IR sources asso-
ciated with S 140, was discovered north of the region by a K′ -band imaging survey by
Hodapp (1994).
Joyce & Simon (1986) carried out a near-infrared polarization study and found
an extremely high level of 2.2 µm polarization towards S 140 IRS 1, indicating an
outflow directed nearly along our line of sight. This finding was later confirmed by
Hayashi et al. (1987) who observed the HII region in 12 CO and 13 CO. Minchin et al.
(1993) found that the blue and redshifted lobes of the CO bipolar outflow have posi-
tion angles of 160◦ and 340◦ , respectively. The high-resolution CS map obtained by
Hayashi & Murata (1992) reveals a prominent V-shaped ridge or a ring around the S 140
IR cluster encircling the blue and red lobes of the molecular outflow, with no emission
detected in the vicinity of the IR sources. The observations suggest that the CS ring is
a remnant of a nearly pole-on massive gaseous disk interacting with the high-velocity
outflow.
A self-consistent model of the region, consistent with all the molecular, atomic
and submm continuum data was provided by Minchin et al. (1995b) (see Fig. 22). Ac-
cording to their model the eastern ridge is the dense, clumpy edge of the blueshifted
outflow lobe that is closest to the observer. This outflow has expanded towards the edge
of the molecular cloud so its blueshifted lobe is bounded by the HII region. Outside this
edge is an externally illuminated PDR. The CI emission emanates from the outer edge
of the cloud, with the CS emission tracing the compressed high density gas between the
expanding outflow and PDR regions. The NH3 and continuum emission emanate from
the inner edge of the outflow lobe, shielded from the external UV field.
Optical and near-infrared images of S 140, adopted from Preibisch & Smith (2002)
are displayed in Fig. 23. According to the catalog of Porras et al. (2003) the S 140
region contains two young stellar groups. One is S 140 itself, another one is S 140 N
identified by Hodapp (1994).
Schwartz (1989) found that the IRS 1 radio source consists of a core source with
a jetlike appendage pointing toward an extended radio source suggesting ejection of an
interstellar bullet of material from IRS 1.
Harker et al. (1997) observed the protostellar system in S 140 at 2.2, 3.1 and 3.45 µm.
They developed a simple model of the region which has been used to derive the phys-
ical conditions of the dust and gas. IRS 1 is surrounded by a dense dusty disk viewed
almost edge-on. Photons leaking out through the poles of the disk illuminate the inner
edge of a surrounding shell of molecular gas as seen at locations NW and VLA4. Their
thick disk model can explain both the observed K−[3.45] color and scattered light in-
tensity distributions. The observed K−[3.45] color of the bluest regions implies a cool
radiation field with a color temperature of 850-900K. Most likely, these cool tempera-
tures are the result of reprocessing of the protostellar radiation field by dust close to the
protostar.](https://image.slidesharecdn.com/starformingcepheus-111031001135-phpapp02/85/Star-forming-cepheus-66-320.jpg)

![68
Table 15. List of Hα emission objects in S 140 (Ogura et al. 2002; Ikeda et al. 2008)
number RA (J2000) Dec(J2000) EW(Hα)
1 22 18 47.8 +63 18 18 ···
2 22 18 48.5 +63 16 40 13.6
3 22 18 49.6 +63 18 56 ···
4 22 18 59.0 +63 18 12 94.8
5 22 18 59.4 +63 19 07 ···
6 22 19 03.5 +63 18 01 ···
7 22 19 09.9 +63 17 21 26.4
8 22 19 16.9 +63 17 22 163.5
Table 16. List of HH objects in S 140
Name RA (J2000) Dec (J2000) Remark from Bally et al. (2002) Ref.
HH 615 22 19 15.6 +63 17 29 [S II] jet aimed at HH 616A 1
HH 616A 22 19 05.9 +63 16 43 Northern tip 1
HH 616B 22 19 05.9 +63 16 26 Middle tip 1
HH 616C 22 19 05.7 +63 16 19 Southern tip 1
HH 616D 22 19 07.1 +63 16 40 Inner shock 1
HH 616E 22 19 12.8 +63 16 43 [S II] edge, southern rim of HH 616 1
HH 616F 22 19 14.3 +63 16 28 [S II] edge, southeastern rim of HH 616 1
HH 617 22 19 03.0 +63 17 53 Northern bow; tip of northern breakout 1
HH 623 22 19 55.0 +63 19 30 Faint knot east of S 140IR 1
HH 618A 22 19 53.0 +63 19 29 Western part of pair, east of S 140IR 1
HH 618B 22 19 54.9 +63 19 30 Eastern part of pair, east of S 140IR 1
Filament 22 18 52.1 +63 16:08 Hα filament at P.A. = 300◦ 1
HH 251 22 19 34.4 +63 32 57 − 2
HH 252 22 19 37.8 +63 32 38 − 2
HH 253 22 19 45.0 +63 31 45 − 2
HH 254 22 19 49.6 +63 31 14 − 2
HH 619 22 19 16.4 +63 32 49 Two knots in east-west flow 1
HH 620 22 19 27.6 +63 32 50 Cluster of three knots south of nebular star 1
HH 621 22 19 21.5 +63 34 44 Cluster of knots: HH 251-254 counterflow 1
HH 622 22 19 50.6 +63 35 18 Pair of knots at P.A. = 220◦ from nebular star 1
HH 609 22 21 28.8 +63 30 02 Southwestern [S II] knot in chain of two 1
HH 610 22 21 33.3 +63 37 34 Tiny knot west of reflection nebula 1
HH 611 22 21 39.5 +63 36 53 Compact groups of [S II] knots 1
HH 612 22 21 54.5 +63 34 39 Compact diffuse [S II] knot 1
HH 613 22 21 58.5 +63 33 23 Faint [S II] group 1
HH 614 22 22 01.2 +63 27 56 Diffuse [S II] complex 1
References: (1) Bally et al. (2002); (2) Eiroa et al. (1993).](https://image.slidesharecdn.com/starformingcepheus-111031001135-phpapp02/85/Star-forming-cepheus-68-320.jpg)


![71
Table 17. List of Class II/I/0 objects in S 140 (Megeath et al. 2004)
RA (J2000) Dec (J2000) [3.6] [4.5] [5.8] [8.0] Class
22 18 21.6 +63 15 32 12.38 12.07 11.65 11.09 Class II
22 18 37.2 +63 13 01 12.91 12.49 12.20 11.65 Class II
22 18 48.5 +63 16 40 9.94 9.65 9.22 8.77 Class II
22 18 47.6 +63 18 17 13.03 12.82 12.26 11.38 Class II
22 18 58.8 +63 18 11 11.84 11.32 10.50 9.87 Class II
22 19 03.4 +63 18 00 12.10 11.78 10.99 10.13 Class II
22 19 24.5 +63 14 26 11.81 11.50 11.50 10.92 Class II
22 19 09.7 +63 17 20 11.97 11.62 11.32 10.62 Class II
22 19 28.3 +63 15 07 12.35 11.56 11.43 10.58 Class II
22 19 25.9 +63 18 24 11.70 10.90 10.23 9.50 Class II
22 19 20.4 +63 19 38 10.74 9.98 9.59 8.95 Class II
22 19 28.5 +63 18 49 11.92 11.32 10.51 9.54 Class II
22 19 27.1 +63 19 22 9.80 9.16 7.93 7.06 Class II
22 19 48.7 +63 16 41 11.37 11.22 11.23 10.46 Class II
22 19 29.1 +63 21 01 13.64 12.89 12.29 11.30 Class II
22 19 38.1 +63 19 32 12.85 12.56 11.78 10.83 Class II
22 20 19.2 +63 16 23 13.01 12.65 12.27 11.31 Class II
22 20 21.0 +63 16 14 13.09 12.62 11.81 10.90 Class II
22 20 07.5 +63 18 45 13.32 12.76 12.24 11.18 Class II
22 19 37.0 +63 25 31 12.54 12.36 11.63 10.65 Class II
22 20 27.3 +63 17 07 11.51 11.20 11.02 10.47 Class II
22 20 27.2 +63 17 58 12.31 11.58 11.10 10.34 Class II
22 19 37.9 +63 17 10 11.43 11.18 10.83 9.54 Class II
22 19 15.6 +63 19 33 11.29 9.75 8.90 7.87 Class 0/I
22 19 25.7 +63 18 49 10.61 9.56 8.74 8.12 Class 0/I
22 19 30.9 +63 18 32 11.16 10.13 9.19 8.54 Class 0/I
22 19 32.5 +63 19 24 9.96 8.38 6.24 4.83 Class 0/I
22 19 39.4 +63 19 03 11.94 10.92 10.43 9.70 Class 0/I
22 19 43.5 +63 20 08 11.91 11.18 10.57 9.30 Class 0/I
22 19 52.3 +63 19 01 14.73 12.78 11.86 11.00 Class 0/I
22 19 48.3 +63 20 27 14.24 12.42 11.62 10.86 Class 0/I
22 19 45.5 +63 21 21 14.59 13.01 12.39 11.47 Class 0/I
22 20 18.5 +63 18 57 12.12 10.73 10.07 8.91 Class 0/I
22 20 19.4 +63 19 05 13.90 12.75 11.90 11.05 Class 0/I
22 19 35.1 +63 20 26 14.80 13.40 12.43 12.14 Class 0/I
and orientation of the reflection lobes around IRS 1, Yao et al. (1998) suggest that S 140
IRS 1 may drive a quadrupolar outflow. Schertl et al. (2000) studied the structure of the
envelope around the central protostar in IRS 1 using high resolution bispectrum speckle
interferometry and speckle polarimetry. Their high resolution images showed bright
emission which can be attributed to light reflected from the inner walls of a cavity in
the circumstellar material around IRS 1. Given that the orientation of the evacuated
cavity agrees with the direction of the molecular outflow they suggest that the cavity
has been carved out by the strong outflow from IRS 1. Recently Hoare (2006) obtained
multiepoch high-resolution radio continuum maps of IRS 1 using the full MERLIN ar-
ray. The observations revealed a highly elongated source that changes over time and
is perpendicular to the larger scale bipolar molecular outflow. He explained the phe-
nomenon with an equatorial wind driven by radiation pressure from the central star
and inner disk acting on the gas in the surface layer of the disk. Jiang et al. (2008)
obtained K-band polarimetric images with the Coronagraphic Imager with Adaptive](https://image.slidesharecdn.com/starformingcepheus-111031001135-phpapp02/85/Star-forming-cepheus-71-320.jpg)


![80
Figure 31. VLA map at 6 cm of Cep A East, observed by Hughes & Wouterloot
(1984), displaying two chains of 14 compact sources.
dio continuum observations, classified the 16 compact sources into two groups: sources
2, 3a,3c, 3d, 8, and 9 harbor an energy source, whereas sources 1a, 1b, 4, 5, 6, 7a, 7b,
7c, and 7d are excited by an external source of energy. Of the stellar sources, HW 2, 3c,
and 3d are probably associated with high luminosity stars, while the variable sources
3a, 8, and 9 are probably low-mass pre-main sequence stars. The nature of source
3b remained uncertain. Torrelles et al. (1998) detected a new continuum source (Cep
A:VLA 1) in an 1.3 cm VLA map. Goetz et al. (1998) present new infrared images,
including near-infrared broadband (K, L′ , and M′ ) and spectral line ([Fe II] emission
line at 1.644 µm and H2 1-0 S[1] line at 2.122 µm) observations of Cep A East. The
images show two regions of shock-excited line emission from separate bipolar flows.
Figure 30, adopted from Hartigan & Lada (1985), shows the schematic structure of the
region of Cep A, and Fig. 31 shows the distribution of the radio continuum sources in
Cep A East, discovered by Hughes & Wouterloot (1984).
Both the compact radio continuum and H2 O maser sources in Cep A exhibit re-
markable variations on various time scales. Hughes (1985; 1988; 1993; 2001) reported
on the variability of sources HW 2, 3c, and 3d, and pointed out that the strong vari-
ability results in appreciable changes in the spectra. Variations of H2 O maser emis-
sion have been detected by Mattila et al. (1985; 1988), Cohen & Brebner (1985), and
Rowland & Cohen (1986).
Patel et al. (2007), using the Submillimeter Array (SMA), detected the 321.226
GHz, 1029 − 936 ortho-H2 O maser emission from Cep A. The 22.235 GHz, 616 − 523
water masers were also observed with the Very Large Array 43 days following the
SMA observations. Three of the nine detected submillimeter maser spots are associ-
ated with the centimeter masers spatially as well as kinematically, while there are 36
22 GHz maser spots without corresponding submillimeter masers. The authors inter-
pret the submillimeter masers in Cepheus A to be tracing significantly hotter regions
(600-2000 K) than the centimeter masers.](https://image.slidesharecdn.com/starformingcepheus-111031001135-phpapp02/85/Star-forming-cepheus-80-320.jpg)


![83
deep X-ray observations with the Chandra Observatory (see Fig. 29). Mookerjea et al.
(2006) studied the emission from the photon dominated regions in Cepheus B, based
on 15′ × 15′ fully sampled maps of [C I] at 492 GHz and 12 CO (4-3) observed at 1′
resolution. They estimated the column densities of neutral carbon in Cepheus B and
studied the factors which determine the abundance of neutral carbon relative to CO.
Table 19. Hα emission stars associated with bright rimmed cloud Cep B
(Ogura et al. 2002)
N RA(J2000) Dec(J2000) EW∗ Remarks∗
1 22 56 37.97 62 39 51.1 69.7
2 22 56 38.12 62 40 58.7 104.7 very weak cont.
3 22 56 39.33 62 38 15.5 80.1
4 22 56 39.58 62 38 43.1 17.2 very weak cont.
5 22 56 39.93 62 41 37.1 14.6 M-star ?
6 22 56 43.54 62 38 07.5 ··· invisible cont.
7 22 56 45.33 62 41 15.8 8.0 M-star ?
8 22 56 47.79 62 38 14.0 22.4
9 22 56 48.02 62 38 40.2 125.6 very weak cont.
10 22 56 48.23 62 39 11.1 62.3 very weak cont.
11 22 56 49.54 62 41 10.0 21.4
12 22 56 49.77 62 40 30.1 81.3 very weak cont.
13 22 56 51.41 62 38 55.8 ··· invisible cont.
14 22 56 52.40 62 40 59.6 63.6 contam. from nearby star
15 22 56 53.87 62 41 17.7 19.0
16 22 56 54.65 62 38 57.8 16.8 weak cont., contam. from bright rim
17 22 56 56.11 62 39 30.8 ··· invisible cont.
18 22 56 57.83 62 40 14.0 59.8
19 22 56 58.65 62 40 56.0 ··· Hα ?
20 22 56 59.68 62 39 20.2 76.4
21 22 57 00.22 62 39 09.4 24.9 weak cont.
22 22 57 01.88 62 37 52.1 ··· invisible cont.
23 22 57 02.63 62 41 48.7 ··· contam. from nearby star
24 22 57 02.93 62 41 14.9 4.9
25 22 57 04.31 62 38 21.1 ··· contam. from neighboring stars
26 22 57 07.86 62 41 33.2 23.1 weak cont.
27 22 57 10.82 62 40 51.0 ··· invisible cont., contam. from bright rim
28 22 57 11.48 62 38 14.1 39.6 very weak cont.
29 22 57 12.10 62 41 48.1 ··· contam. from No. 30 star
30 22 57 13.26 62 41 49.3 ··· contam. from No. 29 star
31 22 57 14.11 62 41 19.8 ··· double star, both show Hα emission
32 22 57 19.38 62 40 22.5 ··· Hα ?, contam. from bright. rim
33 22 57 27.04 62 41 07.9 6.4
34N 22 57 04.93 62 38 23.2 14.2
35N 22 57 05.91 62 38 18.4 10.1
36N 22 56 36.14 62 36 45.9 ··· invisible cont.
37N 22 56 35.29 62 39 07.8 8.1
∗
Column revised by Ikeda et al. (2008)
Cepheus C The mass of this clump, estimated from the formaldehyde observations
obtained by Few & Cohen (1983) is ∼ 3600 N⊙ , which ranks Cep C as the most mas-
sive clump of the Cep OB3 molecular cloud. The region contains a cluster of infrared
sources (Hodapp 1994) and is associated with water maser emission (Wouterloot & Walmsley
1986) and an outflow (Fukui 1989). The Cep C cluster, first identified in a near-IR sur-
vey by Hodapp (1994), was included in the Young Stellar Cluster survey performed by
the Spitzer Space Telescope (Megeath et al. 2004). In addition to the near-IR cluster,](https://image.slidesharecdn.com/starformingcepheus-111031001135-phpapp02/85/Star-forming-cepheus-83-320.jpg)
![84
the IRAC data show Class I and II sources distributed over a 3 pc diameter region. The
molecular gas traced by the C18 O is visible in the IRAC images as filamentary dark
clouds obscuring a diffuse nebulosity extending across the entire mosaic. Two Class I
objects appear outside the C18 O emission; 13 CO emission is found toward both of these
sources.
Cepheus E is the second most massive and dense clump (M ∼2100 M⊙ ) of the
Cep OB3 molecular cloud according to the H2 CO map (Few & Cohen 1983). An
outflow was identified in Cepheus E based on millimeter CO observations (Sargent
1977; Fukui 1989), followed by near-infrared and higher spatial resolution CO stud-
ies (Hodapp 1994; Eisl¨ ffel et al. 1996; Ladd & Hodapp 1997; Noriega-Crespo et al.
o
1998).
The outflow is quite compact, and driven by the source IRAS 23011+6126, also
known as Cep E-mm. The outflow is deeply embedded in a clump of density 105 cm−3
and nearly invisible at optical wavelengths, with the exception of its southern lobe,
which is breaking through the molecular cloud and is seen as HH 377 (Devine et al.
1997; Noriega-Crespo 1997; Noriega-Crespo & Garnavich 2001; Ayala et al. 2000).
Lefloch, Eisl¨ ffel & Lazareff (1996) have shown that IRAS 23011+6126 is a Class 0
o
protostar. The properties of the outflow have been thoroughly analyzed by Eisl¨ ffel et al.
o
(1996), Moro-Martin et al. (2001) and Smith et al. (2003). H2 and [FeII] images ob-
tained by Eisl¨ ffel et al. (1996) have shown two, almost perpendicular outflows ema-
o
nating from Cep E, suggesting that the driving source is a Class 0 binary. Submillimeter
and near-infrared line and continuum observations by Ladd & Hodapp (1997) led to a
similar conclusion. With the assumption that the morphology of the jet results from
precession, Terquem et al. (1999) inferred an orbital separation of 4–20 AU and disk
radius of 1–10 AU for the binary.
Hot molecular bullets were detected in the outflow by Hatchell, Fuller & Ladd
(1999). A comparative study of the Cep E-mm source, in the context of other well
known Class 0/I sources, was carried out by Froebrich et al. (2003).
Submillimeter observations by Chini et al. (2001) and far-infrared photometry by
Froebrich et al. (2003) resulted in Lsubmm /Lbol = 0.017 ± 0.001, an envelope mass
Menv = 7.0 M⊙ , an estimated age of 3 × 10⁴ yr, and an H2 luminosity of 0.07 L⊙ ,
which confirm that Cep E-mm belongs to the Class 0 objects. At a distance2 of 730 pc,
Cep E-mm is one of the brightest Class 0 protostars known and likely to become an
intermediate-mass (3 M⊙ ) star (Moro-Martin et al. 2001; Froebrich et al. 2003).
The Cep E outflow and its protostellar source have been observed using the three
instruments aboard the Spitzer Space Telescope (Noriega-Crespo et al. 2004). The new
observations have shown that the morphology of the outflow in the mid-infrared is
remarkably similar to that of the near-infrared observations. The Cep E-mm source
or IRAS 23011+6126 was detected in all four IRAC channels. The IRAC and MIPS
integrated fluxes of the Cep E-mm source are consistent with the Class 0 envelope
models.
2
Throughout the literature of Cep E, the distance of 730 pc is used. This value is not an independent esti-
mate for this cloud, but rounded from the 725 pc derived by Blaauw et al. (1959) and Crawford & Barnes
(1970) for Cep OB3 (see Ladd & Hodapp 1997).](https://image.slidesharecdn.com/starformingcepheus-111031001135-phpapp02/85/Star-forming-cepheus-84-320.jpg)


![87
Table 23. Herbig–Haro objects in the Cepheus OB3 molecular clouds.
Name RA(2000) Dec(2000) Source Cloud d Reference
[H89] W3 22 56 08.8 +62 01 44 Cep A 700 2
HH 168 22 56 18.0 +62 01 47 HW 2 Cep A 700 1,5
HH 169 22 56 34.8 +62 02 36 HW 2 Cep A 700 3
HH 174 22 56 58.5 +62 01 42 HW 2 Cep A 700 4
HH 377 23 03 00.0 +61 42 00 IRAS 23011+6126 Cep E 700 6
References: 1 – Gyulbudaghian, Glushkov & Denisyuk (1978); 2 – Hughes (1989); 3 –
Corcoran, Ray & Mundt (1993); 4 – Bally et al. (1999); 5 – Hartigan, Morse & Bally (2000); 6 –
Devine et al. (1997).
6. Star Formation in Cepheus OB4
6.1. Structure of Cep OB4
Cep OB4 was discovered by Blanco & Williams (1959), who noticed the presence of
◦ ◦
16 early-type stars in a small region around (l,b)=(118. 4,+4. 7), including the cluster
Berkeley 59. Cep OB4 is related to a dense, irregular dark cloud containing several
emission regions, including the dense H II region S 171 (W 1) in the central part, and
NGC 7822 to the north of S 171 (Lozinskaya, Sitnik & Toropova 1987), see Fig. 34. We
note that in the original catalogs both W 1 (RA(J2000)=00 02 52; Dec(J2000)=+67 14,
Westerhout 1958) and S 171 (RA(J2000)=00 04 40.3; Dec(J2000)=+67 09, Sharpless
1959) are associated with NGC 7822, situated about one degree north of the HII region,
according to its catalog coordinates (RA(J2000)=00 03.6; Dec(J2000)=+68 37). The
Simbad data server also associates these objects with each other. A detailed description
of the association and related objects was given by MacConnell (1968). He identified
42 members earlier than B8 at 845 pc. MacConnell’s UBV photometric study of the
luminous members of Cep OB4 revealed a correlation between the luminosity and red-
dening of the stars: the O and early B stars were found only within the cloud, whereas
later B type stars are found only outside the cloud due to the incompleteness of their
detection. Based on the absence of supergiants, an earliest spectral type of O7 V, and
the gravitational contraction time of a B8 star, MacConnell estimated an age between
0.6 and 6 Myr.
Lozinskaya et al. (1987) studied the morphology and kinematics of the H II re-
gions associated with Cep OB4 based on monochromatic images of the [OIII], [NII],
◦
[SII] and Hα lines, and found two expanding shells: one shell, of radius ∼0. 7, connects
NGC 7822 and S 171. Most Cep OB4 members are located inside this shell; their en-
ergy input into the interstellar medium can account for its observed size and expansion
velocity of 10 km s−1 . The other shell, of radius ∼1. 5, is centered on S 171 and has an
◦
expansion velocity of ∼30–40 km s −1 ; it may be the result of a supernova explosion or
of the stellar wind of a massive star that so far has escaped detection.
Olano et al. (2006) found that the space distribution and kinematics of the interstel-
lar matter in the region of Cep OB4 suggest the presence of a big expanding shell, cen-
tered on (l,b) ∼ (122◦ ,+10◦ ). Assuming a distance of 800 pc for the center they derived
a radius of some 100 pc, expansion velocity of 4 km s−1 , and HI mass of 9.9 × 10⁴ M⊙
for the Cepheus OB4 Shell, whose approximate position is plotted in Fig. 1.](https://image.slidesharecdn.com/starformingcepheus-111031001135-phpapp02/85/Star-forming-cepheus-87-320.jpg)


This document summarizes star forming regions in the constellation of Cepheus. It describes several giant molecular cloud complexes located at various distances from the Sun, ranging from clouds within 500 pc to regions associated with the Perseus spiral arm at 2-3 kpc. Key regions discussed include the Cepheus Flare clouds below 500 pc, three OB associations (Cep OB2, Cep OB3, Cep OB4) located 600-900 pc away, and the well-known high mass star forming region S 140 located at 900 pc. Tables list molecular clouds and young stars identified in the Cepheus region. Maps show the distribution of clouds, extinction, and pre-main sequence stars across Cepheus.


