SlideShare a Scribd company logo
Stanley_Exp22_Excel_Ch03_ML1_Airports.xlsx
PassengerTop 6 United States Airports by Traffic CountTotal
Passenger
Count20092010201120122013201420152016201720182019Tren
dsATLANTA GA
(ATL)84,333,28486,018,89788,530,01791,466,09990,629,17093
,347,14298,729,189101,040,559100,561,162103,740,636107,03
1,757CHICAGO IL
(ORD)62,311,36764,410,84463,737,62164,214,78364,635,84767
,576,62872,654,49075,157,03477,251,64879,870,79081,842,092
LOS ANGELES CA
(LAX)54,895,83057,666,49961,004,77562,541,35264,836,19168
,608,02172,771,18479,084,70682,273,12885,250,02685,794,006
DALLAS/FORT WORTH TX
(DFW)53,214,21454,084,00054,921,29056,041,80458,121,6576
1,638,59563,229,31962,585,26963,661,51465,608,68771,608,00
8DENVER CO
(DEN)47,869,55050,423,64351,277,27051,569,70450,967,83751
,967,71552,482,90156,500,97159,578,70962,713,71667,166,830
NEW YORK
(JFK)45,545,20346,005,22847,246,90348,963,84350,236,35952,
686,77156,044,67458,592,66559,271,63661,344,98762,439,578
Source:https://www.transtats.bts.gov/https://www.transtats.bts.g
ov/
Exp22_Excel_Ch03_ML1_Airports_Instructions.docx
Grader - Instructions Excel 2022
ProjectExp22_Excel_Ch03_ML1_Airports
Project Description:
As an analyst for the airline industry, you track the number of
passengers at the top six major U.S. airports: Atlanta (ATL),
Chicago (ORD), Los Angeles (LAX), Dallas/Fort Worth (DFW),
Denver (DEN), and New York (JFK). You researched passenger
data and created a worksheet that lists the number of total
yearly passengers. You will create a clustered column chart to
compare the number of passengers at each airport. Then, you
will create a line chart that compares trends over time. Next,
you will create a bar chart to compare the passenger count for
the latest year of data available and emphasize the airport with
the largest number of passenger traffic. Finally, you will insert
sparklines to visually represent trends in passengers at each
airport over the ten-year period.
Steps to Perform:
Step
Instructions
Points Possible
1
Start Excel. Download and open the file named
Exp22_Excel_Ch03_ML1_Airports.xlsx.
Grader has automatically added your last name to the beginning
of the filename.
0
2
You want to create a clustered column chart to depict the
passenger counts at the six airports over several years.
Create a clustered column chart for the range A4:L10. Cut the
chart and paste it in cell A15.
5
3
You want to customize the column chart with a chart title,
display the years as a data series, enlarge the chart to be easier
to read, and apply a chart style.
•Type
Passengers Counts at Top U.S. Airports as
the chart title.
•Swap the data on the category axis and in the legend.
•Set a
3.5" height and
11.4" width.
•Apply the Style 7 chart style.
10
4
The value axis takes up a lot of space for the numbers. You will
adjust the value axis to simplify it.
•Change the display units to Millions for the value axis.
•Edit the axis title to display
Millions of Passengers.
5
5
You want to focus on the 2019 data series by adding data labels.
Display data labels above the columns (Outside End position)
for the 2019 data series only.
5
6
Applying a fill color to the chart area will make the chart
visually appealing.
Apply the Light Gradient – Accent 1 gradient fill to the chart
area.
3
7
A best practice is to add Alt Text to a chart for accessibility
compliance.
Add Alt Text:
The column chart displays the number of
passengers. (including the period).
5
8
You want to create a bar chart to display passenger counts for
only one year.
Create a clustered bar chart for the range A5:A10 and L5:L10
and move the chart to a chart sheet named
Bar Chart.
5
9
You want to customize the bar chart.
•Change the chart color to Monochromatic Palette 5.
•Enter
Passengers at Top 6 U.S. Airports in 2019
as the chart title.
•Apply the Style 5 chart style.
•Add Alt Text:
Atlanta had the most passengers.
(including the period).
10
10
Modifying the axes will improve readability of the bar chart.
•Change the font size to 10 for the category axis and value axis.
•Change the value axis Maximum Bound to
1.1E8.
5
11
You will format a data point so that it stands out and then add
gridlines to enhance readability in the bar chart.
•Format the Atlanta data point with Dark Blue fill color.
•Add Primary Minor Vertical gridlines.
5
12
A line chart effectively shows trends over time for the
passenger counts at the different airports.
Create a line chart using the range A4:L10 in the Passenger
worksheet and move the chart to a chart sheet named
Line Chart. Add a chart title
Passengers at U.S. Airports and bold the
title.
8
13
You want to customize the line chart.
•Set the Minimum Bound to
4.0E7 for the value axis and set the
Maximum Bound to
1.1E8.
•Set the Vertical (Value) Axis Display units to Millions. Delete
the Vertical (Value) Axis Display Units Label from the upper-
left corner of the chart. Add a value axis title
In Millions.
•Change the font size to 10 for the value axis and category axis.
•Move the legend to the top.
•Open the Select Data source dialog box and deselect the check
boxes for the even-numbered years. (On a Mac, change the
Chart data range by selecting these ranges:
A4:B10,D4:D10,F4:F10,H4:H10,J4:J10,L4:L10 since the dialog
box does not contain check boxes to deselect the years.)
•Add Alt Text:
The line chart displays trends for top six
U.S. airports. (including the period).
14
14
Sparklines provide a simple visualization to represent data in a
worksheet.
Display the Passenger worksheet and insert Line sparklines in
the range M5:M10 to illustrate the data in the range B5:L10.
8
15
You want to customize the sparklines to point out high and low
points.
•Show the high and low points in each sparkline.
•Apply Black, Text 1 color to the high point marker in each
sparkline.
6
16
Set page formats for the Passenger worksheet.
Select Legal paper size, select Landscape orientation, set
0.3" left and right margins, and scale to fit
1 page.
6
17
Save and close
Exp22_Excel_Ch03_ML1_Airports.xlsx.
Exit Excel. Submit the file as directed.
0
Total Points
100
Created On: 01/27/2022 1
Exp22_Excel_Ch03_ML1_Airports 1.0
Exp22_Excel_Ch03_ML1_Airports_final_result.jpg
Stanley_Exp22_Excel_Ch03_ML2_Grades.xlsx
GradesGrade BookCourse:ACC 200 Financial
AccountingProfessor:Dr. Dae JeongSection:101Passing
Score:70NameTest 1Test 2Final ExamAttendance RecordFinal
AverageLetter
GradeTrendAcosta9084889587.3BBartley8488908587.3BBasque
z7870728573.3CChipman8488808084.0BEthington6064626062.
0DIsham8274829079.3CLeung8690808085.3BMcDonald706662
6066.0DMellor7476808076.7CMusmeaux8690848086.7BNoakes
7478848578.7CNuvek82787410078.0CO'Hair5652605056.0FPad
illa7485889082.3BPryciaszek7884749078.7CQuinn9290949092.
0ARodarte8276868081.3BSager5064687560.7DSmith545048755
0.7FStanworth6862748068.0DStuberg98961009598.0ATakahash
i86889410089.3BThomas7874749075.3CUribe961001009598.7
AWalton7276747074.0CYarnail6455606559.7DGrading
ScaleFinal Grade DistributionBreakpointLetterGrade#
Students0FA359.5DB869.5CC879.5BD589.5AF2
Exp22_Excel_Ch03_ML2_Grades_Instructions.docx
Grader - Instructions Excel 2022
ProjectExp22_Excel_Ch03_ML2_Grades
Project Description:
As Dr. Dae Jeong’s teaching assistant, you maintain their
gradebook for the ACC 200 Financial Accounting class. Dr.
Jeong wants you to create a pie chart that shows the percentage
of students who earn each letter grade. You will also create a
bar chart to show a sample of the students’ test scores.
Furthermore, Dr. Jeong wants to see if a correlation exists
between attendance and students’ final grades; therefore, you
will create a scatter chart depicting each student’s percentage of
attendance with their respective final grade average.
Steps to Perform:
Step
Instructions
Points Possible
1
Start Excel. Download and open the file named
Exp22_Excel_Ch03_ML2_Grades.xlsx.
Grader has automatically added your last name to the beginning
of the filename.
0
2
A pie chart is an effective way to visually illustrate the
percentage of the class that earned A, B, C, D, and F grades.
Use the Insert tab to create a pie chart from the Final Grade
Distribution data located below the student data in the range
F35:G39 and move the pie chart to its own sheet named
Distribution.
10
3
You should enter a chart title to describe the purpose of the
chart. You will customize the pie chart to focus on particular
slices.
•Apply the Style 12 chart style.
•Type
ACC 200 Final Grades: Fall 2024 for the
chart title.
•Explode the A grade slice by 7%.
•Change the F grade slice to Dark Red.
•Remove the legend.
8
4
A best practice is to add Alt Text for accessibility compliance.
Add Alt Text:
Most students earned B and C grades.
(including the period).
2
5
You want to add data labels to indicate the category and
percentage of the class that earned each letter grade.
Add data labels in the Inside End position. Select data label
options to display Percentage and Category Name. Remove the
Values data labels.
3
6
Apply 18-pt size and apply Black, Text 1 font color to the data
labels.
1
7
You want to create a bar chart to depict grades for a sample of
the students in the class.
Create a clustered bar chart using the ranges A5:D5 and
A18:D23 in the Grades worksheet. Move the bar chart to its own
sheet named
Sample Scores.
10
8
Customize the bar chart with these specifications:
· Style 5 chart style
· Legend on the right side in 11 pt font size
· Light Gradient - Accent 2 fill color for the plot area
4
9
The chart needs a descriptive title.
Type
Sample Student Test Scores for the chart
title.
1
10
Displaying the exact scores would help clarify the data in the
chart.
Add data labels in the Outside End position for all data series.
Format the Final Exam data series with Blue-Gray, Text 2 fill
color.
4
11
The student names display in reverse alphabetical order on the
category axis. You want to display the names in alphabetical
order, format the axis, and add Alt Text.
Select the category axis and display the categories in reverse
order in the Format Axis task pane so that
O’Hair is listed at the top and
Sager is listed at the bottom of the bar
chart.
Select the category axis and change the font size to 12.
Add Alt Text:
Quinn earned the highest scores on all
tests. (including the period).
4
12
You want to create a scatter chart to see if the combination of
attendance and final averages are related.
Display the Grades worksheet. Select the range E5:F31 and
create a scatter chart. Cut the chart and paste it in cell A42. Set
a height of
5.96" and a width of
5.5".
10
13
Add Alt Text:
The scatter chart shows the relationship
between final grades and attendance. (including the period).
4
14
Titles will help people understand what is being plotted in the
horizontal and vertical axes, as well as the overall chart
purpose.
Make sure the scatter chart is selected. Type
Final Average-Attendance Relationship as
the chart title and bold the title. Type
Percentage of Attendance as the primary
horizontal axis title, and type
Student Final Averages as the primary
vertical axis title.
6
15
To distinguish the points better, you can start the plotting at 40
rather than 0. Make sure the scatter chart is selected.
Apply these settings to the vertical axis of the scatter chart:
40 minimum bound,
100 maximum bound,
10 major units, and Number format with
0 decimal places.
8
16
Make sure the scatter chart is selected. Apply these settings to
the horizontal axis:
40 minimum bound,
100 maximum bound, automatic units.
4
17
Adding a fill to the plot area will add a touch of color to the
chart.
Make sure the scatter chart is selected. Add the Parchment
texture fill to the plot area.
4
18
You want to insert a trendline to determine trends.
Make sure the scatter chart is selected and insert a linear
trendline chart element.
4
19
You want to add sparklines to detect trends for each student.
Insert Column sparklines in the range H5:H31 using data in the
range B6:D31 on the Grades sheet. Display the Low Point. Set
the Vertical Axis Minimum and Maximum Values to be the
same for all sparklines.
10
20
To make the Sparklines more effective and easier to read, you
will increase the row height.
Change the row height to
22 for rows 6 through 31.
3
21
Save and close
Exp22_Excel_Ch03_ML2_Grades.xlsx.
Exit Excel. Submit the file as directed.
0
Total Points
100
Created On: 06/20/2022 1 Exp22_Excel_Ch03_ML2 -
Grades 1.0
Exp22_Excel_Ch03_ML2_Grades_final_result.jpg
Stanley_Exp22_Excel_Ch03_ML1_Airports.xlsxPassengerTop 6 Unite.docx

More Related Content

Similar to Stanley_Exp22_Excel_Ch03_ML1_Airports.xlsxPassengerTop 6 Unite.docx

Excel Project 2 – MS Excel Summer 2018 Use the project.docx
Excel Project 2 – MS Excel Summer 2018 Use the project.docxExcel Project 2 – MS Excel Summer 2018 Use the project.docx
Excel Project 2 – MS Excel Summer 2018 Use the project.docx
elbanglis
 
Excel Project 3 – MS Excel (Fall 2018) Use the project.docx
Excel Project 3 – MS Excel (Fall 2018) Use the project.docxExcel Project 3 – MS Excel (Fall 2018) Use the project.docx
Excel Project 3 – MS Excel (Fall 2018) Use the project.docx
cravennichole326
 
Excel Project 1 – MS Excel Use the project description HER.docx
Excel Project 1 – MS Excel Use the project description HER.docxExcel Project 1 – MS Excel Use the project description HER.docx
Excel Project 1 – MS Excel Use the project description HER.docx
SANSKAR20
 
Excel Project 1 – MS Excel (Summer 2019) Use the foll.docx
Excel Project 1 – MS Excel (Summer 2019)  Use the foll.docxExcel Project 1 – MS Excel (Summer 2019)  Use the foll.docx
Excel Project 1 – MS Excel (Summer 2019) Use the foll.docx
cravennichole326
 
Spring 2020 excel project #1 instructions
Spring 2020 excel project #1   instructionsSpring 2020 excel project #1   instructions
Spring 2020 excel project #1 instructions
AnetteNsah
 
Computer Application Technology - Editing & Formatting charts.pptx
Computer Application Technology - Editing & Formatting charts.pptxComputer Application Technology - Editing & Formatting charts.pptx
Computer Application Technology - Editing & Formatting charts.pptx
UngasholuthoKminaMus
 
Excel Portion of the ProjectSteps 1-4Use this ClassSection .docx
Excel Portion of the ProjectSteps 1-4Use this ClassSection .docxExcel Portion of the ProjectSteps 1-4Use this ClassSection .docx
Excel Portion of the ProjectSteps 1-4Use this ClassSection .docx
cravennichole326
 
IFSM 201 Possible Is Everything/newtonhelp.com
IFSM 201 Possible Is Everything/newtonhelp.comIFSM 201 Possible Is Everything/newtonhelp.com
IFSM 201 Possible Is Everything/newtonhelp.com
lechenau70
 
IFSM 201 Learn/newtonhelp.com
IFSM 201 Learn/newtonhelp.comIFSM 201 Learn/newtonhelp.com
IFSM 201 Learn/newtonhelp.com
lechenau47
 
IFSM 201 Exceptional Education - snaptutorial.com
IFSM 201  Exceptional Education - snaptutorial.comIFSM 201  Exceptional Education - snaptutorial.com
IFSM 201 Exceptional Education - snaptutorial.com
DavisMurphyB9
 
BIS 155 Education Specialist / snaptutorial.com
BIS 155  Education Specialist / snaptutorial.comBIS 155  Education Specialist / snaptutorial.com
BIS 155 Education Specialist / snaptutorial.com
McdonaldRyan131
 
Q1&Q2Classic Gardens and Landscapes (CGL) Revenue for Quarters 1 a.docx
Q1&Q2Classic Gardens and Landscapes (CGL) Revenue for Quarters 1 a.docxQ1&Q2Classic Gardens and Landscapes (CGL) Revenue for Quarters 1 a.docx
Q1&Q2Classic Gardens and Landscapes (CGL) Revenue for Quarters 1 a.docx
amrit47
 
Bis 155 Exceptional Education / snaptutorial.com
Bis 155 Exceptional Education / snaptutorial.comBis 155 Exceptional Education / snaptutorial.com
Bis 155 Exceptional Education / snaptutorial.com
Davis142
 
Excel Project 2 Check FiguresSteps 1-2-3 As instructedStep
Excel Project 2 Check FiguresSteps 1-2-3  As instructedStepExcel Project 2 Check FiguresSteps 1-2-3  As instructedStep
Excel Project 2 Check FiguresSteps 1-2-3 As instructedStep
galinagrabow44ms
 
BIS 155 Inspiring Innovation -- bis155.com
BIS 155 Inspiring Innovation -- bis155.comBIS 155 Inspiring Innovation -- bis155.com
BIS 155 Inspiring Innovation -- bis155.com
kopiko101
 
BIS 155 Lessons in Excellence / bis155.com
BIS 155 Lessons in Excellence / bis155.comBIS 155 Lessons in Excellence / bis155.com
BIS 155 Lessons in Excellence / bis155.com
kopiko33
 
Bis 155 Enhance teaching / snaptutorial.com
Bis 155  Enhance teaching / snaptutorial.comBis 155  Enhance teaching / snaptutorial.com
Bis 155 Enhance teaching / snaptutorial.com
HarrisGeorg46
 
BIS 155 PAPERS Education for Service--bis155papers.com
BIS 155 PAPERS Education for Service--bis155papers.comBIS 155 PAPERS Education for Service--bis155papers.com
BIS 155 PAPERS Education for Service--bis155papers.com
abhila172
 
Ifsm 201 Enhance teaching / snaptutorial.com
Ifsm 201 Enhance teaching / snaptutorial.comIfsm 201 Enhance teaching / snaptutorial.com
Ifsm 201 Enhance teaching / snaptutorial.com
Baileya15
 
Ifsm 201 Future Our Mission/newtonhelp.com
Ifsm 201 Future Our Mission/newtonhelp.comIfsm 201 Future Our Mission/newtonhelp.com
Ifsm 201 Future Our Mission/newtonhelp.com
amaranthbeg39
 

Similar to Stanley_Exp22_Excel_Ch03_ML1_Airports.xlsxPassengerTop 6 Unite.docx (20)

Excel Project 2 – MS Excel Summer 2018 Use the project.docx
Excel Project 2 – MS Excel Summer 2018 Use the project.docxExcel Project 2 – MS Excel Summer 2018 Use the project.docx
Excel Project 2 – MS Excel Summer 2018 Use the project.docx
 
Excel Project 3 – MS Excel (Fall 2018) Use the project.docx
Excel Project 3 – MS Excel (Fall 2018) Use the project.docxExcel Project 3 – MS Excel (Fall 2018) Use the project.docx
Excel Project 3 – MS Excel (Fall 2018) Use the project.docx
 
Excel Project 1 – MS Excel Use the project description HER.docx
Excel Project 1 – MS Excel Use the project description HER.docxExcel Project 1 – MS Excel Use the project description HER.docx
Excel Project 1 – MS Excel Use the project description HER.docx
 
Excel Project 1 – MS Excel (Summer 2019) Use the foll.docx
Excel Project 1 – MS Excel (Summer 2019)  Use the foll.docxExcel Project 1 – MS Excel (Summer 2019)  Use the foll.docx
Excel Project 1 – MS Excel (Summer 2019) Use the foll.docx
 
Spring 2020 excel project #1 instructions
Spring 2020 excel project #1   instructionsSpring 2020 excel project #1   instructions
Spring 2020 excel project #1 instructions
 
Computer Application Technology - Editing & Formatting charts.pptx
Computer Application Technology - Editing & Formatting charts.pptxComputer Application Technology - Editing & Formatting charts.pptx
Computer Application Technology - Editing & Formatting charts.pptx
 
Excel Portion of the ProjectSteps 1-4Use this ClassSection .docx
Excel Portion of the ProjectSteps 1-4Use this ClassSection .docxExcel Portion of the ProjectSteps 1-4Use this ClassSection .docx
Excel Portion of the ProjectSteps 1-4Use this ClassSection .docx
 
IFSM 201 Possible Is Everything/newtonhelp.com
IFSM 201 Possible Is Everything/newtonhelp.comIFSM 201 Possible Is Everything/newtonhelp.com
IFSM 201 Possible Is Everything/newtonhelp.com
 
IFSM 201 Learn/newtonhelp.com
IFSM 201 Learn/newtonhelp.comIFSM 201 Learn/newtonhelp.com
IFSM 201 Learn/newtonhelp.com
 
IFSM 201 Exceptional Education - snaptutorial.com
IFSM 201  Exceptional Education - snaptutorial.comIFSM 201  Exceptional Education - snaptutorial.com
IFSM 201 Exceptional Education - snaptutorial.com
 
BIS 155 Education Specialist / snaptutorial.com
BIS 155  Education Specialist / snaptutorial.comBIS 155  Education Specialist / snaptutorial.com
BIS 155 Education Specialist / snaptutorial.com
 
Q1&Q2Classic Gardens and Landscapes (CGL) Revenue for Quarters 1 a.docx
Q1&Q2Classic Gardens and Landscapes (CGL) Revenue for Quarters 1 a.docxQ1&Q2Classic Gardens and Landscapes (CGL) Revenue for Quarters 1 a.docx
Q1&Q2Classic Gardens and Landscapes (CGL) Revenue for Quarters 1 a.docx
 
Bis 155 Exceptional Education / snaptutorial.com
Bis 155 Exceptional Education / snaptutorial.comBis 155 Exceptional Education / snaptutorial.com
Bis 155 Exceptional Education / snaptutorial.com
 
Excel Project 2 Check FiguresSteps 1-2-3 As instructedStep
Excel Project 2 Check FiguresSteps 1-2-3  As instructedStepExcel Project 2 Check FiguresSteps 1-2-3  As instructedStep
Excel Project 2 Check FiguresSteps 1-2-3 As instructedStep
 
BIS 155 Inspiring Innovation -- bis155.com
BIS 155 Inspiring Innovation -- bis155.comBIS 155 Inspiring Innovation -- bis155.com
BIS 155 Inspiring Innovation -- bis155.com
 
BIS 155 Lessons in Excellence / bis155.com
BIS 155 Lessons in Excellence / bis155.comBIS 155 Lessons in Excellence / bis155.com
BIS 155 Lessons in Excellence / bis155.com
 
Bis 155 Enhance teaching / snaptutorial.com
Bis 155  Enhance teaching / snaptutorial.comBis 155  Enhance teaching / snaptutorial.com
Bis 155 Enhance teaching / snaptutorial.com
 
BIS 155 PAPERS Education for Service--bis155papers.com
BIS 155 PAPERS Education for Service--bis155papers.comBIS 155 PAPERS Education for Service--bis155papers.com
BIS 155 PAPERS Education for Service--bis155papers.com
 
Ifsm 201 Enhance teaching / snaptutorial.com
Ifsm 201 Enhance teaching / snaptutorial.comIfsm 201 Enhance teaching / snaptutorial.com
Ifsm 201 Enhance teaching / snaptutorial.com
 
Ifsm 201 Future Our Mission/newtonhelp.com
Ifsm 201 Future Our Mission/newtonhelp.comIfsm 201 Future Our Mission/newtonhelp.com
Ifsm 201 Future Our Mission/newtonhelp.com
 

More from mckellarhastings

Conduct an internet search finding a job you are interested (HR .docx
Conduct an internet search finding a job you are interested (HR .docxConduct an internet search finding a job you are interested (HR .docx
Conduct an internet search finding a job you are interested (HR .docx
mckellarhastings
 
Conduct an Internet or library search for information on The Bay of.docx
Conduct an Internet or library search for information on The Bay of.docxConduct an Internet or library search for information on The Bay of.docx
Conduct an Internet or library search for information on The Bay of.docx
mckellarhastings
 
Conduct an internet search about the murder of Yeardley Love. After .docx
Conduct an internet search about the murder of Yeardley Love. After .docxConduct an internet search about the murder of Yeardley Love. After .docx
Conduct an internet search about the murder of Yeardley Love. After .docx
mckellarhastings
 
At this point, you’ve organized your HR project team and you are.docx
At this point, you’ve organized your HR project team and you are.docxAt this point, you’ve organized your HR project team and you are.docx
At this point, you’ve organized your HR project team and you are.docx
mckellarhastings
 
At the beginning of 2012, the Jeater company had the following balan.docx
At the beginning of 2012, the Jeater company had the following balan.docxAt the beginning of 2012, the Jeater company had the following balan.docx
At the beginning of 2012, the Jeater company had the following balan.docx
mckellarhastings
 
At many different points throughout the collection Born a Crime, Tre.docx
At many different points throughout the collection Born a Crime, Tre.docxAt many different points throughout the collection Born a Crime, Tre.docx
At many different points throughout the collection Born a Crime, Tre.docx
mckellarhastings
 
At least 200 wordss or more per question. Answer UNDER question. And.docx
At least 200 wordss or more per question. Answer UNDER question. And.docxAt least 200 wordss or more per question. Answer UNDER question. And.docx
At least 200 wordss or more per question. Answer UNDER question. And.docx
mckellarhastings
 
At least 200 words per question. Chapter 11The Idea .docx
At least 200 words per question. Chapter 11The Idea .docxAt least 200 words per question. Chapter 11The Idea .docx
At least 200 words per question. Chapter 11The Idea .docx
mckellarhastings
 
At least 150 words each. Use a reference for each question and us.docx
At least 150 words each.  Use a reference for each question and us.docxAt least 150 words each.  Use a reference for each question and us.docx
At least 150 words each. Use a reference for each question and us.docx
mckellarhastings
 
At least 250 words per question. Chapter 11The Idea of Craft A.docx
At least 250 words per question. Chapter 11The Idea of Craft A.docxAt least 250 words per question. Chapter 11The Idea of Craft A.docx
At least 250 words per question. Chapter 11The Idea of Craft A.docx
mckellarhastings
 
At its core, pathology is the study of disease. Diseases occur for m.docx
At its core, pathology is the study of disease. Diseases occur for m.docxAt its core, pathology is the study of disease. Diseases occur for m.docx
At its core, pathology is the study of disease. Diseases occur for m.docx
mckellarhastings
 
assumptions people make about this topic (homelessness, immigration,.docx
assumptions people make about this topic (homelessness, immigration,.docxassumptions people make about this topic (homelessness, immigration,.docx
assumptions people make about this topic (homelessness, immigration,.docx
mckellarhastings
 
At age 12, Freeman Hrabowski marched with Martin Luther King. Now he.docx
At age 12, Freeman Hrabowski marched with Martin Luther King. Now he.docxAt age 12, Freeman Hrabowski marched with Martin Luther King. Now he.docx
At age 12, Freeman Hrabowski marched with Martin Luther King. Now he.docx
mckellarhastings
 
At each of the locations listed below, there is evidence of plat.docx
At each of the locations listed below, there is evidence of plat.docxAt each of the locations listed below, there is evidence of plat.docx
At each of the locations listed below, there is evidence of plat.docx
mckellarhastings
 
Assume you hold the Special Agent in Charge role of the Joint .docx
Assume you hold the Special Agent in Charge role of the Joint .docxAssume you hold the Special Agent in Charge role of the Joint .docx
Assume you hold the Special Agent in Charge role of the Joint .docx
mckellarhastings
 
Assume you are a DFI and you must deliver a presentation to the Stat.docx
Assume you are a DFI and you must deliver a presentation to the Stat.docxAssume you are a DFI and you must deliver a presentation to the Stat.docx
Assume you are a DFI and you must deliver a presentation to the Stat.docx
mckellarhastings
 
Assume that you work for the District Board of Education. The Direct.docx
Assume that you work for the District Board of Education. The Direct.docxAssume that you work for the District Board of Education. The Direct.docx
Assume that you work for the District Board of Education. The Direct.docx
mckellarhastings
 
Assume that you have been tasked by your employer to develop an inci.docx
Assume that you have been tasked by your employer to develop an inci.docxAssume that you have been tasked by your employer to develop an inci.docx
Assume that you have been tasked by your employer to develop an inci.docx
mckellarhastings
 
Assume that you generate an authenticated and encrypted message by f.docx
Assume that you generate an authenticated and encrypted message by f.docxAssume that you generate an authenticated and encrypted message by f.docx
Assume that you generate an authenticated and encrypted message by f.docx
mckellarhastings
 
Assume that you are in your chosen criminal justice profession, .docx
Assume that you are in your chosen criminal justice profession, .docxAssume that you are in your chosen criminal justice profession, .docx
Assume that you are in your chosen criminal justice profession, .docx
mckellarhastings
 

More from mckellarhastings (20)

Conduct an internet search finding a job you are interested (HR .docx
Conduct an internet search finding a job you are interested (HR .docxConduct an internet search finding a job you are interested (HR .docx
Conduct an internet search finding a job you are interested (HR .docx
 
Conduct an Internet or library search for information on The Bay of.docx
Conduct an Internet or library search for information on The Bay of.docxConduct an Internet or library search for information on The Bay of.docx
Conduct an Internet or library search for information on The Bay of.docx
 
Conduct an internet search about the murder of Yeardley Love. After .docx
Conduct an internet search about the murder of Yeardley Love. After .docxConduct an internet search about the murder of Yeardley Love. After .docx
Conduct an internet search about the murder of Yeardley Love. After .docx
 
At this point, you’ve organized your HR project team and you are.docx
At this point, you’ve organized your HR project team and you are.docxAt this point, you’ve organized your HR project team and you are.docx
At this point, you’ve organized your HR project team and you are.docx
 
At the beginning of 2012, the Jeater company had the following balan.docx
At the beginning of 2012, the Jeater company had the following balan.docxAt the beginning of 2012, the Jeater company had the following balan.docx
At the beginning of 2012, the Jeater company had the following balan.docx
 
At many different points throughout the collection Born a Crime, Tre.docx
At many different points throughout the collection Born a Crime, Tre.docxAt many different points throughout the collection Born a Crime, Tre.docx
At many different points throughout the collection Born a Crime, Tre.docx
 
At least 200 wordss or more per question. Answer UNDER question. And.docx
At least 200 wordss or more per question. Answer UNDER question. And.docxAt least 200 wordss or more per question. Answer UNDER question. And.docx
At least 200 wordss or more per question. Answer UNDER question. And.docx
 
At least 200 words per question. Chapter 11The Idea .docx
At least 200 words per question. Chapter 11The Idea .docxAt least 200 words per question. Chapter 11The Idea .docx
At least 200 words per question. Chapter 11The Idea .docx
 
At least 150 words each. Use a reference for each question and us.docx
At least 150 words each.  Use a reference for each question and us.docxAt least 150 words each.  Use a reference for each question and us.docx
At least 150 words each. Use a reference for each question and us.docx
 
At least 250 words per question. Chapter 11The Idea of Craft A.docx
At least 250 words per question. Chapter 11The Idea of Craft A.docxAt least 250 words per question. Chapter 11The Idea of Craft A.docx
At least 250 words per question. Chapter 11The Idea of Craft A.docx
 
At its core, pathology is the study of disease. Diseases occur for m.docx
At its core, pathology is the study of disease. Diseases occur for m.docxAt its core, pathology is the study of disease. Diseases occur for m.docx
At its core, pathology is the study of disease. Diseases occur for m.docx
 
assumptions people make about this topic (homelessness, immigration,.docx
assumptions people make about this topic (homelessness, immigration,.docxassumptions people make about this topic (homelessness, immigration,.docx
assumptions people make about this topic (homelessness, immigration,.docx
 
At age 12, Freeman Hrabowski marched with Martin Luther King. Now he.docx
At age 12, Freeman Hrabowski marched with Martin Luther King. Now he.docxAt age 12, Freeman Hrabowski marched with Martin Luther King. Now he.docx
At age 12, Freeman Hrabowski marched with Martin Luther King. Now he.docx
 
At each of the locations listed below, there is evidence of plat.docx
At each of the locations listed below, there is evidence of plat.docxAt each of the locations listed below, there is evidence of plat.docx
At each of the locations listed below, there is evidence of plat.docx
 
Assume you hold the Special Agent in Charge role of the Joint .docx
Assume you hold the Special Agent in Charge role of the Joint .docxAssume you hold the Special Agent in Charge role of the Joint .docx
Assume you hold the Special Agent in Charge role of the Joint .docx
 
Assume you are a DFI and you must deliver a presentation to the Stat.docx
Assume you are a DFI and you must deliver a presentation to the Stat.docxAssume you are a DFI and you must deliver a presentation to the Stat.docx
Assume you are a DFI and you must deliver a presentation to the Stat.docx
 
Assume that you work for the District Board of Education. The Direct.docx
Assume that you work for the District Board of Education. The Direct.docxAssume that you work for the District Board of Education. The Direct.docx
Assume that you work for the District Board of Education. The Direct.docx
 
Assume that you have been tasked by your employer to develop an inci.docx
Assume that you have been tasked by your employer to develop an inci.docxAssume that you have been tasked by your employer to develop an inci.docx
Assume that you have been tasked by your employer to develop an inci.docx
 
Assume that you generate an authenticated and encrypted message by f.docx
Assume that you generate an authenticated and encrypted message by f.docxAssume that you generate an authenticated and encrypted message by f.docx
Assume that you generate an authenticated and encrypted message by f.docx
 
Assume that you are in your chosen criminal justice profession, .docx
Assume that you are in your chosen criminal justice profession, .docxAssume that you are in your chosen criminal justice profession, .docx
Assume that you are in your chosen criminal justice profession, .docx
 

Recently uploaded

The Diamonds of 2023-2024 in the IGRA collection
The Diamonds of 2023-2024 in the IGRA collectionThe Diamonds of 2023-2024 in the IGRA collection
The Diamonds of 2023-2024 in the IGRA collection
Israel Genealogy Research Association
 
The basics of sentences session 6pptx.pptx
The basics of sentences session 6pptx.pptxThe basics of sentences session 6pptx.pptx
The basics of sentences session 6pptx.pptx
heathfieldcps1
 
Exploiting Artificial Intelligence for Empowering Researchers and Faculty, In...
Exploiting Artificial Intelligence for Empowering Researchers and Faculty, In...Exploiting Artificial Intelligence for Empowering Researchers and Faculty, In...
Exploiting Artificial Intelligence for Empowering Researchers and Faculty, In...
Dr. Vinod Kumar Kanvaria
 
How to Build a Module in Odoo 17 Using the Scaffold Method
How to Build a Module in Odoo 17 Using the Scaffold MethodHow to Build a Module in Odoo 17 Using the Scaffold Method
How to Build a Module in Odoo 17 Using the Scaffold Method
Celine George
 
clinical examination of hip joint (1).pdf
clinical examination of hip joint (1).pdfclinical examination of hip joint (1).pdf
clinical examination of hip joint (1).pdf
Priyankaranawat4
 
S1-Introduction-Biopesticides in ICM.pptx
S1-Introduction-Biopesticides in ICM.pptxS1-Introduction-Biopesticides in ICM.pptx
S1-Introduction-Biopesticides in ICM.pptx
tarandeep35
 
ANATOMY AND BIOMECHANICS OF HIP JOINT.pdf
ANATOMY AND BIOMECHANICS OF HIP JOINT.pdfANATOMY AND BIOMECHANICS OF HIP JOINT.pdf
ANATOMY AND BIOMECHANICS OF HIP JOINT.pdf
Priyankaranawat4
 
Azure Interview Questions and Answers PDF By ScholarHat
Azure Interview Questions and Answers PDF By ScholarHatAzure Interview Questions and Answers PDF By ScholarHat
Azure Interview Questions and Answers PDF By ScholarHat
Scholarhat
 
Chapter 4 - Islamic Financial Institutions in Malaysia.pptx
Chapter 4 - Islamic Financial Institutions in Malaysia.pptxChapter 4 - Islamic Financial Institutions in Malaysia.pptx
Chapter 4 - Islamic Financial Institutions in Malaysia.pptx
Mohd Adib Abd Muin, Senior Lecturer at Universiti Utara Malaysia
 
Main Java[All of the Base Concepts}.docx
Main Java[All of the Base Concepts}.docxMain Java[All of the Base Concepts}.docx
Main Java[All of the Base Concepts}.docx
adhitya5119
 
বাংলাদেশ অর্থনৈতিক সমীক্ষা (Economic Review) ২০২৪ UJS App.pdf
বাংলাদেশ অর্থনৈতিক সমীক্ষা (Economic Review) ২০২৪ UJS App.pdfবাংলাদেশ অর্থনৈতিক সমীক্ষা (Economic Review) ২০২৪ UJS App.pdf
বাংলাদেশ অর্থনৈতিক সমীক্ষা (Economic Review) ২০২৪ UJS App.pdf
eBook.com.bd (প্রয়োজনীয় বাংলা বই)
 
How to Add Chatter in the odoo 17 ERP Module
How to Add Chatter in the odoo 17 ERP ModuleHow to Add Chatter in the odoo 17 ERP Module
How to Add Chatter in the odoo 17 ERP Module
Celine George
 
The simplified electron and muon model, Oscillating Spacetime: The Foundation...
The simplified electron and muon model, Oscillating Spacetime: The Foundation...The simplified electron and muon model, Oscillating Spacetime: The Foundation...
The simplified electron and muon model, Oscillating Spacetime: The Foundation...
RitikBhardwaj56
 
World environment day ppt For 5 June 2024
World environment day ppt For 5 June 2024World environment day ppt For 5 June 2024
World environment day ppt For 5 June 2024
ak6969907
 
South African Journal of Science: Writing with integrity workshop (2024)
South African Journal of Science: Writing with integrity workshop (2024)South African Journal of Science: Writing with integrity workshop (2024)
South African Journal of Science: Writing with integrity workshop (2024)
Academy of Science of South Africa
 
Introduction to AI for Nonprofits with Tapp Network
Introduction to AI for Nonprofits with Tapp NetworkIntroduction to AI for Nonprofits with Tapp Network
Introduction to AI for Nonprofits with Tapp Network
TechSoup
 
PIMS Job Advertisement 2024.pdf Islamabad
PIMS Job Advertisement 2024.pdf IslamabadPIMS Job Advertisement 2024.pdf Islamabad
PIMS Job Advertisement 2024.pdf Islamabad
AyyanKhan40
 
Hindi varnamala | hindi alphabet PPT.pdf
Hindi varnamala | hindi alphabet PPT.pdfHindi varnamala | hindi alphabet PPT.pdf
Hindi varnamala | hindi alphabet PPT.pdf
Dr. Mulla Adam Ali
 
BÀI TẬP BỔ TRỢ TIẾNG ANH 8 CẢ NĂM - GLOBAL SUCCESS - NĂM HỌC 2023-2024 (CÓ FI...
BÀI TẬP BỔ TRỢ TIẾNG ANH 8 CẢ NĂM - GLOBAL SUCCESS - NĂM HỌC 2023-2024 (CÓ FI...BÀI TẬP BỔ TRỢ TIẾNG ANH 8 CẢ NĂM - GLOBAL SUCCESS - NĂM HỌC 2023-2024 (CÓ FI...
BÀI TẬP BỔ TRỢ TIẾNG ANH 8 CẢ NĂM - GLOBAL SUCCESS - NĂM HỌC 2023-2024 (CÓ FI...
Nguyen Thanh Tu Collection
 
A Survey of Techniques for Maximizing LLM Performance.pptx
A Survey of Techniques for Maximizing LLM Performance.pptxA Survey of Techniques for Maximizing LLM Performance.pptx
A Survey of Techniques for Maximizing LLM Performance.pptx
thanhdowork
 

Recently uploaded (20)

The Diamonds of 2023-2024 in the IGRA collection
The Diamonds of 2023-2024 in the IGRA collectionThe Diamonds of 2023-2024 in the IGRA collection
The Diamonds of 2023-2024 in the IGRA collection
 
The basics of sentences session 6pptx.pptx
The basics of sentences session 6pptx.pptxThe basics of sentences session 6pptx.pptx
The basics of sentences session 6pptx.pptx
 
Exploiting Artificial Intelligence for Empowering Researchers and Faculty, In...
Exploiting Artificial Intelligence for Empowering Researchers and Faculty, In...Exploiting Artificial Intelligence for Empowering Researchers and Faculty, In...
Exploiting Artificial Intelligence for Empowering Researchers and Faculty, In...
 
How to Build a Module in Odoo 17 Using the Scaffold Method
How to Build a Module in Odoo 17 Using the Scaffold MethodHow to Build a Module in Odoo 17 Using the Scaffold Method
How to Build a Module in Odoo 17 Using the Scaffold Method
 
clinical examination of hip joint (1).pdf
clinical examination of hip joint (1).pdfclinical examination of hip joint (1).pdf
clinical examination of hip joint (1).pdf
 
S1-Introduction-Biopesticides in ICM.pptx
S1-Introduction-Biopesticides in ICM.pptxS1-Introduction-Biopesticides in ICM.pptx
S1-Introduction-Biopesticides in ICM.pptx
 
ANATOMY AND BIOMECHANICS OF HIP JOINT.pdf
ANATOMY AND BIOMECHANICS OF HIP JOINT.pdfANATOMY AND BIOMECHANICS OF HIP JOINT.pdf
ANATOMY AND BIOMECHANICS OF HIP JOINT.pdf
 
Azure Interview Questions and Answers PDF By ScholarHat
Azure Interview Questions and Answers PDF By ScholarHatAzure Interview Questions and Answers PDF By ScholarHat
Azure Interview Questions and Answers PDF By ScholarHat
 
Chapter 4 - Islamic Financial Institutions in Malaysia.pptx
Chapter 4 - Islamic Financial Institutions in Malaysia.pptxChapter 4 - Islamic Financial Institutions in Malaysia.pptx
Chapter 4 - Islamic Financial Institutions in Malaysia.pptx
 
Main Java[All of the Base Concepts}.docx
Main Java[All of the Base Concepts}.docxMain Java[All of the Base Concepts}.docx
Main Java[All of the Base Concepts}.docx
 
বাংলাদেশ অর্থনৈতিক সমীক্ষা (Economic Review) ২০২৪ UJS App.pdf
বাংলাদেশ অর্থনৈতিক সমীক্ষা (Economic Review) ২০২৪ UJS App.pdfবাংলাদেশ অর্থনৈতিক সমীক্ষা (Economic Review) ২০২৪ UJS App.pdf
বাংলাদেশ অর্থনৈতিক সমীক্ষা (Economic Review) ২০২৪ UJS App.pdf
 
How to Add Chatter in the odoo 17 ERP Module
How to Add Chatter in the odoo 17 ERP ModuleHow to Add Chatter in the odoo 17 ERP Module
How to Add Chatter in the odoo 17 ERP Module
 
The simplified electron and muon model, Oscillating Spacetime: The Foundation...
The simplified electron and muon model, Oscillating Spacetime: The Foundation...The simplified electron and muon model, Oscillating Spacetime: The Foundation...
The simplified electron and muon model, Oscillating Spacetime: The Foundation...
 
World environment day ppt For 5 June 2024
World environment day ppt For 5 June 2024World environment day ppt For 5 June 2024
World environment day ppt For 5 June 2024
 
South African Journal of Science: Writing with integrity workshop (2024)
South African Journal of Science: Writing with integrity workshop (2024)South African Journal of Science: Writing with integrity workshop (2024)
South African Journal of Science: Writing with integrity workshop (2024)
 
Introduction to AI for Nonprofits with Tapp Network
Introduction to AI for Nonprofits with Tapp NetworkIntroduction to AI for Nonprofits with Tapp Network
Introduction to AI for Nonprofits with Tapp Network
 
PIMS Job Advertisement 2024.pdf Islamabad
PIMS Job Advertisement 2024.pdf IslamabadPIMS Job Advertisement 2024.pdf Islamabad
PIMS Job Advertisement 2024.pdf Islamabad
 
Hindi varnamala | hindi alphabet PPT.pdf
Hindi varnamala | hindi alphabet PPT.pdfHindi varnamala | hindi alphabet PPT.pdf
Hindi varnamala | hindi alphabet PPT.pdf
 
BÀI TẬP BỔ TRỢ TIẾNG ANH 8 CẢ NĂM - GLOBAL SUCCESS - NĂM HỌC 2023-2024 (CÓ FI...
BÀI TẬP BỔ TRỢ TIẾNG ANH 8 CẢ NĂM - GLOBAL SUCCESS - NĂM HỌC 2023-2024 (CÓ FI...BÀI TẬP BỔ TRỢ TIẾNG ANH 8 CẢ NĂM - GLOBAL SUCCESS - NĂM HỌC 2023-2024 (CÓ FI...
BÀI TẬP BỔ TRỢ TIẾNG ANH 8 CẢ NĂM - GLOBAL SUCCESS - NĂM HỌC 2023-2024 (CÓ FI...
 
A Survey of Techniques for Maximizing LLM Performance.pptx
A Survey of Techniques for Maximizing LLM Performance.pptxA Survey of Techniques for Maximizing LLM Performance.pptx
A Survey of Techniques for Maximizing LLM Performance.pptx
 

Stanley_Exp22_Excel_Ch03_ML1_Airports.xlsxPassengerTop 6 Unite.docx

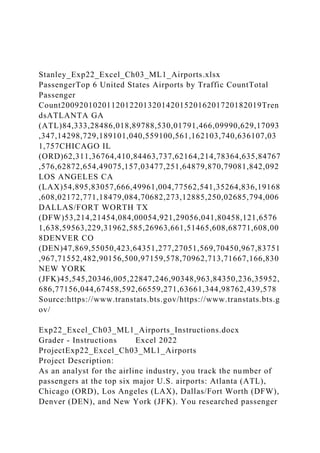
  • 1. Stanley_Exp22_Excel_Ch03_ML1_Airports.xlsx PassengerTop 6 United States Airports by Traffic CountTotal Passenger Count20092010201120122013201420152016201720182019Tren dsATLANTA GA (ATL)84,333,28486,018,89788,530,01791,466,09990,629,17093 ,347,14298,729,189101,040,559100,561,162103,740,636107,03 1,757CHICAGO IL (ORD)62,311,36764,410,84463,737,62164,214,78364,635,84767 ,576,62872,654,49075,157,03477,251,64879,870,79081,842,092 LOS ANGELES CA (LAX)54,895,83057,666,49961,004,77562,541,35264,836,19168 ,608,02172,771,18479,084,70682,273,12885,250,02685,794,006 DALLAS/FORT WORTH TX (DFW)53,214,21454,084,00054,921,29056,041,80458,121,6576 1,638,59563,229,31962,585,26963,661,51465,608,68771,608,00 8DENVER CO (DEN)47,869,55050,423,64351,277,27051,569,70450,967,83751 ,967,71552,482,90156,500,97159,578,70962,713,71667,166,830 NEW YORK (JFK)45,545,20346,005,22847,246,90348,963,84350,236,35952, 686,77156,044,67458,592,66559,271,63661,344,98762,439,578 Source:https://www.transtats.bts.gov/https://www.transtats.bts.g ov/ Exp22_Excel_Ch03_ML1_Airports_Instructions.docx Grader - Instructions Excel 2022 ProjectExp22_Excel_Ch03_ML1_Airports Project Description: As an analyst for the airline industry, you track the number of passengers at the top six major U.S. airports: Atlanta (ATL), Chicago (ORD), Los Angeles (LAX), Dallas/Fort Worth (DFW), Denver (DEN), and New York (JFK). You researched passenger
  • 2. data and created a worksheet that lists the number of total yearly passengers. You will create a clustered column chart to compare the number of passengers at each airport. Then, you will create a line chart that compares trends over time. Next, you will create a bar chart to compare the passenger count for the latest year of data available and emphasize the airport with the largest number of passenger traffic. Finally, you will insert sparklines to visually represent trends in passengers at each airport over the ten-year period. Steps to Perform: Step Instructions Points Possible 1 Start Excel. Download and open the file named Exp22_Excel_Ch03_ML1_Airports.xlsx. Grader has automatically added your last name to the beginning of the filename. 0 2 You want to create a clustered column chart to depict the passenger counts at the six airports over several years. Create a clustered column chart for the range A4:L10. Cut the chart and paste it in cell A15. 5 3 You want to customize the column chart with a chart title, display the years as a data series, enlarge the chart to be easier to read, and apply a chart style. •Type Passengers Counts at Top U.S. Airports as
  • 3. the chart title. •Swap the data on the category axis and in the legend. •Set a 3.5" height and 11.4" width. •Apply the Style 7 chart style. 10 4 The value axis takes up a lot of space for the numbers. You will adjust the value axis to simplify it. •Change the display units to Millions for the value axis. •Edit the axis title to display Millions of Passengers. 5 5 You want to focus on the 2019 data series by adding data labels. Display data labels above the columns (Outside End position) for the 2019 data series only. 5 6 Applying a fill color to the chart area will make the chart visually appealing. Apply the Light Gradient – Accent 1 gradient fill to the chart area. 3 7 A best practice is to add Alt Text to a chart for accessibility compliance.
  • 4. Add Alt Text: The column chart displays the number of passengers. (including the period). 5 8 You want to create a bar chart to display passenger counts for only one year. Create a clustered bar chart for the range A5:A10 and L5:L10 and move the chart to a chart sheet named Bar Chart. 5 9 You want to customize the bar chart. •Change the chart color to Monochromatic Palette 5. •Enter Passengers at Top 6 U.S. Airports in 2019 as the chart title. •Apply the Style 5 chart style. •Add Alt Text: Atlanta had the most passengers. (including the period). 10 10 Modifying the axes will improve readability of the bar chart. •Change the font size to 10 for the category axis and value axis. •Change the value axis Maximum Bound to 1.1E8.
  • 5. 5 11 You will format a data point so that it stands out and then add gridlines to enhance readability in the bar chart. •Format the Atlanta data point with Dark Blue fill color. •Add Primary Minor Vertical gridlines. 5 12 A line chart effectively shows trends over time for the passenger counts at the different airports. Create a line chart using the range A4:L10 in the Passenger worksheet and move the chart to a chart sheet named Line Chart. Add a chart title Passengers at U.S. Airports and bold the title. 8 13 You want to customize the line chart. •Set the Minimum Bound to 4.0E7 for the value axis and set the Maximum Bound to 1.1E8. •Set the Vertical (Value) Axis Display units to Millions. Delete the Vertical (Value) Axis Display Units Label from the upper- left corner of the chart. Add a value axis title In Millions. •Change the font size to 10 for the value axis and category axis. •Move the legend to the top. •Open the Select Data source dialog box and deselect the check boxes for the even-numbered years. (On a Mac, change the
  • 6. Chart data range by selecting these ranges: A4:B10,D4:D10,F4:F10,H4:H10,J4:J10,L4:L10 since the dialog box does not contain check boxes to deselect the years.) •Add Alt Text: The line chart displays trends for top six U.S. airports. (including the period). 14 14 Sparklines provide a simple visualization to represent data in a worksheet. Display the Passenger worksheet and insert Line sparklines in the range M5:M10 to illustrate the data in the range B5:L10. 8 15 You want to customize the sparklines to point out high and low points. •Show the high and low points in each sparkline. •Apply Black, Text 1 color to the high point marker in each sparkline. 6 16 Set page formats for the Passenger worksheet. Select Legal paper size, select Landscape orientation, set 0.3" left and right margins, and scale to fit 1 page. 6 17
  • 7. Save and close Exp22_Excel_Ch03_ML1_Airports.xlsx. Exit Excel. Submit the file as directed. 0 Total Points 100 Created On: 01/27/2022 1 Exp22_Excel_Ch03_ML1_Airports 1.0 Exp22_Excel_Ch03_ML1_Airports_final_result.jpg Stanley_Exp22_Excel_Ch03_ML2_Grades.xlsx GradesGrade BookCourse:ACC 200 Financial AccountingProfessor:Dr. Dae JeongSection:101Passing Score:70NameTest 1Test 2Final ExamAttendance RecordFinal AverageLetter GradeTrendAcosta9084889587.3BBartley8488908587.3BBasque z7870728573.3CChipman8488808084.0BEthington6064626062. 0DIsham8274829079.3CLeung8690808085.3BMcDonald706662 6066.0DMellor7476808076.7CMusmeaux8690848086.7BNoakes 7478848578.7CNuvek82787410078.0CO'Hair5652605056.0FPad illa7485889082.3BPryciaszek7884749078.7CQuinn9290949092. 0ARodarte8276868081.3BSager5064687560.7DSmith545048755 0.7FStanworth6862748068.0DStuberg98961009598.0ATakahash i86889410089.3BThomas7874749075.3CUribe961001009598.7 AWalton7276747074.0CYarnail6455606559.7DGrading ScaleFinal Grade DistributionBreakpointLetterGrade# Students0FA359.5DB869.5CC879.5BD589.5AF2 Exp22_Excel_Ch03_ML2_Grades_Instructions.docx Grader - Instructions Excel 2022 ProjectExp22_Excel_Ch03_ML2_Grades Project Description:
  • 8. As Dr. Dae Jeong’s teaching assistant, you maintain their gradebook for the ACC 200 Financial Accounting class. Dr. Jeong wants you to create a pie chart that shows the percentage of students who earn each letter grade. You will also create a bar chart to show a sample of the students’ test scores. Furthermore, Dr. Jeong wants to see if a correlation exists between attendance and students’ final grades; therefore, you will create a scatter chart depicting each student’s percentage of attendance with their respective final grade average. Steps to Perform: Step Instructions Points Possible 1 Start Excel. Download and open the file named Exp22_Excel_Ch03_ML2_Grades.xlsx. Grader has automatically added your last name to the beginning of the filename. 0 2 A pie chart is an effective way to visually illustrate the percentage of the class that earned A, B, C, D, and F grades. Use the Insert tab to create a pie chart from the Final Grade Distribution data located below the student data in the range F35:G39 and move the pie chart to its own sheet named Distribution. 10 3 You should enter a chart title to describe the purpose of the chart. You will customize the pie chart to focus on particular slices.
  • 9. •Apply the Style 12 chart style. •Type ACC 200 Final Grades: Fall 2024 for the chart title. •Explode the A grade slice by 7%. •Change the F grade slice to Dark Red. •Remove the legend. 8 4 A best practice is to add Alt Text for accessibility compliance. Add Alt Text: Most students earned B and C grades. (including the period). 2 5 You want to add data labels to indicate the category and percentage of the class that earned each letter grade. Add data labels in the Inside End position. Select data label options to display Percentage and Category Name. Remove the Values data labels. 3 6 Apply 18-pt size and apply Black, Text 1 font color to the data labels. 1 7 You want to create a bar chart to depict grades for a sample of the students in the class. Create a clustered bar chart using the ranges A5:D5 and A18:D23 in the Grades worksheet. Move the bar chart to its own
  • 10. sheet named Sample Scores. 10 8 Customize the bar chart with these specifications: · Style 5 chart style · Legend on the right side in 11 pt font size · Light Gradient - Accent 2 fill color for the plot area 4 9 The chart needs a descriptive title. Type Sample Student Test Scores for the chart title. 1 10 Displaying the exact scores would help clarify the data in the chart. Add data labels in the Outside End position for all data series. Format the Final Exam data series with Blue-Gray, Text 2 fill color. 4 11 The student names display in reverse alphabetical order on the category axis. You want to display the names in alphabetical order, format the axis, and add Alt Text. Select the category axis and display the categories in reverse order in the Format Axis task pane so that
  • 11. O’Hair is listed at the top and Sager is listed at the bottom of the bar chart. Select the category axis and change the font size to 12. Add Alt Text: Quinn earned the highest scores on all tests. (including the period). 4 12 You want to create a scatter chart to see if the combination of attendance and final averages are related. Display the Grades worksheet. Select the range E5:F31 and create a scatter chart. Cut the chart and paste it in cell A42. Set a height of 5.96" and a width of 5.5". 10 13 Add Alt Text: The scatter chart shows the relationship between final grades and attendance. (including the period). 4 14 Titles will help people understand what is being plotted in the horizontal and vertical axes, as well as the overall chart purpose. Make sure the scatter chart is selected. Type Final Average-Attendance Relationship as the chart title and bold the title. Type
  • 12. Percentage of Attendance as the primary horizontal axis title, and type Student Final Averages as the primary vertical axis title. 6 15 To distinguish the points better, you can start the plotting at 40 rather than 0. Make sure the scatter chart is selected. Apply these settings to the vertical axis of the scatter chart: 40 minimum bound, 100 maximum bound, 10 major units, and Number format with 0 decimal places. 8 16 Make sure the scatter chart is selected. Apply these settings to the horizontal axis: 40 minimum bound, 100 maximum bound, automatic units. 4 17 Adding a fill to the plot area will add a touch of color to the chart. Make sure the scatter chart is selected. Add the Parchment texture fill to the plot area. 4 18 You want to insert a trendline to determine trends.
  • 13. Make sure the scatter chart is selected and insert a linear trendline chart element. 4 19 You want to add sparklines to detect trends for each student. Insert Column sparklines in the range H5:H31 using data in the range B6:D31 on the Grades sheet. Display the Low Point. Set the Vertical Axis Minimum and Maximum Values to be the same for all sparklines. 10 20 To make the Sparklines more effective and easier to read, you will increase the row height. Change the row height to 22 for rows 6 through 31. 3 21 Save and close Exp22_Excel_Ch03_ML2_Grades.xlsx. Exit Excel. Submit the file as directed. 0 Total Points 100 Created On: 06/20/2022 1 Exp22_Excel_Ch03_ML2 - Grades 1.0 Exp22_Excel_Ch03_ML2_Grades_final_result.jpg