The document summarizes key points from the Department of Labor's monthly employment report:
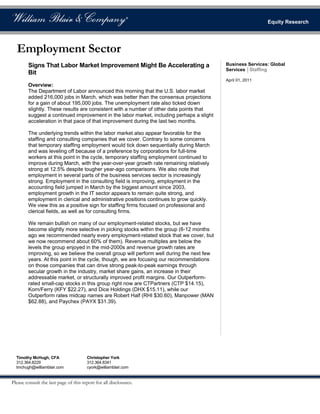
- The U.S. labor market added 216,000 jobs in March, exceeding estimates. The unemployment rate declined slightly to 8.8%.
- Excluding government and temporary jobs, private sector employment increased about 201,000 in March, the second straight month exceeding 200,000.
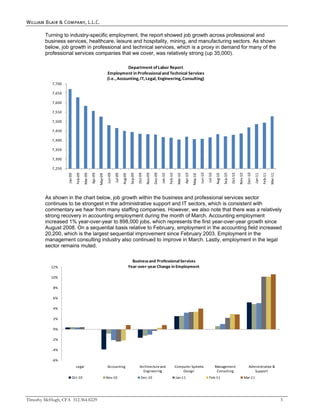
- Employment growth was strongest in professional and business services, healthcare, leisure/hospitality, mining and manufacturing. Professional/technical services employment rose 35,000.


![Q1 2010+Meos+Research+Report[1]](https://cdn.slidesharecdn.com/ss_thumbnails/q110meosresearchreport1-12609845197608-phpapp02-thumbnail.jpg?width=640&height=640&fit=bounds)


