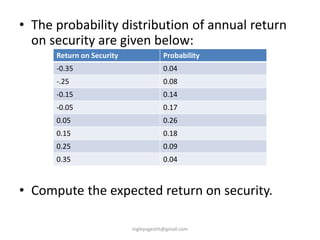
SRBS lecture 2
•Download as PPTX, PDF•
0 likes•136 views

The document contains information about returns and probabilities for different securities (A, B, C, D, E). It calculates the expected returns for A and B, which are both 8%. The risk (standard deviation) is lower for A at 1.14 than for B at 2.19. It recommends investing in security C, which has the highest return of 12% and moderate risk of 5%. For a portfolio with 75% in A and 25% in C, the expected return is 9% but the risk is higher at 6%; therefore, it recommends investing solely in E, which has the same return of 9% but lower risk.
Report
Share
Report
Share

Recommended
NONG SHIM-004370-Algorithm Investment Report
This document provides financial and stock performance data for a company over several years and quarters. It also includes the company's industry, ranking, and scores predicting the probability of its stock price increasing or decreasing. Several purchase strategies are suggested based on the company's current and predicted stock prices. Compliance information at the bottom indicates this is an analysis for investment reference purposes only.
KOLMAR HOLDINGS 024720-Algorithm Investment Report
This document contains performance data for an algorithm company over several periods from 2014-2018. It includes key financial metrics such as sales, operating profit, net income, operating rate, net rate, ROE, debt ratio, and EPS. It also provides the algorithm company's stock price and evaluation over time, with buy/sell recommendations based on the indication price compared to the current stock price. The document analyzes the company's performance, stock price probability, and provides a suggested purchase amount and number of stocks to buy.
Trabajo ángel 3.
Los poliedros son cuerpos geométricos con caras planas y aristas rectas, como los cubos o los prisma. Los cuerpos redondos tienen superficies curvas y no tienen caras ni aristas, como las esferas o las bolas. Ambos tipos de cuerpos se estudian en geometría para comprender mejor las formas y volúmenes en el espacio tridimensional.
India's etailers battle it out in game of thrones
India's major e-tailers like Amazon, Flipkart, and Snapdeal are disunited in their efforts to lobby the Indian government against new regulations that favor brick-and-mortar retailers. While the offline retailers actively lobby as a united group, the online retailers refuse to sign joint petitions or mount united legal challenges. This disunity stems from the competitive tensions between the companies and prevents them from effectively countering the threats posed by the united offline retailers' group. Unless the major e-tailers find a way to put aside their differences and form a united front, they will continue to struggle against the regulations in an increasingly difficult environment.
Bullying
Bullying involves forcing someone to do something against their will through threats or intimidation. It is often caused by a lack of attention, wanting to feel powerful, or observing violence at home. The effects of bullying include depression, anxiety, poor school performance, and sleep issues. To prevent bullying, we should stand up for others, treat everyone with respect, and protect ourselves online.
SAPM lecture 1
This document discusses security analysis and portfolio management. It covers measuring the risk and return of investments using variance, standard deviation, and beta. Standard deviation measures the risk of a security or portfolio based on the variability of its returns from the mean. Beta measures the performance of a security or portfolio compared to the overall market. The document provides an example calculating standard deviation to compare the risk of a portfolio to the overall stock market index. It finds the portfolio had a higher average return but also higher risk compared to the index. Finally, it discusses using beta to measure how volatile a security's returns are compared to the Nifty index.
SAPM lecture 3 Capital Asset Pricing Model
The document discusses the Capital Asset Pricing Model (CAPM) and how it relates expected return to risk through beta. It provides the formula for CAPM and explains how to calculate beta and expected returns for securities. Examples are given to demonstrate calculating betas and expected returns for companies using historical return data and CAPM. The model can be used to determine if securities are overvalued or undervalued relative to their expected returns given the market risk and risk-free rate.
CAPM and APT-7.pptx
The document discusses the Capital Asset Pricing Model (CAPM) and Arbitrage Pricing Theory (APT). It provides the key equations of CAPM, including how it relates expected return to risk-free rate, beta, and market risk premium. It also discusses how the Security Market Line graphs this relationship and can be used to calculate expected returns and alpha. The document then introduces APT and describes its key assumptions around arbitrage and how mispricing can create riskless profit opportunities through arbitrage portfolios.
ICICI Prudential Quant Fund
Know more on the benefits of investing in ICICI Prudential Quant Fund:
● Limited Human Intervention to avoid any biases.
● Diversification across various sectors, styles and businesses.
● Systematic approach of investing by combining investing experience and avoiding human error.
● Passive Investing through a model using a combination of factors.
● Team with prior experience in managing quantitative models for asset allocation.
Remuneration Presentation AGM 2018
The document provides an annual remuneration report for AMG Advanced Metallurgical Group N.V.'s management board. It reviews AMG's compensation system, including base salary, annual bonuses based on ROCE, operating cash flow and personal targets, and long-term stock options and performance share units. It discusses AMG's strong financial performance in 2017, leading to high bonus payouts and growth in market capitalization. Peer comparisons found AMG's pay to be aligned with top quartile shareholder returns.
Investment Settings
This document provides an overview of key concepts in investment analysis and portfolio management. It discusses what constitutes an investment, factors that influence required rates of return such as time value of money, inflation, and risk. It also covers measures of historical and expected rates of return, risk of expected returns using variance and standard deviation, and the three determinants of required rates of return - the real risk-free rate, expected inflation, and risk premium.
Unit IV Risk Return Analysis bjbiuybjiuy
The document discusses various types of risk that can impact investments. It defines risk as the variability between expected and actual returns. Some key risks mentioned include market risk, liquidity risk, credit risk, operational risk, currency risk, and country risk. It provides examples of different types of financial risks like market risk, foreign exchange risk, and country risk. It also distinguishes between systematic risk, which stems from external market factors, and unsystematic risk, which is specific to a particular security. The document includes examples of how to calculate expected returns, variance, and standard deviation as measures of risk.
project risk analysis
The document discusses various techniques for risk analysis in project finance, including sensitivity analysis, scenario analysis, break-even analysis, and simulation analysis. It defines key risk analysis terms and provides examples of calculating expected net present value and standard deviation of NPV using the Hiller model under both uncorrelated and perfectly correlated cash flows. Simulation analysis involves modeling the relationship between variable factors and NPV, specifying probability distributions, running simulations to obtain multiple NPV outcomes, and analyzing the results. Project selection under risk may involve judgmental evaluation, payback period requirements, or risk-adjusted discount rates.
300114-Return On Investment Infographics.pptx
The document is an infographic about return on investment (ROI). It includes definitions and formulas for calculating ROI. Some key points:
- ROI measures profitability of an investment or compares effectiveness of different investments. It is calculated as (Gain from Investment - Cost of Investment) / Cost of Investment.
- The infographic outlines the ROI process including planning, data collection/analysis, reporting. It also discusses factors like costs, benefits, and time frame that are considered in ROI calculations.
- Various methods of calculating ROI are presented for different contexts like marketing, websites, and social media. ROI metrics for different channels and industries are also highlighted.
- The four stages of ROI are explained as exposure,
300114-Return On Investment Infographics.pptx
The document is an infographic about return on investment (ROI). It includes definitions and formulas for calculating ROI. Some key points:
- ROI measures profitability of an investment or compares effectiveness of different investments. It is calculated as (Gain from Investment - Cost of Investment) / Cost of Investment.
- The infographic outlines the ROI process including planning, data collection/analysis, reporting. It also discusses factors like costs, benefits, and time frame that are considered in ROI calculations.
- Various methods for calculating ROI for different contexts are presented, like marketing ROI, website ROI, and social media ROI. Metrics for each are also provided.
- The four stages of typical ROI models - exposure,
300114-Return On Investment Infographics.pptx
This document discusses return on investment (ROI) and provides various infographics and examples related to ROI calculation and measurement. Some key points include:
- ROI is calculated as (Gain from Investment - Cost of Investment) / Cost of Investment. It measures the profitability of an investment.
- There are various ways to measure ROI across different contexts such as marketing campaigns, websites, social media, etc. Metrics include clicks, leads, sales, audience reach, etc.
- ROI analysis involves defining goals, integrating channels, using the right tools, and measuring across multiple waves to understand the full life cycle value.
- Infographics provide examples of ROI calculations for various actions and investments, as well as models
sliver river mfg slide
This document presents a case study on Silver River Manufacturing Company. It includes an introduction to the company and issues it is facing. Financial statements and ratios for 2018-2020 are analyzed. Key issues identified are declining sales and poor financial ratios. The DuPont analysis and Altman Z-score are calculated to further assess the company's financial strength and weaknesses. Projections for 2021-2022 income statements are also provided.
EFN Percent of sales method = SAS ▲S + ▲FA - SLS ▲S - ▲RE .docx
EFN Percent of sales method = SA/S ▲S + ▲FA - SL/S ▲S - ▲RE +/- Misc.
▲RE = (S + ▲S)(PM)(1 - PO)
D/A: Debt to asset ratio (EFN + (SL/S)▲S)/((SA/S)▲S + ▲FA)
Sustainable Growth: ▲S = (▲FA(1 - D/A) - S(PM)(1 - PO))/((SA/S)(D/A - 1) + (PM)(1 - PO))
Instructions: You must complete and hand-in this exam as a word document. Type your answers where appropriate in essays and problems. In the multiple choice questions, highlight your answer.
Part 1: Multiple Choice Questions. Please select the best answer of those provided. Mark your answers by highlighting the correct response. Each question is worth 2 points.
1. Suppose that a company has a profit margin of 5%, an ROA of 12.5% and an ROE of 37.5%. What are this company’s asset turnover and equity multiplier ratios, respectively? They are:
a. 2.5 and 3.0
b. 6 and 0.667
c. 3 and 2
d. 5% and 12.5%
e. None of the above
2. A company has an ROE of 12% and an equity multiplier of 3. What is its ROA? It is:
a. 4%
b. 12%
c. 36%
d. There is insufficient information to compute this number
e. None of the above
3. Which of the following ratios does not measure the quality of liquidity?
a. Current Ratio
b. Ratio of Inventory to Working Capital
c. Ratio of Receivables to Working Capital.
d. None of the above.
4. Leverage magnifies the bottom line. So in a good year, debt can magnify (increase) a company’s positive net income.
a. True
b. False
5. If a company’s inventory to working capital increased, but its total current assets and current liabilities did not change, its quality of liquidity would…..
a. increase
b. decrease
c. not change
6. Suppose that a company has a debt to asset ratio of 75%. Its debt to equity ratio would be:
a. 75%
b. 25%
c. 300%
d. 750%
e. None of the above
7. If interest rates increase, then a company’s times interest earned ratio would most likely…… (You may assume the company has borrowed a significant amount of both long and short-term debt).
a. increase
b. decrease
c. not change
8. If inventory turnover decreases in a year in which sales and cost of goods sold have not changed, then we can assume that inventory has…….
a. increased
b. decreased
c. not changed
9. When we test the importance of an assumption that we have made in a forecast, this action is called:
a. The first pass forecast
b. Spontaneous assets
c. Sensitivity analysis
d. Long range strategy
e. None of the above
10. Budgets tend to be relatively short-term in their scope while forecasts tend to be somewhat longer-term oriented.
a. True
b. False
11.Forecasts then to be more concerned with details than budgets>
a. True
b. False
12. The company will need to raise funds to finance its growth when EFN is:
a. positive
b. negative
c. zero
d. larger than ΔFA
e. none of the above
13. The EFN model ignores depreciation entirely.
...
HCS 385 RANK Introduction Education--hcs385rank.com
This document provides information and assignments for an HCS 385 healthcare finance class, including:
- Weekly assignments such as terminology exercises, financial analyses, ratio calculations, budgeting, and capital investment papers.
- Sample financial documents like income statements, balance sheets, and cash flow analyses for healthcare organizations.
- Instructions and templates for assignments involving topics like forecasting, inventory management, outsourcing, return on investment, and stakeholder analysis in healthcare.
The document outlines assignments, tutorials, and resources to help students learn key concepts in healthcare finance and financial management.
HCS 385 RANK Inspiring Innovation--hcs385rank.com
This document provides information and assignments for an HCS 385 healthcare finance class, including:
- Weekly assignments covering terminology, stakeholders, financial exercises, ratio analysis, capital investment decisions, and financial performance.
- Details for each assignment, including requirements to complete spreadsheets, write papers analyzing financial ratios and capital investments, and presentations on capital management.
- Links to download assignment files and instructions for submitting completed work.
The document outlines the various financial concepts and assignments students must complete to pass the HCS 385 healthcare finance course.
Under Armour_Security Analysis
This document analyzes the security of an investment in Under Armour. It provides financial highlights and ratios for 2013-2016 and projections through 2020. Key points include high debt/equity ratios that pose financial risk, increasing assets but decreasing asset turnover, and recommendations to hold the stock with a price target of $30.63 based on discounted cash flow valuation. Risks discussed are related to finances, markets, and operations.
HCS 385 Exceptional Education - snaptutorial.com
For more classes visit
www.snaptutorial.com
This Tutorial contains 2 Set of Papers for each Assignment Except HCS 385 Assignment Week 1 Terminology and Stakeholders (2 Set)
HCS 385 Assignment Week 2 Financial Exercise
HCS 385 RANK Inspiring Innovation--hcs385rank.com
This document provides information about assignments for the HCS 385 health care finance course, including assignment descriptions, learning objectives, and submission requirements. It includes assignments on terminology, stakeholders, financial exercises, ratio analysis, capital budgeting, and presentations. Students must complete various papers, worksheets, and exercises on topics like financial ratios, break-even analysis, time value of money, and capital investment decisions to demonstrate their understanding of key health care finance concepts.
Seller Evaluation PowerPoint Presentation Slides
Seller Evaluation PowerPoint Presentation Slides are designed to showcase the process of assessing and approving potential suppliers. The financial status of the seller should be carefully evaluated. The vendor evaluation PowerPoint complete deck includes content ready slides such as vendor assessment executive summary, vendor evacuation process, vendor quality evaluation, vendor audit checklist, risk assessment checklist, vendor risk assessment matrix, rating and certification, scorecard evaluation comparison, supplier performance management scorecard and more. It also contains additional predesigned templates our goal, comparison, Venn diagram timeline, about us, quotes, post it, puzzle, area chart, etc, where you can add and change data. Present the vendor rating criteria quality delivery service and price. Monitor performance and set improvement task using this vendor management PPT slides. Demonstrate a step by step process of vendor selection. Check out the supplier’s capabilities against your needs. Download seller audit presentation graphics for vendor evaluation and selection. Folks come forward to back your cause due to our Seller Evaluation Powerpoint Presentation Slides. It helps attract allies.
HCS 385 RANK Education Planning--hcs385rank.com
This document provides information on assignments for the HCS 385 health care finance course, including assignment descriptions, learning objectives, and submission requirements. Assignments cover topics such as financial terminology, capital investment decisions, budgeting, ratio analysis, break-even analysis, time value of money calculations, and working capital and capital project evaluation. Students must complete various exercises and write papers analyzing organizational financial performance and health care payment system trends. Papers and presentations are to be formatted according to APA style guidelines and include citations from peer-reviewed sources.
Camels framework
This document discusses various metrics used to evaluate the capital adequacy, asset quality, management efficiency, earnings quality, and liquidity of banks. It defines the capital adequacy ratio and its components like tier 1, 2, and 3 capital and risk weighted assets. It also covers other ratios like debt-equity, advances to assets, government securities to investments, gross NPAs to advances, investments to assets, business and profit per employee, credit deposit ratio, return on assets, net interest margin, liquid assets to deposits and demand deposits. All these metrics are used by regulators to evaluate the financial health and riskiness of commercial banks.
Camels framework
It is Rating system, rates on a scale of one to five, with one being the highest and five being the lowest
More Related Content
Similar to SRBS lecture 2
SAPM lecture 1
This document discusses security analysis and portfolio management. It covers measuring the risk and return of investments using variance, standard deviation, and beta. Standard deviation measures the risk of a security or portfolio based on the variability of its returns from the mean. Beta measures the performance of a security or portfolio compared to the overall market. The document provides an example calculating standard deviation to compare the risk of a portfolio to the overall stock market index. It finds the portfolio had a higher average return but also higher risk compared to the index. Finally, it discusses using beta to measure how volatile a security's returns are compared to the Nifty index.
SAPM lecture 3 Capital Asset Pricing Model
The document discusses the Capital Asset Pricing Model (CAPM) and how it relates expected return to risk through beta. It provides the formula for CAPM and explains how to calculate beta and expected returns for securities. Examples are given to demonstrate calculating betas and expected returns for companies using historical return data and CAPM. The model can be used to determine if securities are overvalued or undervalued relative to their expected returns given the market risk and risk-free rate.
CAPM and APT-7.pptx
The document discusses the Capital Asset Pricing Model (CAPM) and Arbitrage Pricing Theory (APT). It provides the key equations of CAPM, including how it relates expected return to risk-free rate, beta, and market risk premium. It also discusses how the Security Market Line graphs this relationship and can be used to calculate expected returns and alpha. The document then introduces APT and describes its key assumptions around arbitrage and how mispricing can create riskless profit opportunities through arbitrage portfolios.
ICICI Prudential Quant Fund
Know more on the benefits of investing in ICICI Prudential Quant Fund:
● Limited Human Intervention to avoid any biases.
● Diversification across various sectors, styles and businesses.
● Systematic approach of investing by combining investing experience and avoiding human error.
● Passive Investing through a model using a combination of factors.
● Team with prior experience in managing quantitative models for asset allocation.
Remuneration Presentation AGM 2018
The document provides an annual remuneration report for AMG Advanced Metallurgical Group N.V.'s management board. It reviews AMG's compensation system, including base salary, annual bonuses based on ROCE, operating cash flow and personal targets, and long-term stock options and performance share units. It discusses AMG's strong financial performance in 2017, leading to high bonus payouts and growth in market capitalization. Peer comparisons found AMG's pay to be aligned with top quartile shareholder returns.
Investment Settings
This document provides an overview of key concepts in investment analysis and portfolio management. It discusses what constitutes an investment, factors that influence required rates of return such as time value of money, inflation, and risk. It also covers measures of historical and expected rates of return, risk of expected returns using variance and standard deviation, and the three determinants of required rates of return - the real risk-free rate, expected inflation, and risk premium.
Unit IV Risk Return Analysis bjbiuybjiuy
The document discusses various types of risk that can impact investments. It defines risk as the variability between expected and actual returns. Some key risks mentioned include market risk, liquidity risk, credit risk, operational risk, currency risk, and country risk. It provides examples of different types of financial risks like market risk, foreign exchange risk, and country risk. It also distinguishes between systematic risk, which stems from external market factors, and unsystematic risk, which is specific to a particular security. The document includes examples of how to calculate expected returns, variance, and standard deviation as measures of risk.
project risk analysis
The document discusses various techniques for risk analysis in project finance, including sensitivity analysis, scenario analysis, break-even analysis, and simulation analysis. It defines key risk analysis terms and provides examples of calculating expected net present value and standard deviation of NPV using the Hiller model under both uncorrelated and perfectly correlated cash flows. Simulation analysis involves modeling the relationship between variable factors and NPV, specifying probability distributions, running simulations to obtain multiple NPV outcomes, and analyzing the results. Project selection under risk may involve judgmental evaluation, payback period requirements, or risk-adjusted discount rates.
300114-Return On Investment Infographics.pptx
The document is an infographic about return on investment (ROI). It includes definitions and formulas for calculating ROI. Some key points:
- ROI measures profitability of an investment or compares effectiveness of different investments. It is calculated as (Gain from Investment - Cost of Investment) / Cost of Investment.
- The infographic outlines the ROI process including planning, data collection/analysis, reporting. It also discusses factors like costs, benefits, and time frame that are considered in ROI calculations.
- Various methods of calculating ROI are presented for different contexts like marketing, websites, and social media. ROI metrics for different channels and industries are also highlighted.
- The four stages of ROI are explained as exposure,
300114-Return On Investment Infographics.pptx
The document is an infographic about return on investment (ROI). It includes definitions and formulas for calculating ROI. Some key points:
- ROI measures profitability of an investment or compares effectiveness of different investments. It is calculated as (Gain from Investment - Cost of Investment) / Cost of Investment.
- The infographic outlines the ROI process including planning, data collection/analysis, reporting. It also discusses factors like costs, benefits, and time frame that are considered in ROI calculations.
- Various methods for calculating ROI for different contexts are presented, like marketing ROI, website ROI, and social media ROI. Metrics for each are also provided.
- The four stages of typical ROI models - exposure,
300114-Return On Investment Infographics.pptx
This document discusses return on investment (ROI) and provides various infographics and examples related to ROI calculation and measurement. Some key points include:
- ROI is calculated as (Gain from Investment - Cost of Investment) / Cost of Investment. It measures the profitability of an investment.
- There are various ways to measure ROI across different contexts such as marketing campaigns, websites, social media, etc. Metrics include clicks, leads, sales, audience reach, etc.
- ROI analysis involves defining goals, integrating channels, using the right tools, and measuring across multiple waves to understand the full life cycle value.
- Infographics provide examples of ROI calculations for various actions and investments, as well as models
sliver river mfg slide
This document presents a case study on Silver River Manufacturing Company. It includes an introduction to the company and issues it is facing. Financial statements and ratios for 2018-2020 are analyzed. Key issues identified are declining sales and poor financial ratios. The DuPont analysis and Altman Z-score are calculated to further assess the company's financial strength and weaknesses. Projections for 2021-2022 income statements are also provided.
EFN Percent of sales method = SAS ▲S + ▲FA - SLS ▲S - ▲RE .docx
EFN Percent of sales method = SA/S ▲S + ▲FA - SL/S ▲S - ▲RE +/- Misc.
▲RE = (S + ▲S)(PM)(1 - PO)
D/A: Debt to asset ratio (EFN + (SL/S)▲S)/((SA/S)▲S + ▲FA)
Sustainable Growth: ▲S = (▲FA(1 - D/A) - S(PM)(1 - PO))/((SA/S)(D/A - 1) + (PM)(1 - PO))
Instructions: You must complete and hand-in this exam as a word document. Type your answers where appropriate in essays and problems. In the multiple choice questions, highlight your answer.
Part 1: Multiple Choice Questions. Please select the best answer of those provided. Mark your answers by highlighting the correct response. Each question is worth 2 points.
1. Suppose that a company has a profit margin of 5%, an ROA of 12.5% and an ROE of 37.5%. What are this company’s asset turnover and equity multiplier ratios, respectively? They are:
a. 2.5 and 3.0
b. 6 and 0.667
c. 3 and 2
d. 5% and 12.5%
e. None of the above
2. A company has an ROE of 12% and an equity multiplier of 3. What is its ROA? It is:
a. 4%
b. 12%
c. 36%
d. There is insufficient information to compute this number
e. None of the above
3. Which of the following ratios does not measure the quality of liquidity?
a. Current Ratio
b. Ratio of Inventory to Working Capital
c. Ratio of Receivables to Working Capital.
d. None of the above.
4. Leverage magnifies the bottom line. So in a good year, debt can magnify (increase) a company’s positive net income.
a. True
b. False
5. If a company’s inventory to working capital increased, but its total current assets and current liabilities did not change, its quality of liquidity would…..
a. increase
b. decrease
c. not change
6. Suppose that a company has a debt to asset ratio of 75%. Its debt to equity ratio would be:
a. 75%
b. 25%
c. 300%
d. 750%
e. None of the above
7. If interest rates increase, then a company’s times interest earned ratio would most likely…… (You may assume the company has borrowed a significant amount of both long and short-term debt).
a. increase
b. decrease
c. not change
8. If inventory turnover decreases in a year in which sales and cost of goods sold have not changed, then we can assume that inventory has…….
a. increased
b. decreased
c. not changed
9. When we test the importance of an assumption that we have made in a forecast, this action is called:
a. The first pass forecast
b. Spontaneous assets
c. Sensitivity analysis
d. Long range strategy
e. None of the above
10. Budgets tend to be relatively short-term in their scope while forecasts tend to be somewhat longer-term oriented.
a. True
b. False
11.Forecasts then to be more concerned with details than budgets>
a. True
b. False
12. The company will need to raise funds to finance its growth when EFN is:
a. positive
b. negative
c. zero
d. larger than ΔFA
e. none of the above
13. The EFN model ignores depreciation entirely.
...
HCS 385 RANK Introduction Education--hcs385rank.com
This document provides information and assignments for an HCS 385 healthcare finance class, including:
- Weekly assignments such as terminology exercises, financial analyses, ratio calculations, budgeting, and capital investment papers.
- Sample financial documents like income statements, balance sheets, and cash flow analyses for healthcare organizations.
- Instructions and templates for assignments involving topics like forecasting, inventory management, outsourcing, return on investment, and stakeholder analysis in healthcare.
The document outlines assignments, tutorials, and resources to help students learn key concepts in healthcare finance and financial management.
HCS 385 RANK Inspiring Innovation--hcs385rank.com
This document provides information and assignments for an HCS 385 healthcare finance class, including:
- Weekly assignments covering terminology, stakeholders, financial exercises, ratio analysis, capital investment decisions, and financial performance.
- Details for each assignment, including requirements to complete spreadsheets, write papers analyzing financial ratios and capital investments, and presentations on capital management.
- Links to download assignment files and instructions for submitting completed work.
The document outlines the various financial concepts and assignments students must complete to pass the HCS 385 healthcare finance course.
Under Armour_Security Analysis
This document analyzes the security of an investment in Under Armour. It provides financial highlights and ratios for 2013-2016 and projections through 2020. Key points include high debt/equity ratios that pose financial risk, increasing assets but decreasing asset turnover, and recommendations to hold the stock with a price target of $30.63 based on discounted cash flow valuation. Risks discussed are related to finances, markets, and operations.
HCS 385 Exceptional Education - snaptutorial.com
For more classes visit
www.snaptutorial.com
This Tutorial contains 2 Set of Papers for each Assignment Except HCS 385 Assignment Week 1 Terminology and Stakeholders (2 Set)
HCS 385 Assignment Week 2 Financial Exercise
HCS 385 RANK Inspiring Innovation--hcs385rank.com
This document provides information about assignments for the HCS 385 health care finance course, including assignment descriptions, learning objectives, and submission requirements. It includes assignments on terminology, stakeholders, financial exercises, ratio analysis, capital budgeting, and presentations. Students must complete various papers, worksheets, and exercises on topics like financial ratios, break-even analysis, time value of money, and capital investment decisions to demonstrate their understanding of key health care finance concepts.
Seller Evaluation PowerPoint Presentation Slides
Seller Evaluation PowerPoint Presentation Slides are designed to showcase the process of assessing and approving potential suppliers. The financial status of the seller should be carefully evaluated. The vendor evaluation PowerPoint complete deck includes content ready slides such as vendor assessment executive summary, vendor evacuation process, vendor quality evaluation, vendor audit checklist, risk assessment checklist, vendor risk assessment matrix, rating and certification, scorecard evaluation comparison, supplier performance management scorecard and more. It also contains additional predesigned templates our goal, comparison, Venn diagram timeline, about us, quotes, post it, puzzle, area chart, etc, where you can add and change data. Present the vendor rating criteria quality delivery service and price. Monitor performance and set improvement task using this vendor management PPT slides. Demonstrate a step by step process of vendor selection. Check out the supplier’s capabilities against your needs. Download seller audit presentation graphics for vendor evaluation and selection. Folks come forward to back your cause due to our Seller Evaluation Powerpoint Presentation Slides. It helps attract allies.
HCS 385 RANK Education Planning--hcs385rank.com
This document provides information on assignments for the HCS 385 health care finance course, including assignment descriptions, learning objectives, and submission requirements. Assignments cover topics such as financial terminology, capital investment decisions, budgeting, ratio analysis, break-even analysis, time value of money calculations, and working capital and capital project evaluation. Students must complete various exercises and write papers analyzing organizational financial performance and health care payment system trends. Papers and presentations are to be formatted according to APA style guidelines and include citations from peer-reviewed sources.
Similar to SRBS lecture 2 (20)
EFN Percent of sales method = SAS ▲S + ▲FA - SLS ▲S - ▲RE .docx
EFN Percent of sales method = SAS ▲S + ▲FA - SLS ▲S - ▲RE .docx
HCS 385 RANK Introduction Education--hcs385rank.com
HCS 385 RANK Introduction Education--hcs385rank.com
More from yogesh ingle
Camels framework
This document discusses various metrics used to evaluate the capital adequacy, asset quality, management efficiency, earnings quality, and liquidity of banks. It defines the capital adequacy ratio and its components like tier 1, 2, and 3 capital and risk weighted assets. It also covers other ratios like debt-equity, advances to assets, government securities to investments, gross NPAs to advances, investments to assets, business and profit per employee, credit deposit ratio, return on assets, net interest margin, liquid assets to deposits and demand deposits. All these metrics are used by regulators to evaluate the financial health and riskiness of commercial banks.
Camels framework
It is Rating system, rates on a scale of one to five, with one being the highest and five being the lowest
Commercial banling syllabus
The document outlines the syllabus for a course on commercial banking. It covers 12 topics: introduction to commercial banking; banking operations; banking products; legal aspects of banking; rural banking; study of bank financial statements; IRAC norms/NPA management; risk management in banks; capital adequacy norms; treasury; asset liability management; and the regulatory role of the RBI. The topics include concepts of commercial banking, products and services offered, financial analysis and reporting, risk management techniques, and the role of the central bank.
Career in finance
MMS students have many opportunities in finance sector to do carrier but they have to decide the path in the beginning itself on which they have to walk for lifetime.
Lecture 9 ba 9 r software
This document discusses importing data from CSV files into R and performing calculations and analysis on the data. It covers changing the working directory in R, importing CSV data and assigning column comments, and calculating summary statistics like the mean, median, and standard deviation of columns of data. It also demonstrates creating bar plots, pie charts, histograms and calculating the correlation between variables and fitting a linear regression model.
Lecture 8 ba 8 r software
This document provides examples of basic calculations and functions in R including adding, subtracting, multiplying, and dividing vectors, finding the maximum and minimum values in a vector, calculating the absolute value, square root, sum, product, and round of values. Integer division and exponentiation are also demonstrated using vectors of numbers.
Lecture 6 ba 6 statistics for business analytics
This document analyzes a linear regression model to determine the relationship between miles traveled and time required. It evaluates the fitness of the regression model using hypothesis testing with a 99% confidence level and 1% standard error. The results show a significance F value less than 0.01, providing overwhelming evidence of a linear relationship between miles traveled and time required.
Lecture 5 & 6 ba 5 & 6 statistics for business analytics
This document provides an overview of key concepts in business analytics including central tendencies, measures of dispersion, measures of association, and applications of these statistical techniques. It discusses calculating and interpreting the mean, median, mode, standard deviation, variance, range, geometric mean, covariance and correlation to analyze metrics like employee and product performance, prices, growth rates, risks, and how different variables change together. Central tendencies are used to understand average values while dispersion measures show how spread out the data is. Association tools indicate how two items covary or correlate with one another.
Lecture 4 ba 4 statistics for business analytics
This document discusses statistical concepts including mean, median, mode, variance, and standard deviation. Variance is defined as the difference between an actual value and the mean, while standard deviation measures how far a variable is from the mean with a higher standard deviation indicating higher risk. Standard deviation is commonly represented by the Greek letter sigma or S.
Lecture 3 ba 3 statistics for business analytics
Correlation is a statistical technique used to determine the strength and direction of the relationship between two variables. The coefficient of correlation (r) ranges from +1 to -1, indicating the strength of either a positive or negative relationship, or no relationship if r equals 0. Guidelines are provided to interpret the strength of correlation based on the r value. Correlation is appropriate for examining relationships between quantifiable data but not categorical data, and should not be used alone to determine causation.
Lecture 2 ba 2 statistics for business analytics
Simple linear regression models the relationship between a dependent variable (y) and independent variable (x) using an equation y = (β0 +β1x). It shows whether the relationship is positive, negative, or no relationship based on the slope and position of the regression line graphed between the variables. Simple linear regression is used to forecast future opportunities and risks by predicting values like price, quantity, demand, and supply.
Lecture 1 syllabus ba
This document outlines the content and learning outcomes of a lecture series on business analytics. The series introduces basic analytics concepts and statistics, teaches advanced Excel functions, and focuses on using the R programming language for tasks like decision trees, clustering, time series forecasting, logistic regression, and evaluating predictive models. Students will apply their analytics skills with Excel and R through classroom tests, presentations, and assignments aimed at proficiency in using the software tools for business analytics.
Lecture 1 ba 1 overview
This document outlines a syllabus for a course on business analytics. It covers topics like introduction to analytics, statistics for business analytics, advanced Excel, R, data mining techniques like decision trees and clustering in R, time series forecasting, predictive modeling with logistic regression in R, and an overview of big data and Hadoop. It also defines key concepts like data analysis, data analytics, data mining. Descriptive, predictive, and prescriptive analytics techniques are discussed. Applications of business analytics in various domains like finance, marketing, HR, CRM, manufacturing, and credit cards are provided.
8 foreign direct investment & foreign portfolio investor
Foreign Direct Investment Regulations:
Foreign Direct Investment (FDI) Policy.
SEBI (Foreign Portfolio Investors)
Regulations -2014, SEBI (Alternate
Investment Fund) Regulations – 2012.
7 securities and exchange board of india act,
Securities and Exchange Board of India
(SEBI): Introduction to SEBI Act (1992)
– powers and functions of SEBI.
6 fr rbi act 1934
Reserve Bank of India (RBI)
Functions of RBI, credit control measures,
qualitative credit control and quantitative
credit control, regulatory measures taken
by RBI to facilitate financial inclusion.
5 fema act 1999
The document summarizes the key aspects of the Foreign Exchange Management Act (FEMA) of 1999 in India. It provides definitions of important terms like authorized person, capital account transaction, current account transaction, and foreign exchange. It outlines the chapters of FEMA, including regulation of foreign exchange, authorized persons, contraventions and penalties, adjudication and appeal procedures. The objective of FEMA is to facilitate external trade and payments in foreign exchange in India.
4 irda act 1999
IRDA Act, Salient features of the IRDA
Act, 1999, IRDA (protection of policy
holder interests) Regulations 2002, its
duties, power and functions of authority.
Fmi 9 evolution
Banking in India can be traced back to the Vedic period in 2000-1400 BC, with money lending and deposit-taking occurring. The modern banking system developed under British rule in the 18th century with agencies establishing the first joint-stock banks. To fulfill growing banking needs, the British established the Presidency Banks in the early 19th century. After independence, the Reserve Bank of India was established in 1935 and banks were gradually nationalized in 1969 and 1980 to promote development and access to credit across the country. Private sector banking was reopened in 1993.
Fmi 7 rbi
This document discusses monetary policy and the role of central banks. It outlines the objectives of monetary policy as maintaining price stability, managing the flow of credit, promoting economic growth, ensuring financial stability, and influencing interest rates. The document also mentions credit delivery, financial inclusion, and institutional developments as additional objectives of monetary policy.
More from yogesh ingle (20)
Lecture 5 & 6 ba 5 & 6 statistics for business analytics
Lecture 5 & 6 ba 5 & 6 statistics for business analytics
8 foreign direct investment & foreign portfolio investor
8 foreign direct investment & foreign portfolio investor
SRBS lecture 2
- 1. • The probability distribution of annual return on security are given below: • Compute the expected return on security. Return on Security Probability -0.35 0.04 -.25 0.08 -0.15 0.14 -0.05 0.17 0.05 0.26 0.15 0.18 0.25 0.09 0.35 0.04 ingleyogeshh@gmail.com
- 2. • Expected return= 0.013 = 1.3% Return on Security Probability Expected return -0.35 0.04 -0.014 -.25 0.08 -0.020 -0.15 0.14 -0.021 -0.05 0.17 -0.009 0.05 0.26 0.013 0.15 0.18 0.027 0.25 0.09 0.023 0.35 0.04 0.014 Expected Value 0.013 ingleyogeshh@gmail.com
- 3. • Mr. Rajan wants to invest in company A or company B. The return on stock A and B and probabilities are given below: Advice Mr. Rajan, whether he should invest in company A or B Company A Company B Return % Probability Return % Probability 6 0.10 4 0.1 7 0.25 6 0.2 8 0.30 8 0.4 9 0.25 10 0.2 10 0.10 12 0.1 ingleyogeshh@gmail.com
- 4. • Calculation of Expected Return Company A Company B R (i) P ER R (i) P ER 6 0.10 0.60 4 0.1 0.40 7 0.25 1.75 6 0.2 1.20 8 0.30 2.40 8 0.4 3.20 9 0.25 2.25 10 0.2 2.00 10 0.10 1.00 12 0.1 1.20 ∑ 8 ∑ 8 ingleyogeshh@gmail.com
- 5. • Calculation of Standard Deviation of stock A • Mean R (i) = 40/5=8 • Standard Deviation: 1.14 R (i) R (i) – Mean R (i) [R (i) – Mean R (i)] 2 P P * [R (i) – Mean R (i)] 2 6 -2 4.00 0.10 0.40 7 -1 1.00 0.25 0.25 8 0 0.00 0.30 0.00 9 1 1.00 0.25 0.25 10 2 4.00 0.10 0.40 40 1.30 ingleyogeshh@gmail.com
- 6. • Calculation of Standard Deviation of stock B • Mean R (i) = 40/5=8 • Standard Deviation: 2.19 R (i) R (i) – Mean R (i) [R (i) – Mean R (i)] 2 P P * [R (i) – Mean R (i)] 2 4 -4 16 0.10 1.60 6 -2 4 0.20 0.80 8 0 0 0.40 0.00 10 2 4 0.20 0.80 12 4 16 0.10 1.60 40 4.80 ingleyogeshh@gmail.com
- 7. Analysis Stock A (%) Stock B(%) Average Return 8 8 Risk 1.14 2.19 ingleyogeshh@gmail.com
- 8. • Following is the data relating to five securities. • Which of the securities should be selected for investment? • Assuming prefect correlation, analyse whether it is preferable to invest 75% in security A and 25% in security C Security A B C D E Returns (%) 8 8 12 4 9 Risk S.D (%) 4 5 12 4 5 ingleyogeshh@gmail.com
- 9. Analysis • Which of the securities should be selected for investment? 1. A 2. C 3. E ingleyogeshh@gmail.com
- 10. Assuming prefect correlation, analyse whether it is preferable to invest 75% in security A and 25% in security C In case of positive correlation exists between two securities, their risk and return can be averaged with the proportion. Hence proportion of 3:1 for risk and return will be as follows: Risk = [(3*4) + (1*12)]/ 4 = 6% Return = [(3*8) + (1*12)]/ 4 = 9% ingleyogeshh@gmail.com
- 11. • Comparing the above average risk and return with security E, it is better to invest in E as it has less risk for the same return of 6% Stock A & C (%) Stock E (%) Average Return 9 9 Risk 6 6 ingleyogeshh@gmail.com