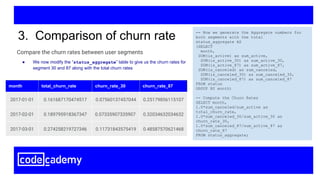
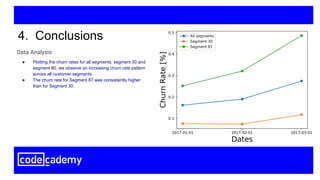
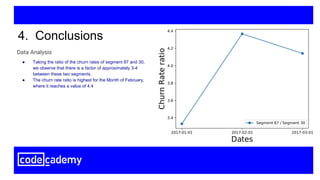
Churn rates with Codeflix
Learn SQL from scratch: Capstone project
Oscar Javier Hernandez
June 28, 2018
Table of contents
1. Getting familiar with Codeflix
2. Churn rates
3. Churn rate comparison
4. Conclusions
1. Getting familiar with
Codeflix
The company that we are analysing is a monthly video streaming service called
CodeFlix. To get acquainted with the data in the table, we look at the first 100 rows of
the table.
1. Getting familiar with codeflix
-- Select the first 100 rows of the table
SELECT *
FROM subscriptions
LIMIT 100;
id subscription_start subscription_end segment
1 2016-12-01 2017-02-01 87
2 2016-12-01 2017-01-24 87
... ... ... ...
The table contains 4 columns, the id, the start and end of the subscription, and the
customer segment.
What segments of users exist?
1. Getting familiar with codeflix
-- Select the number of distinct segments
SELECT DISTINCT segment, COUNT(*) as ‘Number of
customers’
FROM subscriptions;
segment Number of customers
30 1000
87 1000
From the results of our SQL query, we see that there are two different customer
segments: segment 87 and segment 30. Both contain 1000 customers.
How many months has the company been operating? Which
months do you have enough information to calculate a churn
rate?
1. Getting familiar with codeflix
-- We return for the minimum and maximum start
-- dates in the database
SELECT MIN(subscription_start) AS
‘min_start_date’,
MAX(subscription_start) AS
‘max_start-date’
FROM subscriptions;
min_start_date max_start_date
2016-12-01 2017-03-30
Based on this SQL query, the number of months between the min and max dates is
four. This is the number of months that the company has been operating. We can only
compute the churn rate for three months (2017-01,2017-02,2017-03) because there
are no subscription_end values for the December 2016.
2. Churn rates
The Churn rate is the percentage of subscribers that have canceled within a certain period, usually a
month. To calculate the churn rate, we only will be considering users who are subscribed at the beginning
of the month. The churn rate is the number of these users who cancel during the month divided by the
total number
2. Churn rates
Cancellations
Total subscribers
Churn
=
What is the overall churn trend since the company started?
2. Churn rates -- CREATE A temporary table for MONTHS
WITH months AS
(SELECT
'2017-01-01' as first_day,
'2017-01-31' as last_day
UNION
SELECT
'2017-02-01' as first_day,
'2017-02-28' as last_day
UNION
SELECT
'2017-03-01' as first_day,
'2017-03-31' as last_day
),
● First we create a temporary table to store the three months that we will
calculate the churn rates for. We store it in the “months” table.
What is the overall churn trend since the company started?
2. Churn rates -- Now we cross Join the Months table with the
-- subscriptions table
cross_join AS
(SELECT *
FROM subscriptions
CROSS JOIN months),
● First we create a temporary table to store the three months that we will
calculate the churn rates for. We store it in the “months” table.
● We then take the temporary “months” table and perform a cross-join with the
“subscriptions” table. We store this table as “cross_join”
What is the overall churn trend since the company started?
2. Churn rates -- Now we Create the temporary status table for
-- the two customer Segments
status AS
(SELECT id, first_day as month,
-- The is total active segment
CASE
WHEN (subscription_start < first_day)
AND (
subscription_end > first_day
OR subscription_end IS NULL
)
THEN 1
ELSE 0
END as is_active,
-- The is cancelled segment
CASE
WHEN (subscription_end BETWEEN first_day AND
last_day)
THEN 1
ELSE 0
END as is_canceled FROM cross_join),
● First we create a temporary table to store the three months that we will
calculate the churn rates for. We store it in the “months” table.
● We then take the temporary “months” table and perform a cross-join with the
“subscriptions” table. We store this table as “cross_join”
● We then take this cross joined table and compute the number of active and
cancelled users using “CASE”, store this in the “status” table
What is the overall churn trend since the company started?
2. Churn rates -- Now we generate the Aggregate numbers
status_aggregate AS
(SELECT
month,
SUM(is_active) as sum_active,
SUM(is_canceled) as sum_canceled
FROM status
GROUP BY month)
-- Compute the overall churn rate
SELECT month,
1.0*sum_canceled/sum_active as 'overall
churn_rate'
FROM status_aggregate;
month overall churn_rate
2017-01-01 0.161687170474517
2017-02-01 0.189795918367347
2017-03-01 0.274258219727346
● Finally we aggregate the “status” table into the “status_aggregate”
table, compute the number of cancelled and active members, sorted by date.
From this we compute the churn rate. The result is given below
3. Comparison of churn rates
Compare the churn rates between user segments
3. Comparison of churn rates status AS
(SELECT id, first_day as month,
...
-- The is active 87 segment
CASE
WHEN (subscription_start < first_day)
AND ( subscription_end > first_day
OR subscription_end IS NULL)
AND segment = 87
THEN 1
ELSE 0
END as is_active_87,
-- The is cancelled 87 segment
CASE
WHEN (subscription_end BETWEEN first_day AND
last_day) AND ( segment= 87)
THEN 1
ELSE 0
END as is_canceled_87,
…
FROM cross_join),
● We now want to compare the churn rates for segment 87 and 30, to do so we
add another case to our previous “status” table with the AND statement.
● The SQL query on the right shows how the case is modified to select segment
87.
Compare the churn rates between user segments
3. Comparison of churn rates status AS
(SELECT id, first_day as month,
...
-- The is active 30 segment
CASE
WHEN (subscription_start < first_day)
AND ( subscription_end > first_day
OR subscription_end IS NULL)
AND segment = 30
THEN 1
ELSE 0
END as is_active_30,
-- The is cancelled 30 segment
CASE
WHEN (subscription_end BETWEEN first_day AND
last_day) AND ( segment= 30)
THEN 1
ELSE 0
END as is_canceled_30,
…
FROM cross_join),
● We now want to compare the churn rates for segment 87 and 30, to do so we
add another case to our previous “status” table with the AND statement.
● The SQL query on the right shows how the case is modified to select segment
87.
● Now we modify the SQL query on the right and add a case statement to
select segment 30.
Compare the churn rates between user segments
3. Comparison of churn rate -- Now we generate the Aggregate numbers for
both segments with the total
status_aggregate AS
(SELECT
month,
SUM(is_active) as sum_active,
SUM(is_active_30) as sum_active_30,
SUM(is_active_87) as sum_active_87,
SUM(is_canceled) as sum_canceled,
SUM(is_canceled_30) as sum_canceled_30,
SUM(is_canceled_87) as sum_canceled_87
FROM status
GROUP BY month)
-- Compute the Churn Rates
SELECT month,
1.0*sum_canceled/sum_active as
total_churn_rate,
1.0*sum_canceled_30/sum_active_30 as
churn_rate_30,
1.0*sum_canceled_87/sum_active_87 as
churn_rate_87
FROM status_aggregate;
● We now modify the “status_aggregate” table to give us the churn rates for
segment 30 and 87 along with the total churn rates
month total_churn_rate churn_rate_30 churn_rate_87
2017-01-01 0.161687170474517 0.07560137457044 0.25179856115107
2017-02-01 0.189795918367347 0.07335907335907 0.32034632034632
2017-03-01 0.274258219727346 0.11731843575419 0.48587570621468
4. Conclusions
4. Conclusions
● Plotting the churn rates for all segments, segment 30 and
segment 80, we observe an increasing churn rate pattern
across all customer segments.
● The churn rate for Segment 87 was consistently higher
than for Segment 30.
Data Analysis
4. Conclusions
● Taking the ratio of the churn rates of segment 87 and 30,
we observe that there is a factor of approximately 3-4
between these two segments.
● The churn rate ratio is highest for the Month of February,
where it reaches a value of 4.4
Data Analysis
4. Conclusions
● Based on our analysis we can conclude that the churn rate increased from
Jan- March. If possible, Codeflix should identify what caused the increase in
churn rates for these months and take actions to reduce the churn rate.
● In particular, we found that customer segment 87, had a very high churn rate
in comparison to segment 30. Codeflix should make changes to how they
handle segment 87, in order to reduce the churn rate.
● Codeflix should focus on expanding segment 30 and changing their
approach to segment 87. That would reduce the overall churn rate.
● Additional customer segments could be created by Codeflix to test and
implement different methods of reducing churn rates.
Which segment of users should the company focus on expanding?

SQL intensive capstone project: Churn Rates

  • 1.
    Churn rates withCodeflix Learn SQL from scratch: Capstone project Oscar Javier Hernandez June 28, 2018
  • 2.
    Table of contents 1.Getting familiar with Codeflix 2. Churn rates 3. Churn rate comparison 4. Conclusions
  • 3.
    1. Getting familiarwith Codeflix
  • 4.
    The company thatwe are analysing is a monthly video streaming service called CodeFlix. To get acquainted with the data in the table, we look at the first 100 rows of the table. 1. Getting familiar with codeflix -- Select the first 100 rows of the table SELECT * FROM subscriptions LIMIT 100; id subscription_start subscription_end segment 1 2016-12-01 2017-02-01 87 2 2016-12-01 2017-01-24 87 ... ... ... ... The table contains 4 columns, the id, the start and end of the subscription, and the customer segment.
  • 5.
    What segments ofusers exist? 1. Getting familiar with codeflix -- Select the number of distinct segments SELECT DISTINCT segment, COUNT(*) as ‘Number of customers’ FROM subscriptions; segment Number of customers 30 1000 87 1000 From the results of our SQL query, we see that there are two different customer segments: segment 87 and segment 30. Both contain 1000 customers.
  • 6.
    How many monthshas the company been operating? Which months do you have enough information to calculate a churn rate? 1. Getting familiar with codeflix -- We return for the minimum and maximum start -- dates in the database SELECT MIN(subscription_start) AS ‘min_start_date’, MAX(subscription_start) AS ‘max_start-date’ FROM subscriptions; min_start_date max_start_date 2016-12-01 2017-03-30 Based on this SQL query, the number of months between the min and max dates is four. This is the number of months that the company has been operating. We can only compute the churn rate for three months (2017-01,2017-02,2017-03) because there are no subscription_end values for the December 2016.
  • 7.
  • 8.
    The Churn rateis the percentage of subscribers that have canceled within a certain period, usually a month. To calculate the churn rate, we only will be considering users who are subscribed at the beginning of the month. The churn rate is the number of these users who cancel during the month divided by the total number 2. Churn rates Cancellations Total subscribers Churn =
  • 9.
    What is theoverall churn trend since the company started? 2. Churn rates -- CREATE A temporary table for MONTHS WITH months AS (SELECT '2017-01-01' as first_day, '2017-01-31' as last_day UNION SELECT '2017-02-01' as first_day, '2017-02-28' as last_day UNION SELECT '2017-03-01' as first_day, '2017-03-31' as last_day ), ● First we create a temporary table to store the three months that we will calculate the churn rates for. We store it in the “months” table.
  • 10.
    What is theoverall churn trend since the company started? 2. Churn rates -- Now we cross Join the Months table with the -- subscriptions table cross_join AS (SELECT * FROM subscriptions CROSS JOIN months), ● First we create a temporary table to store the three months that we will calculate the churn rates for. We store it in the “months” table. ● We then take the temporary “months” table and perform a cross-join with the “subscriptions” table. We store this table as “cross_join”
  • 11.
    What is theoverall churn trend since the company started? 2. Churn rates -- Now we Create the temporary status table for -- the two customer Segments status AS (SELECT id, first_day as month, -- The is total active segment CASE WHEN (subscription_start < first_day) AND ( subscription_end > first_day OR subscription_end IS NULL ) THEN 1 ELSE 0 END as is_active, -- The is cancelled segment CASE WHEN (subscription_end BETWEEN first_day AND last_day) THEN 1 ELSE 0 END as is_canceled FROM cross_join), ● First we create a temporary table to store the three months that we will calculate the churn rates for. We store it in the “months” table. ● We then take the temporary “months” table and perform a cross-join with the “subscriptions” table. We store this table as “cross_join” ● We then take this cross joined table and compute the number of active and cancelled users using “CASE”, store this in the “status” table
  • 12.
    What is theoverall churn trend since the company started? 2. Churn rates -- Now we generate the Aggregate numbers status_aggregate AS (SELECT month, SUM(is_active) as sum_active, SUM(is_canceled) as sum_canceled FROM status GROUP BY month) -- Compute the overall churn rate SELECT month, 1.0*sum_canceled/sum_active as 'overall churn_rate' FROM status_aggregate; month overall churn_rate 2017-01-01 0.161687170474517 2017-02-01 0.189795918367347 2017-03-01 0.274258219727346 ● Finally we aggregate the “status” table into the “status_aggregate” table, compute the number of cancelled and active members, sorted by date. From this we compute the churn rate. The result is given below
  • 13.
    3. Comparison ofchurn rates
  • 14.
    Compare the churnrates between user segments 3. Comparison of churn rates status AS (SELECT id, first_day as month, ... -- The is active 87 segment CASE WHEN (subscription_start < first_day) AND ( subscription_end > first_day OR subscription_end IS NULL) AND segment = 87 THEN 1 ELSE 0 END as is_active_87, -- The is cancelled 87 segment CASE WHEN (subscription_end BETWEEN first_day AND last_day) AND ( segment= 87) THEN 1 ELSE 0 END as is_canceled_87, … FROM cross_join), ● We now want to compare the churn rates for segment 87 and 30, to do so we add another case to our previous “status” table with the AND statement. ● The SQL query on the right shows how the case is modified to select segment 87.
  • 15.
    Compare the churnrates between user segments 3. Comparison of churn rates status AS (SELECT id, first_day as month, ... -- The is active 30 segment CASE WHEN (subscription_start < first_day) AND ( subscription_end > first_day OR subscription_end IS NULL) AND segment = 30 THEN 1 ELSE 0 END as is_active_30, -- The is cancelled 30 segment CASE WHEN (subscription_end BETWEEN first_day AND last_day) AND ( segment= 30) THEN 1 ELSE 0 END as is_canceled_30, … FROM cross_join), ● We now want to compare the churn rates for segment 87 and 30, to do so we add another case to our previous “status” table with the AND statement. ● The SQL query on the right shows how the case is modified to select segment 87. ● Now we modify the SQL query on the right and add a case statement to select segment 30.
  • 16.
    Compare the churnrates between user segments 3. Comparison of churn rate -- Now we generate the Aggregate numbers for both segments with the total status_aggregate AS (SELECT month, SUM(is_active) as sum_active, SUM(is_active_30) as sum_active_30, SUM(is_active_87) as sum_active_87, SUM(is_canceled) as sum_canceled, SUM(is_canceled_30) as sum_canceled_30, SUM(is_canceled_87) as sum_canceled_87 FROM status GROUP BY month) -- Compute the Churn Rates SELECT month, 1.0*sum_canceled/sum_active as total_churn_rate, 1.0*sum_canceled_30/sum_active_30 as churn_rate_30, 1.0*sum_canceled_87/sum_active_87 as churn_rate_87 FROM status_aggregate; ● We now modify the “status_aggregate” table to give us the churn rates for segment 30 and 87 along with the total churn rates month total_churn_rate churn_rate_30 churn_rate_87 2017-01-01 0.161687170474517 0.07560137457044 0.25179856115107 2017-02-01 0.189795918367347 0.07335907335907 0.32034632034632 2017-03-01 0.274258219727346 0.11731843575419 0.48587570621468
  • 17.
  • 18.
    4. Conclusions ● Plottingthe churn rates for all segments, segment 30 and segment 80, we observe an increasing churn rate pattern across all customer segments. ● The churn rate for Segment 87 was consistently higher than for Segment 30. Data Analysis
  • 19.
    4. Conclusions ● Takingthe ratio of the churn rates of segment 87 and 30, we observe that there is a factor of approximately 3-4 between these two segments. ● The churn rate ratio is highest for the Month of February, where it reaches a value of 4.4 Data Analysis
  • 20.
    4. Conclusions ● Basedon our analysis we can conclude that the churn rate increased from Jan- March. If possible, Codeflix should identify what caused the increase in churn rates for these months and take actions to reduce the churn rate. ● In particular, we found that customer segment 87, had a very high churn rate in comparison to segment 30. Codeflix should make changes to how they handle segment 87, in order to reduce the churn rate. ● Codeflix should focus on expanding segment 30 and changing their approach to segment 87. That would reduce the overall churn rate. ● Additional customer segments could be created by Codeflix to test and implement different methods of reducing churn rates. Which segment of users should the company focus on expanding?