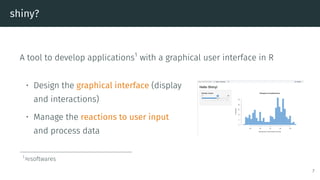
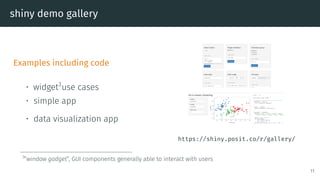
R shiny: building interactive graphical
applications
Ghislain Durif and Jean-Michel Marin
February 19, 2024
Laboratory of Biology and Modeling of the Cell (LBMC), ENS Lyon, France and CNRS – Institut Montpelliérain Alexander Grothendieck
(IMAG), University of Montpellier
Introduction
2
Resources
• Official shiny website https://shiny.posit.co/
• App example gallery https://shiny.posit.co/r/gallery/
• Articles https://shiny.posit.co/r/articles/
• Video and written tutorials
https://shiny.posit.co/r/getstarted/shiny-
basics/lesson1/index.html
• Mastering shiny by Hadley Wickham
https://mastering-shiny.org/
3
User interface
How a software interact with its users?
• command line interface (CLI)
• graphical user interface (GUI)
4
Command line tools
• Shell/Terminal command line interface (e.g. bash)
user@host $ ls
file.raw hello_world.R README.md shiny_training.Rproj slides
user@host $ Rscript hello_world.R
[1] ”doing something”
|++++++++++++++++++++++++++++++++++++++++++++++++++| 100% elapsed=01s
• R console
> library(pbapply)
> print(”HelloWorld”)
[1] ”HelloWorld”
> res <- pblapply(1:1000, function(i) sum(i * seq(1,1E5)))
|++++++++++++++++++++++++++++++++++++++++++++++++++| 100% elapsed=01s
• Python console, etc.
5
Graphical user interface
• Graphical display and visual effects/interactions (e.g. buttons to
click)
Examples:
• RStudio = GUI to edit and run R code
• Spyder = GUI to edit and run Python code
• OS graphical environment (”super GUI”)
• Web browser
• ...
6
shiny?
A tool to develop applications1
with a graphical user interface in R
• Design the graphical interface (display
and interactions)
• Manage the reactions to user input
and process data
1
≈softwares
7
Client/server model
shiny app = web application
• a client (frontend) = a web browser managing the graphical
rendering and interactions with the user
• a server2
(backend) to process user input or data, and produce
output (e.g. run R codes)
2
local or remote
8
shiny
9
shiny user showcase gallery
https://shiny.posit.co/r/gallery/
10
shiny demo gallery
Examples including code
• widget3
use cases
• simple app
• data visualization app
https://shiny.posit.co/r/gallery/
3
”window gadget”, GUI components generally able to interact with users
11
shiny app template
library(shiny)
ui <- fluidPage()
server <- function(input, output) {}
shinyApp(ui = ui, server = server)
## Listening on http://127.0.0.1:5138
12
Frontend: user interface (UI) management
Under the hood:
• appearence: HTML4
and CSS5
• reactivity: javascript6
4
standard markup language for web document design
5
style sheet language used to describe the presentation of a document written in a markup language
6
scripting language managed client-side by web browsers
13
UI design in practice with shiny
Forget about HTML/CSS/JS? (not true for advanced customization)
Intuitive UI design with R wrapper functions to manage:
• graphical components and layout organisation (wrapping HTML)
and style management (wrapping CSS)
• reactivity to user input (wrapping JS)
14
UI design in shiny: an example
ui <- fluidPage(
headerPanel('Iris k-means clustering'),
sidebarPanel(
selectInput('xcol', 'X Variable', names(iris)),
selectInput('ycol', 'Y Variable', names(iris),
selected = names(iris)[2]),
numericInput('clusters', 'Cluster count',
3,min = 1, max = 9)),
mainPanel(plotOutput('plot1'))
)
Hidden step (HTML conversion)
15
UI design in shiny: an example
ui <- fluidPage(
headerPanel('Iris k-means clustering'),
sidebarPanel(
selectInput('xcol', 'X Variable', names(iris)),
selectInput('ycol', 'Y Variable', names(iris),
selected = names(iris)[2]),
numericInput('clusters', 'Cluster count',
3,min = 1, max = 9)),
mainPanel(plotOutput('plot1'))
)
Display
Layout only (before server processing)
15
UI design in shiny: an example
ui <- fluidPage(
headerPanel('Iris k-means clustering'),
sidebarPanel(
selectInput('xcol', 'X Variable', names(iris)),
selectInput('ycol', 'Y Variable', names(iris),
selected = names(iris)[2]),
numericInput('clusters', 'Cluster count',
3,min = 1, max = 9)),
mainPanel(plotOutput('plot1'))
)
Display
Layout + reactivity (with server processing)
15
UI elements
HTML-wrapping elements:
• all standard tags (headers, hyperlink, etc.)
• pre-packaged layouts (grid with rows and columns, panels, tabs,
etc.)
• widgets for user input (sliders, numeric input, text input, etc.)
• output display elements (to render display/visualization of
data/result)
Possible to add CSS styling (with optional arguments, e.g. style = 16
Backend (server-side): management of input and events
Reactivity = reaction to user input or to events
• Data/information stored in reactive values
• information provided by user input
• intermediate or final processing results
• Modification of a reactive value triggers a server-side chain
reaction
• Web server implementation managed by shiny
17
User input
UI-side
ui <- fluidPage(
sliderInput(inputId = ”num”,label = ”Choose a number”,
value = 25, min = 1, max = 100)
)
Server-side
server <- function(input, output){
observe(print(input$num))
}
Display
Input processing done server-side
R console (server-side)
## Listening on http://127.0.0.1:5138
## [1] 25
## [1] 30
18
Output rendering
UI-side
ui <- fluidPage(
textInput(inputId = ”input_txt”,label = ”Write me”),
verbatimTextOutput(outputId = ”output_txt”,placeholder = TRUE)
)
Server-side
server <- function(input, output){
output$output_txt <- renderText(input$input_txt)
}
Display
Input processing done server-side
19
Events
UI-side
ui <- fluidPage(
actionButton(inputId = ”click”,label = ”Click me”)
)
Server-side
server <- function(input, output){
observeEvent(input$click,print(as.numeric(input$click)))
}
Display
Input processing done server-side
R console (server-side)
## Listening on http://127.0.0.1:5138
## [1] 1
## [1] 2
20
Reactivity
Server-side: reactive values including all UI inputs and local data
1. Modification of reactive value(s): input given by user in UI, or local
data modified by server (in a previous reaction chain)
2. Invalidation of all events and outputs depending on the modified
reactive value(s)
3. Processing code chunks corresponding to all invalidated events
(data processing) and outputs (graphical rendering)
21
Complete shiny app
• UI-side = combination of layouts, HTML-wrapped elements, widgets,
UI input and output elements
• server-side = R codes orchestrating input/data processing and
output rendering
22
Create interface modules
• Complete implementation of complex UI elements and
corresponding server-side logic
• Modules are reusable “autonomous” units in a shiny app
Tutorials:
• Modularizing shiny app code (https://shiny.posit.co/r/articles/improve/modules/)
• Communication between modules
(https://shiny.posit.co/r/articles/improve/communicate-bet-modules/)
23
Additional shiny features
• shinyFiles: https://github.com/thomasp85/shinyFiles (manage
files/directory)
• shinyWidgets: https://github.com/dreamRs/shinyWidgets (additional
components)
• shinybusy: https://github.com/dreamRs/shinybusy (busy indicator)
• shinydashboard: https://rstudio.github.io/shinydashboard/
(dashboard interface)
• shinyjs: https://github.com/daattali/shinyjs (javascript-based
reactivity)
24
Releasing and sharing your shiny app
• Publish the R code for people to run on their machine/server
• Host the app on a shiny server (yours7
or
https://www.shinyapps.io/)
• Develop and release your shiny app as an R package
7
https://docs.posit.co/shiny-server/
25
Limits
• Out-of-the-box style is nice but recognizable
• UI advanced customization requires knowledge of HTML/CSS/JS
• All server-side processing (computations) done in R, potential
performance limitation (may be overcome by language interfacing,
c.f. later)
26
Examples of ML related apps
• https://github.com/davesteps/machLearn (local app) or
https://davesteps.shinyapps.io/machLearn/ (remote
app)
• https://github.com/RamiKrispin/MLstudio (packaged
app)
27
Some alternatives
28
Shiny for python now available
https://shiny.posit.co/py/
Shiny express: A simpler way to write and learn Shiny.
https://shiny.posit.co/blog/posts/shiny-express/
29
Python ipywidget
https://ipywidgets.readthedocs.io/
• Widgets in Jupyter
notebooks
• Interactive notebook
• Development of
complete graphical
application? Example: https://github.com/josephsalmon/Random-Widgets
30
Python Dash
https://dash.plotly.com
• Client/server logic
• Design display and
manage reactivity
• Less intuitive
server-side
implementation? Dash gallery: https://dash-gallery.plotly.host/Portal/
31
reticulate R package
https://rstudio.github.io/reticulate/
• Call Python code directly from R (e.g. in your shiny app)
• Direct import of Python packages
• Support Python virtual environments or Conda environments
32
reticulate R package
# setup
library(reticulate)
use_python(”~/anaconda3/bin/python”)
use_condaenv(condaenv = ”base”, conda = ”~/anaconda3/bin/conda”)
# import
skl_lr <- import(”sklearn.linear_model”)
# data
x <- as.matrix(rnorm(100, sd = 2))
y <- 2 * x + as.matrix(rnorm(100))
# model
lr <- skl_lr$LinearRegression()
# training
lr$fit(r_to_py(x), r_to_py(y))
## LinearRegression()
lr$coef_
## [,1]
## [1,] 1.977388
33
Rcpp R package
http://rcpp.org/
• Seamless interfacing of C++ code in R
• Binder automatic generation
• C++ code compilation on the fly or smooth integration in R package installation
• Easy integration of header C++ libraries (RcppEigen for Eigen8
, BH for Boost9
)
8
linear algebra library
9
collection of C++ libraries, including maths libraries, etc.
34
Rcpp R package
In my_file.cpp
#include <Rcpp.h>
usingnamespaceRcpp;
// [[Rcpp::export]]
NumericVector timesTwo(NumericVector x) {return x *2;}
In R:
sourceCpp(”my_file.cpp”)
x <- rnorm(100)
y <- timesTwo(x)
35
To conclude
36
Take-home message
R shiny: develop graphical application as web app
Client-side (frontend)
• Simple out-of-the-box webdesign with user interaction
• Possible customization (HTML, CSS, JavaScript)
Server-side (backend)
• Reactivity to user input
• User input and data processing
37

R programming for statistics and dash board

  • 1.
    R shiny: buildinginteractive graphical applications Ghislain Durif and Jean-Michel Marin February 19, 2024 Laboratory of Biology and Modeling of the Cell (LBMC), ENS Lyon, France and CNRS – Institut Montpelliérain Alexander Grothendieck (IMAG), University of Montpellier
  • 2.
  • 3.
    Resources • Official shinywebsite https://shiny.posit.co/ • App example gallery https://shiny.posit.co/r/gallery/ • Articles https://shiny.posit.co/r/articles/ • Video and written tutorials https://shiny.posit.co/r/getstarted/shiny- basics/lesson1/index.html • Mastering shiny by Hadley Wickham https://mastering-shiny.org/ 3
  • 4.
    User interface How asoftware interact with its users? • command line interface (CLI) • graphical user interface (GUI) 4
  • 5.
    Command line tools •Shell/Terminal command line interface (e.g. bash) user@host $ ls file.raw hello_world.R README.md shiny_training.Rproj slides user@host $ Rscript hello_world.R [1] ”doing something” |++++++++++++++++++++++++++++++++++++++++++++++++++| 100% elapsed=01s • R console > library(pbapply) > print(”HelloWorld”) [1] ”HelloWorld” > res <- pblapply(1:1000, function(i) sum(i * seq(1,1E5))) |++++++++++++++++++++++++++++++++++++++++++++++++++| 100% elapsed=01s • Python console, etc. 5
  • 6.
    Graphical user interface •Graphical display and visual effects/interactions (e.g. buttons to click) Examples: • RStudio = GUI to edit and run R code • Spyder = GUI to edit and run Python code • OS graphical environment (”super GUI”) • Web browser • ... 6
  • 7.
    shiny? A tool todevelop applications1 with a graphical user interface in R • Design the graphical interface (display and interactions) • Manage the reactions to user input and process data 1 ≈softwares 7
  • 8.
    Client/server model shiny app= web application • a client (frontend) = a web browser managing the graphical rendering and interactions with the user • a server2 (backend) to process user input or data, and produce output (e.g. run R codes) 2 local or remote 8
  • 9.
  • 10.
    shiny user showcasegallery https://shiny.posit.co/r/gallery/ 10
  • 11.
    shiny demo gallery Examplesincluding code • widget3 use cases • simple app • data visualization app https://shiny.posit.co/r/gallery/ 3 ”window gadget”, GUI components generally able to interact with users 11
  • 12.
    shiny app template library(shiny) ui<- fluidPage() server <- function(input, output) {} shinyApp(ui = ui, server = server) ## Listening on http://127.0.0.1:5138 12
  • 13.
    Frontend: user interface(UI) management Under the hood: • appearence: HTML4 and CSS5 • reactivity: javascript6 4 standard markup language for web document design 5 style sheet language used to describe the presentation of a document written in a markup language 6 scripting language managed client-side by web browsers 13
  • 14.
    UI design inpractice with shiny Forget about HTML/CSS/JS? (not true for advanced customization) Intuitive UI design with R wrapper functions to manage: • graphical components and layout organisation (wrapping HTML) and style management (wrapping CSS) • reactivity to user input (wrapping JS) 14
  • 15.
    UI design inshiny: an example ui <- fluidPage( headerPanel('Iris k-means clustering'), sidebarPanel( selectInput('xcol', 'X Variable', names(iris)), selectInput('ycol', 'Y Variable', names(iris), selected = names(iris)[2]), numericInput('clusters', 'Cluster count', 3,min = 1, max = 9)), mainPanel(plotOutput('plot1')) ) Hidden step (HTML conversion) 15
  • 16.
    UI design inshiny: an example ui <- fluidPage( headerPanel('Iris k-means clustering'), sidebarPanel( selectInput('xcol', 'X Variable', names(iris)), selectInput('ycol', 'Y Variable', names(iris), selected = names(iris)[2]), numericInput('clusters', 'Cluster count', 3,min = 1, max = 9)), mainPanel(plotOutput('plot1')) ) Display Layout only (before server processing) 15
  • 17.
    UI design inshiny: an example ui <- fluidPage( headerPanel('Iris k-means clustering'), sidebarPanel( selectInput('xcol', 'X Variable', names(iris)), selectInput('ycol', 'Y Variable', names(iris), selected = names(iris)[2]), numericInput('clusters', 'Cluster count', 3,min = 1, max = 9)), mainPanel(plotOutput('plot1')) ) Display Layout + reactivity (with server processing) 15
  • 18.
    UI elements HTML-wrapping elements: •all standard tags (headers, hyperlink, etc.) • pre-packaged layouts (grid with rows and columns, panels, tabs, etc.) • widgets for user input (sliders, numeric input, text input, etc.) • output display elements (to render display/visualization of data/result) Possible to add CSS styling (with optional arguments, e.g. style = 16
  • 19.
    Backend (server-side): managementof input and events Reactivity = reaction to user input or to events • Data/information stored in reactive values • information provided by user input • intermediate or final processing results • Modification of a reactive value triggers a server-side chain reaction • Web server implementation managed by shiny 17
  • 20.
    User input UI-side ui <-fluidPage( sliderInput(inputId = ”num”,label = ”Choose a number”, value = 25, min = 1, max = 100) ) Server-side server <- function(input, output){ observe(print(input$num)) } Display Input processing done server-side R console (server-side) ## Listening on http://127.0.0.1:5138 ## [1] 25 ## [1] 30 18
  • 21.
    Output rendering UI-side ui <-fluidPage( textInput(inputId = ”input_txt”,label = ”Write me”), verbatimTextOutput(outputId = ”output_txt”,placeholder = TRUE) ) Server-side server <- function(input, output){ output$output_txt <- renderText(input$input_txt) } Display Input processing done server-side 19
  • 22.
    Events UI-side ui <- fluidPage( actionButton(inputId= ”click”,label = ”Click me”) ) Server-side server <- function(input, output){ observeEvent(input$click,print(as.numeric(input$click))) } Display Input processing done server-side R console (server-side) ## Listening on http://127.0.0.1:5138 ## [1] 1 ## [1] 2 20
  • 23.
    Reactivity Server-side: reactive valuesincluding all UI inputs and local data 1. Modification of reactive value(s): input given by user in UI, or local data modified by server (in a previous reaction chain) 2. Invalidation of all events and outputs depending on the modified reactive value(s) 3. Processing code chunks corresponding to all invalidated events (data processing) and outputs (graphical rendering) 21
  • 24.
    Complete shiny app •UI-side = combination of layouts, HTML-wrapped elements, widgets, UI input and output elements • server-side = R codes orchestrating input/data processing and output rendering 22
  • 25.
    Create interface modules •Complete implementation of complex UI elements and corresponding server-side logic • Modules are reusable “autonomous” units in a shiny app Tutorials: • Modularizing shiny app code (https://shiny.posit.co/r/articles/improve/modules/) • Communication between modules (https://shiny.posit.co/r/articles/improve/communicate-bet-modules/) 23
  • 26.
    Additional shiny features •shinyFiles: https://github.com/thomasp85/shinyFiles (manage files/directory) • shinyWidgets: https://github.com/dreamRs/shinyWidgets (additional components) • shinybusy: https://github.com/dreamRs/shinybusy (busy indicator) • shinydashboard: https://rstudio.github.io/shinydashboard/ (dashboard interface) • shinyjs: https://github.com/daattali/shinyjs (javascript-based reactivity) 24
  • 27.
    Releasing and sharingyour shiny app • Publish the R code for people to run on their machine/server • Host the app on a shiny server (yours7 or https://www.shinyapps.io/) • Develop and release your shiny app as an R package 7 https://docs.posit.co/shiny-server/ 25
  • 28.
    Limits • Out-of-the-box styleis nice but recognizable • UI advanced customization requires knowledge of HTML/CSS/JS • All server-side processing (computations) done in R, potential performance limitation (may be overcome by language interfacing, c.f. later) 26
  • 29.
    Examples of MLrelated apps • https://github.com/davesteps/machLearn (local app) or https://davesteps.shinyapps.io/machLearn/ (remote app) • https://github.com/RamiKrispin/MLstudio (packaged app) 27
  • 30.
  • 31.
    Shiny for pythonnow available https://shiny.posit.co/py/ Shiny express: A simpler way to write and learn Shiny. https://shiny.posit.co/blog/posts/shiny-express/ 29
  • 32.
    Python ipywidget https://ipywidgets.readthedocs.io/ • Widgetsin Jupyter notebooks • Interactive notebook • Development of complete graphical application? Example: https://github.com/josephsalmon/Random-Widgets 30
  • 33.
    Python Dash https://dash.plotly.com • Client/serverlogic • Design display and manage reactivity • Less intuitive server-side implementation? Dash gallery: https://dash-gallery.plotly.host/Portal/ 31
  • 34.
    reticulate R package https://rstudio.github.io/reticulate/ •Call Python code directly from R (e.g. in your shiny app) • Direct import of Python packages • Support Python virtual environments or Conda environments 32
  • 35.
    reticulate R package #setup library(reticulate) use_python(”~/anaconda3/bin/python”) use_condaenv(condaenv = ”base”, conda = ”~/anaconda3/bin/conda”) # import skl_lr <- import(”sklearn.linear_model”) # data x <- as.matrix(rnorm(100, sd = 2)) y <- 2 * x + as.matrix(rnorm(100)) # model lr <- skl_lr$LinearRegression() # training lr$fit(r_to_py(x), r_to_py(y)) ## LinearRegression() lr$coef_ ## [,1] ## [1,] 1.977388 33
  • 36.
    Rcpp R package http://rcpp.org/ •Seamless interfacing of C++ code in R • Binder automatic generation • C++ code compilation on the fly or smooth integration in R package installation • Easy integration of header C++ libraries (RcppEigen for Eigen8 , BH for Boost9 ) 8 linear algebra library 9 collection of C++ libraries, including maths libraries, etc. 34
  • 37.
    Rcpp R package Inmy_file.cpp #include <Rcpp.h> usingnamespaceRcpp; // [[Rcpp::export]] NumericVector timesTwo(NumericVector x) {return x *2;} In R: sourceCpp(”my_file.cpp”) x <- rnorm(100) y <- timesTwo(x) 35
  • 38.
  • 39.
    Take-home message R shiny:develop graphical application as web app Client-side (frontend) • Simple out-of-the-box webdesign with user interaction • Possible customization (HTML, CSS, JavaScript) Server-side (backend) • Reactivity to user input • User input and data processing 37